Managing and improving the performance of preschools requires clear data insights. School administrators, teachers, and management teams must track multiple aspects such as student attendance, staff efficiency, curriculum delivery, and parent satisfaction. However, doing this manually with paper files or static spreadsheets often leads to confusion and wasted time.
This is where the Preschool KPI Dashboard in Power BI comes into play. It is a ready-to-use, visually rich, and interactive reporting solution that helps schools monitor performance metrics in real time. Built with Power BI and powered by an Excel dataset, this dashboard brings clarity and precision to preschool operations.
In this article, we will explore everything about the Preschool KPI Dashboard in Power BI—its features, setup, benefits, best practices, and how preschools can leverage it to create a culture of data-driven decision-making.
Click to Purchases Preschool KPI Dashboard in Power BI
What Is a Preschool KPI Dashboard in Power BI?
A Preschool KPI Dashboard in Power BI is a digital tool that allows preschool administrators and teachers to measure, track, and analyze key performance indicators (KPIs). It combines Power BI’s visualization power with structured Excel-based data input.
Instead of dealing with manual reports, the dashboard enables quick comparisons across months, years, and targets. Users can see whether KPIs are improving, meeting benchmarks, or falling behind.
Why Do Preschools Need a KPI Dashboard?
-
To measure learning outcomes.
-
To track attendance and engagement.
-
To evaluate teacher performance.
-
To ensure targets are being met consistently.
-
To streamline communication with parents and stakeholders.
Key Features of the Preschool KPI Dashboard in Power BI
The dashboard is divided into three key pages. Each page serves a specific purpose and works together to give a 360° view of preschool performance.
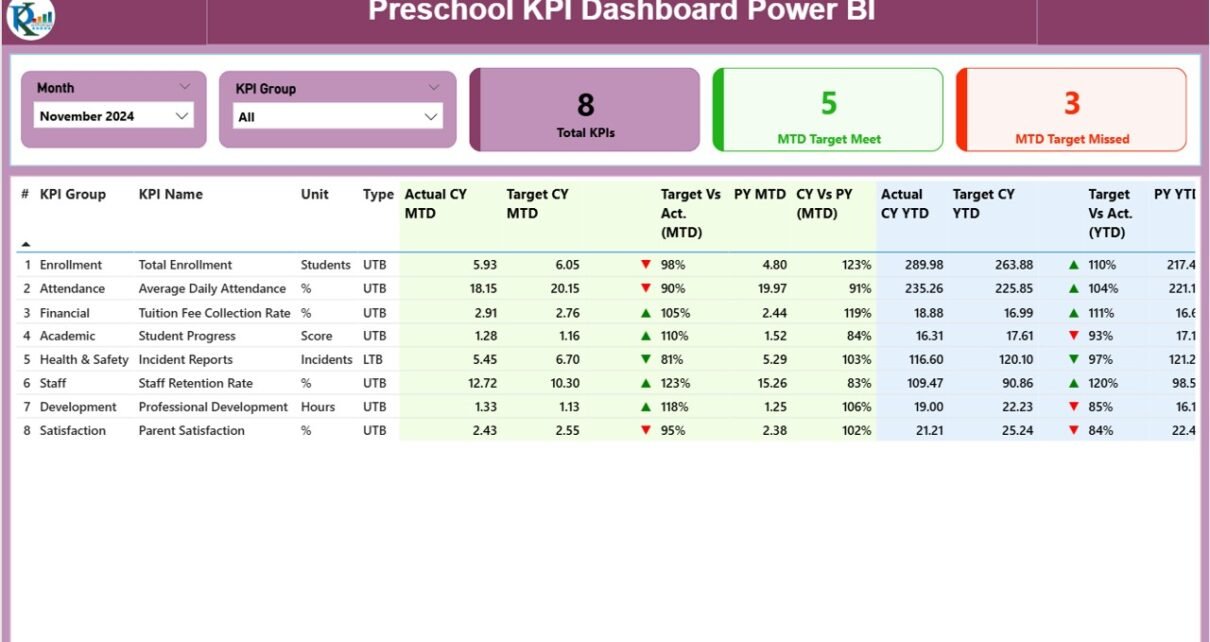
Summary Page
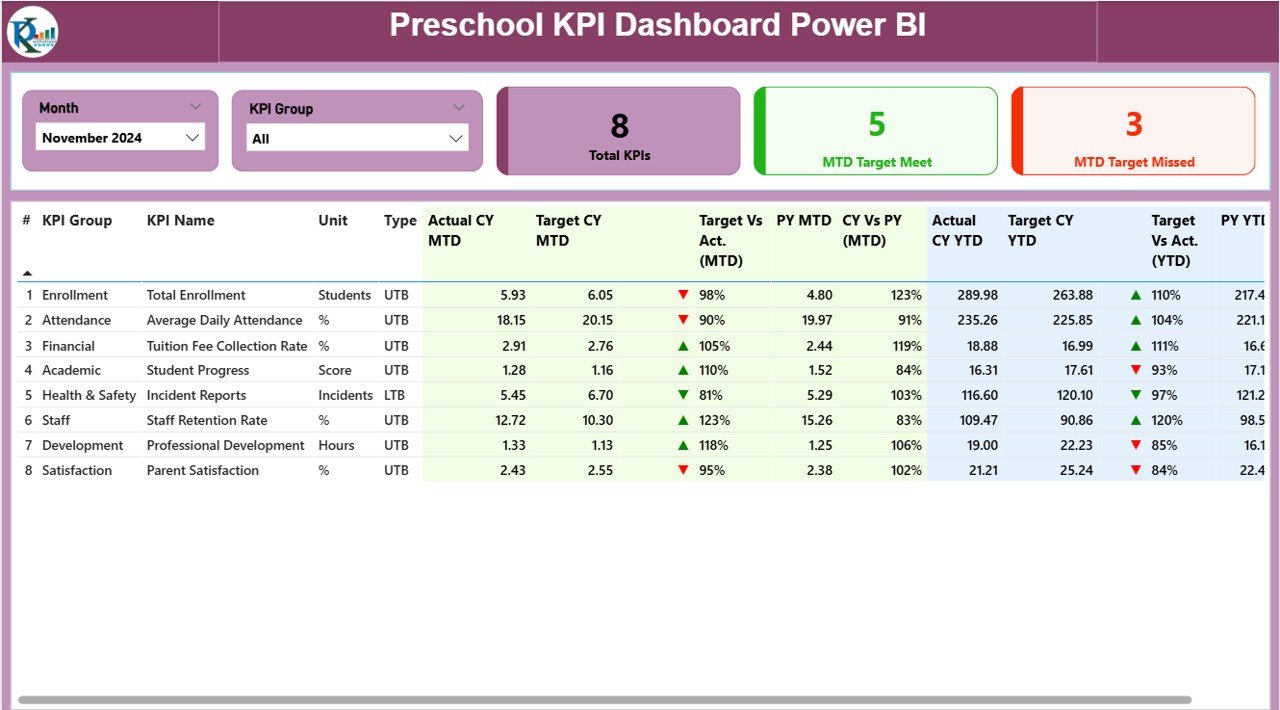
The Summary Page acts as the central hub of the dashboard.
-
At the top, you have slicers to filter data by Month and KPI Group.
It includes three cards showing:
- Total number of KPIs being tracked.
- MTD (Month-to-Date) Target Met count.
- MTD Target Missed count.
KPI Table on Summary Page
The detailed KPI table includes the following fields:
-
KPI Number: Unique sequence number for each KPI.
-
KPI Group: The group or category the KPI belongs to.
-
KPI Name: Specific name of the KPI (e.g., Student Attendance, Teacher Feedback Score).
-
Unit: Unit of measurement (percentage, count, ratio, etc.).
-
Type: Whether the KPI is LTB (Lower the Better) or UTB (Upper the Better).
-
Actual CY MTD: Current Year Month-to-Date actual value.
-
Target CY MTD: Target value for the same period.
-
MTD Icon: Visual arrow (▲ green for positive, ▼ red for negative) to indicate performance.
-
Target vs Actual (MTD): Percentage calculation showing if goals are achieved.
-
PY MTD: Previous Year’s MTD value for comparison.
-
CY vs PY (MTD): Comparison percentage between Current and Previous Year.
-
Actual CY YTD: Current Year Year-to-Date actual value.
-
Target CY YTD: Current Year Year-to-Date target value.
-
YTD Icon: Similar ▲▼ icons for YTD performance.
-
Target vs Actual (YTD): Percentage measure for long-term performance.
-
PY YTD: Previous Year’s YTD value.
-
CY vs PY (YTD): Year-on-Year comparison for deeper insights.
This page provides a snapshot of overall performance and allows stakeholders to act quickly.
Click to Purchases Preschool KPI Dashboard in Power BI
KPI Trend Page
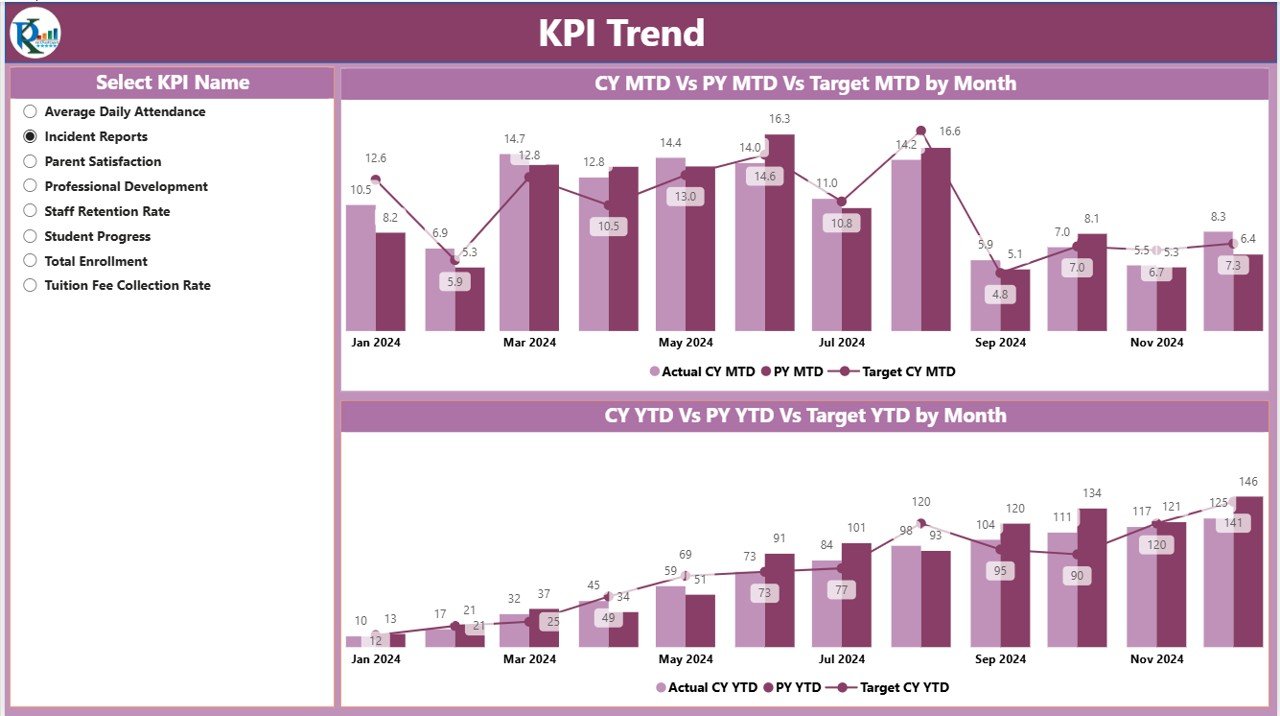
The KPI Trend Page provides a visual performance comparison.
It features two combo charts:
- One for Month-to-Date (MTD).
- One for Year-to-Date (YTD).
-
These charts show Actual, Target, and Previous Year values side by side.
-
A slicer on the left lets you filter and analyze individual KPIs.
This page helps preschool management track progress over time, identify seasonal patterns, and spot recurring challenges.
KPI Definition Page
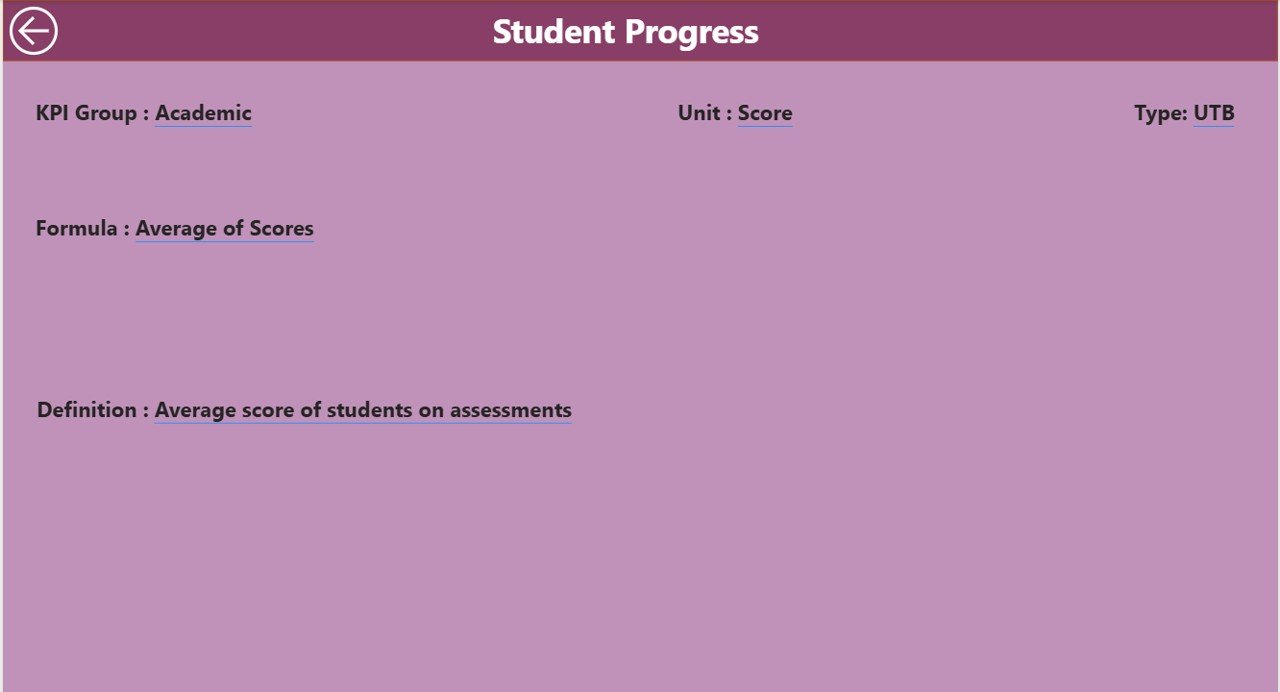
The KPI Definition Page is a hidden drill-through page. It provides detailed information about each KPI when users click on them from the Summary Page.
The page displays:
-
Formula: How the KPI is calculated.
-
Definition: Explanation of the KPI.
This ensures that teachers, administrators, and staff all have a consistent understanding of what each KPI means and how it is measured.
A Back Button is provided at the top-left corner to return to the Summary Page.
Data Source: Excel File Structure
The Preschool KPI Dashboard in Power BI relies on an Excel file as its backend. This ensures that data entry remains simple, while Power BI handles visualization.
The Excel file contains three sheets:
Input_Actual Sheet
- Columns: KPI Name, Month (use first date of the month), MTD Value, YTD Value.
- Purpose: Fill in actual performance values.
Input_Target Sheet
- Columns: KPI Name, Month (use first date of the month), MTD Target, YTD Target.
- Purpose: Capture target benchmarks.
KPI Definition Sheet
- Columns: KPI Number, KPI Group, KPI Name, Unit, Formula, Definition, Type (LTB/UTB).
- Purpose: Maintain a structured KPI catalog for consistency.
Advantages of Preschool KPI Dashboard in Power BI
Using a Power BI dashboard provides several benefits:
-
Centralized Monitoring 📊
Track all preschool performance indicators in one place. -
Data-Driven Decisions ✅
Compare actuals vs. targets to make informed choices. -
Improved Accountability 👩🏫
Teachers and staff know exactly where improvements are needed. -
Real-Time Insights ⏱️
Stay updated with current month and year data. -
Enhanced Parent Communication 🧑👩👦
Use reports to share progress with parents transparently. -
Historical Comparison 🔄
Year-on-Year comparisons highlight growth trends.
Opportunities for Improvement in Preschool KPI Dashboard
While powerful, the dashboard can always be improved further:
-
Automation of Data Input – Linking directly with attendance or learning systems.
-
Additional KPIs – Including teacher workload balance, student progress by subject, and extracurricular activities.
-
Mobile-Friendly Views – Optimizing dashboards for smartphone and tablet users.
-
Integration with Parent Portals – Sharing selected KPI insights directly with families.
-
Predictive Analytics – Using machine learning to forecast student outcomes and attendance.
Best Practices for Using Preschool KPI Dashboard in Power BI
To maximize the dashboard’s effectiveness, follow these best practices:
-
Define KPIs Clearly 📝
Ensure everyone understands each KPI’s purpose and calculation. -
Update Data Regularly 📅
Input actuals and targets every month without delay. -
Use Slicers Efficiently 🔍
Filter data by month and KPI group for faster insights. -
Leverage Drill-Through Pages 📂
Encourage staff to explore KPI definitions when in doubt. -
Review Trends, Not Just Snapshots 📈
Look at both MTD and YTD performance for a complete view. -
Communicate Findings 🗣️
Share results with teachers and parents to build trust and collaboration.
How to Implement the Preschool KPI Dashboard in Your School
-
Identify the KPIs – Choose relevant metrics like student attendance, teacher-to-student ratio, curriculum completion, etc.
-
Prepare Excel Data – Enter actual and target data accurately in the three sheets.
-
Load Data into Power BI – Connect Power BI to the Excel file.
-
Customize Dashboard – Adjust visuals, colors, and slicers as per your preschool’s requirements.
-
Train Staff – Ensure administrators and teachers know how to use the dashboard.
-
Monitor Regularly – Update the Excel sheets and refresh Power BI for real-time insights.
Conclusion
The Preschool KPI Dashboard in Power BI is more than just a reporting tool. It empowers preschools to track performance, improve accountability, and communicate results effectively. By combining Excel-based data entry with Power BI’s dynamic visuals, it offers a powerful yet user-friendly solution.
With the right practices, preschools can use this dashboard to enhance student outcomes, improve staff efficiency, and ensure long-term growth.
Frequently Asked Questions (FAQs)
1. What is a Preschool KPI Dashboard in Power BI?
It is a ready-to-use dashboard built in Power BI that tracks preschool performance using KPIs.
2. Can teachers use this dashboard easily?
Yes, since the backend is Excel-based, teachers and staff can easily enter data without needing advanced technical knowledge.
3. What kind of KPIs can be tracked?
KPIs such as student attendance, teacher feedback, curriculum progress, and parent satisfaction scores can be tracked.
4. Is the dashboard customizable?
Yes, schools can add or modify KPIs, adjust visuals, and tailor the design as per their needs.
5. How often should the data be updated?
It is best to update the data monthly to keep the dashboard accurate and relevant.
6. Can parents access the dashboard?
Direct access is optional, but schools can generate reports and share selected insights with parents.
7. What is the biggest advantage of using Power BI for preschools?
Power BI provides interactive visuals, real-time insights, and trend analysis that traditional spreadsheets cannot match.
Visit our YouTube channel to learn step-by-step video tutorials