A Private Equity Dashboard in Power BI helps private equity firms track performance, control risk, and drive smarter investment decisions. However, many firms still depend on scattered spreadsheets, static reports, and delayed updates. As a result, partners and analysts struggle to get a clear and timely picture of portfolio performance.
That is exactly why a Private Equity Dashboard in Power BI has become essential.
In this in-depth guide, you will learn what a Private Equity Dashboard in Power BI is, how it works, why it matters, its page-wise structure, advantages, best practices, and frequently asked questions. Moreover, this article explains how such a dashboard supports faster, data-driven decisions across funds, industries, regions, and investment stages.
Click to Purchases Private Equity Dashboard in Power BI
What Is a Private Equity Dashboard in Power BI?
A Private Equity Dashboard in Power BI is an interactive analytics solution designed to visualize and analyze private equity portfolio data in one centralized view. Instead of reviewing multiple Excel files or lengthy reports, decision-makers can instantly monitor valuation, invested capital, IRR, ownership, and exit status.
Moreover, the dashboard updates dynamically using slicers and filters. As a result, users can drill down by region, industry, fund, investment stage, or time period without manual effort.
Because it runs on Microsoft Power BI, the dashboard delivers high-performance visuals, secure data modeling, and real-time insights that scale with growing portfolios.
Why Do Private Equity Firms Need a Power BI Dashboard?
Private equity operations involve complex data across multiple dimensions. However, manual reporting slows analysis and increases risk. Therefore, firms need a smarter approach.
A Private Equity Dashboard in Power BI helps firms:
-
Track current valuation and invested amounts clearly
-
Monitor IRR trends by fund, region, or industry
-
Analyze ownership and exit status quickly
-
Identify underperforming assets early
-
Improve transparency for partners and investors
Because all KPIs appear on one platform, teams spend less time compiling data and more time analyzing it.
How Does a Private Equity Dashboard in Power BI Work?
A Private Equity Dashboard in Power BI connects structured data sources such as Excel, databases, or cloud systems. After that, Power BI transforms and models the data into meaningful measures and visuals.
Here is how the workflow typically looks:
-
Data Collection – Investment, valuation, and performance data captured in structured tables
-
Data Modeling – Relationships built between funds, industries, regions, and dates
-
KPI Calculation – Measures such as IRR %, ownership %, and valuation created
-
Visualization – Interactive charts, cards, and slicers added
-
User Interaction – Filters allow instant drill-downs and comparisons
Because of this flow, users always see consistent and reliable insights.
What Are the Key Pages in a Private Equity Dashboard in Power BI?
This Private Equity Dashboard in Power BI contains five powerful analytical pages. Each page focuses on a different decision angle. Let us explore them one by one.
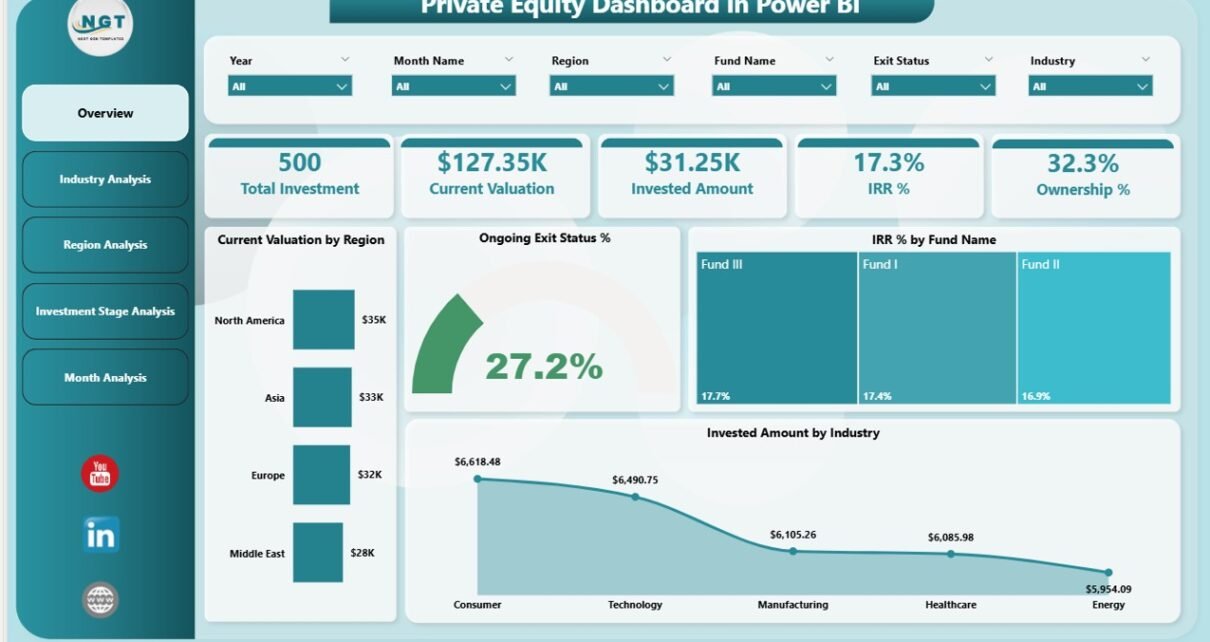
1. What Does the Overview Page Show?
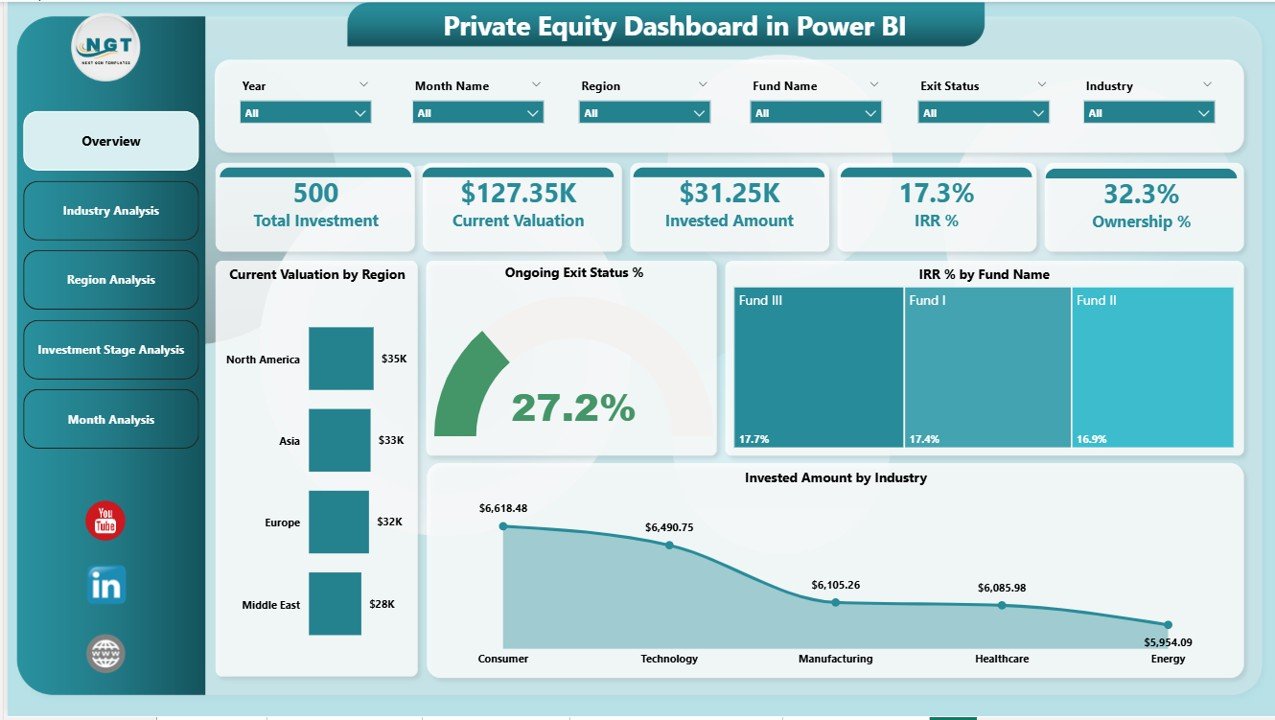
The Overview Page acts as the command center of the dashboard. From here, partners and analysts can understand the overall portfolio health at a glance.
Key Features of the Overview Page
-
Interactive slicers to filter by region, industry, fund, or period
-
Five KPI cards for instant insights
-
High-level portfolio visuals for quick comparisons
Key Visuals on the Overview Page
-
Current Valuation by Region – Shows where portfolio value concentrates geographically
-
Ongoing Exit Status % – Highlights progress of exits across investments
-
IRR % by Fund Name – Compares performance across funds
-
Invested Amount by Industry – Reveals sector allocation
-
Summary KPI Cards – Display critical metrics at a glance
As a result, leadership teams can quickly identify opportunities and risks without digging into raw data.
2. How Does the Industry Analysis Page Help?
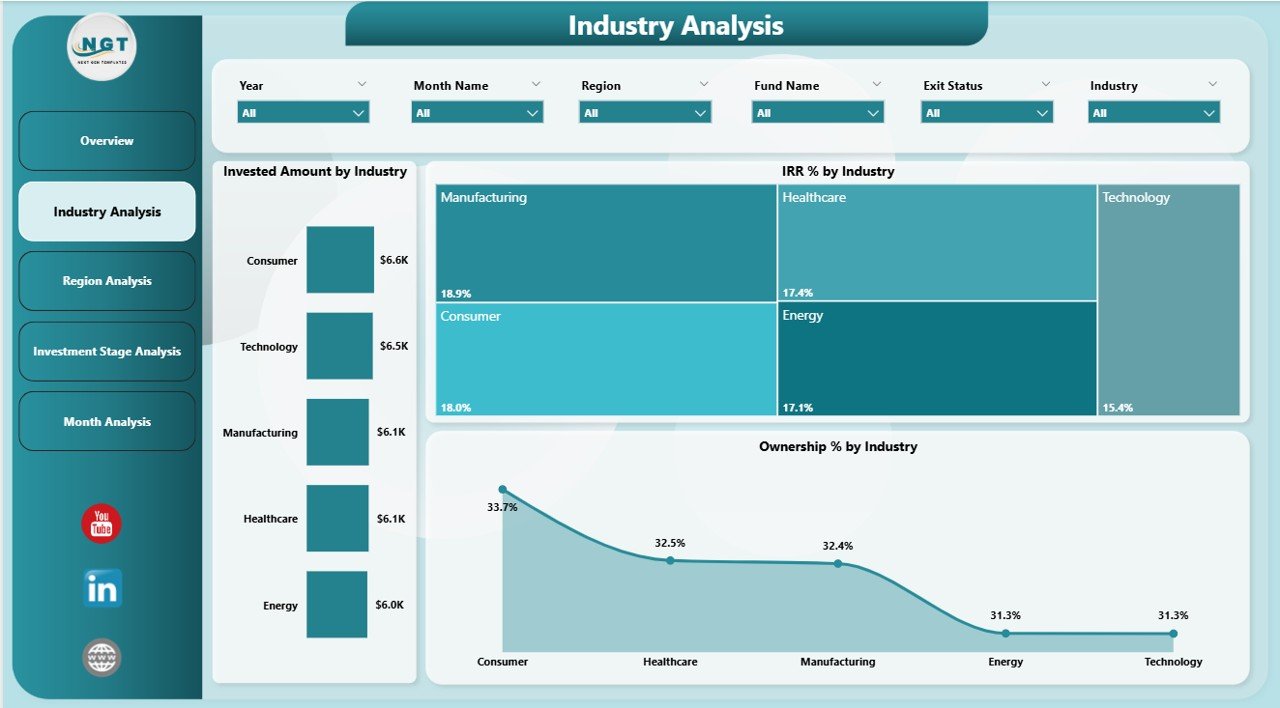
The Industry Analysis Page focuses on sector-wise investment performance. Because industry trends often drive returns, this page plays a critical role in strategy reviews.
Key Visuals on the Industry Analysis Page
-
Invested Amount by Industry – Shows capital allocation across sectors
-
IRR % by Industry – Highlights which industries deliver higher returns
-
Ownership % by Industry – Displays exposure and control level
With slicers applied, users can compare industries across regions or time periods. Consequently, firms can rebalance portfolios based on performance trends.
3. Why Is the Region Analysis Page Important?
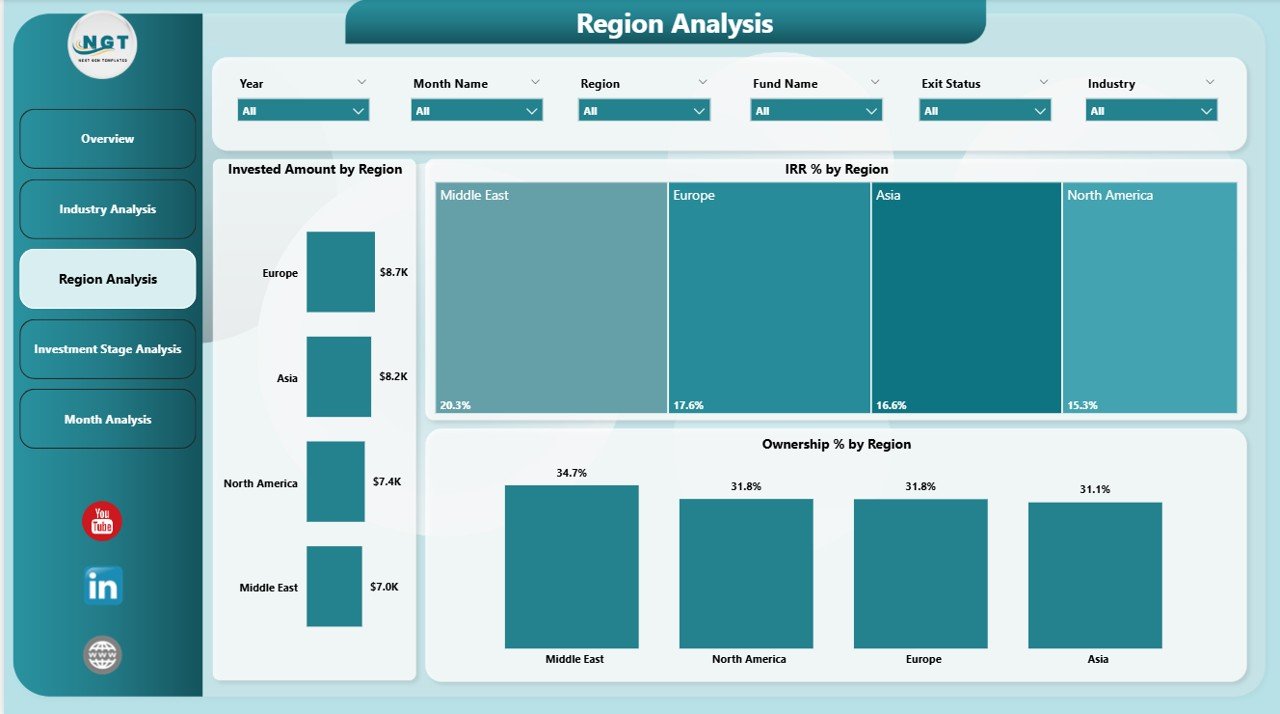
The Region Analysis Page provides geographic insights. Since economic conditions vary by region, this analysis helps firms manage location-based risks and opportunities.
Key Visuals on the Region Analysis Page
-
Invested Amount by Region – Shows capital distribution
-
IRR % by Region – Compares regional performance
-
Ownership % by Region – Highlights regional exposure
Because this page updates dynamically, decision-makers can instantly evaluate which regions drive growth and which require corrective actions.
Click to Purchases Private Equity Dashboard in Power BI
4. What Insights Does the Investment Stage Analysis Provide?
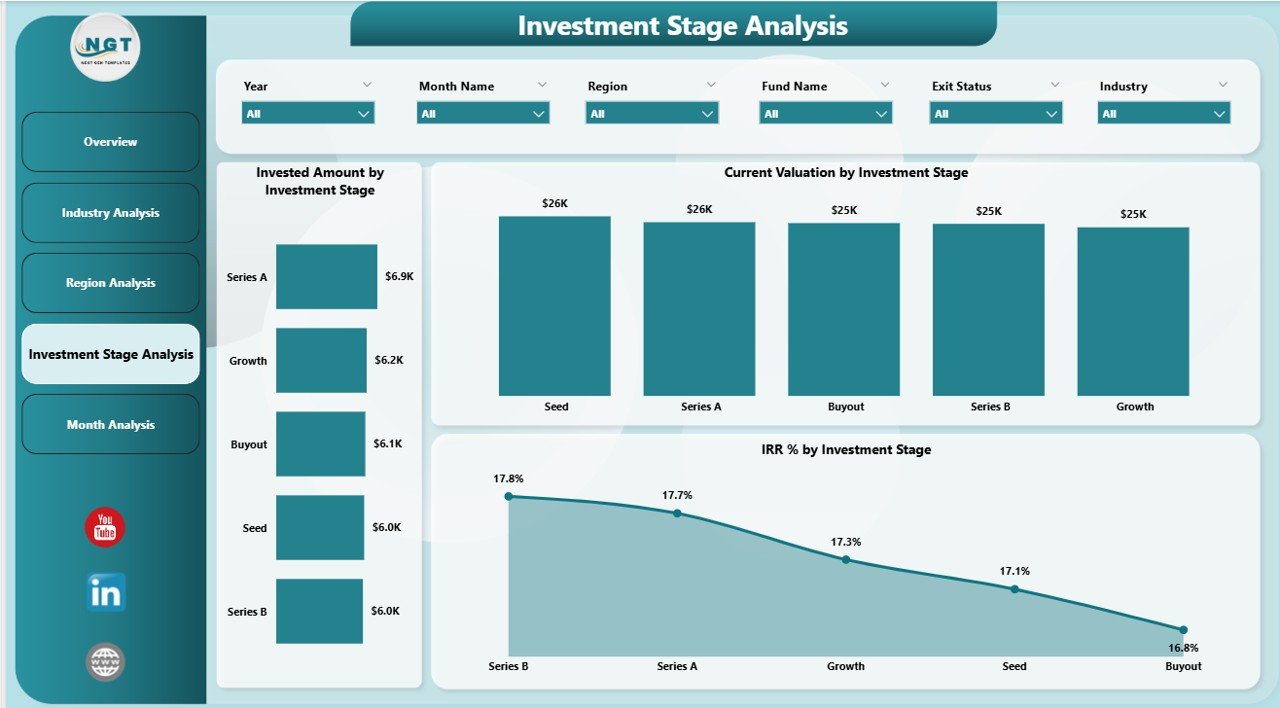
The Investment Stage Analysis Page focuses on performance across stages such as early-stage, growth, and mature investments.
Key Visuals on the Investment Stage Analysis Page
-
Invested Amount by Investment Stage – Shows capital allocation by stage
-
IRR % by Investment Stage – Evaluates returns by maturity level
-
Current Valuation by Investment Stage – Highlights value concentration
As a result, firms can adjust strategies between riskier early-stage investments and stable late-stage assets.
5. How Does the Month Analysis Page Improve Trend Tracking?

The Month Analysis Page provides a time-based view of investment activity. Because trends matter in private equity, this page supports performance tracking over time.
Key Visuals on the Month Analysis Page
-
Invested Amount by Month – Tracks capital deployment trends
-
Total Investment by Month – Shows overall activity volume
-
Current Valuation by Month – Displays valuation growth patterns
This page helps firms identify seasonal trends, investment cycles, and growth momentum.
Advantages of a Private Equity Dashboard in Power BI
A Private Equity Dashboard in Power BI delivers measurable business value. Here are the key advantages:
-
Centralized Portfolio View – All KPIs available in one place
-
Real-Time Insights – Data refreshes instantly with slicers
-
Better Decision-Making – Faster access to accurate information
-
Improved Transparency – Clear reporting for partners and stakeholders
-
Scalable Analytics – Supports growing funds and portfolios
-
Reduced Manual Work – Eliminates repetitive reporting tasks
Because of these advantages, firms gain both speed and accuracy in portfolio management.
Best Practices for the Private Equity Dashboard in Power BI
Click to Purchases Private Equity Dashboard in Power BI
To get the most value, firms should follow proven best practices while designing and using a Private Equity Dashboard in Power BI.
1. Define Clear KPIs First
Always identify critical KPIs such as IRR, valuation, ownership, and exit status before building visuals.
2. Use Consistent Data Models
Maintain standardized tables and relationships. As a result, metrics remain accurate across pages.
3. Leverage Slicers Wisely
Use slicers for region, industry, fund, and time. However, avoid clutter to keep navigation simple.
4. Focus on Actionable Insights
Design visuals that highlight trends, gaps, and exceptions. Therefore, users can act faster.
5. Optimize Performance
Reduce unnecessary columns and measures. Consequently, dashboards load faster and scale better.
6. Review and Improve Regularly
Update KPIs and visuals as strategies evolve. Because private equity markets change, dashboards must adapt.
Who Should Use a Private Equity Dashboard in Power BI?
A Private Equity Dashboard in Power BI supports multiple roles:
-
General Partners – For strategic oversight
-
Investment Managers – For portfolio performance tracking
-
Analysts – For deep-dive analysis
-
Finance Teams – For valuation and reporting
-
Investor Relations Teams – For clear and transparent communication
Because everyone works from the same data, alignment improves across the organization.
How Does This Dashboard Improve Investor Reporting?
Investor reporting often requires clarity, speed, and accuracy. A Private Equity Dashboard in Power BI simplifies this process.
-
Investors see clear performance metrics
-
Reports stay consistent and professional
-
Teams respond faster to investor queries
-
Transparency builds long-term trust
As a result, firms strengthen investor confidence.
Conclusion: Why a Private Equity Dashboard in Power BI Is a Smart Investment
A Private Equity Dashboard in Power BI transforms how firms analyze and manage investments. Instead of struggling with manual reports, teams gain real-time visibility into valuation, IRR, ownership, and trends.
Because the dashboard covers overview, industry, region, investment stage, and monthly analysis, it supports decisions at every level. Moreover, when firms follow best practices, they unlock maximum value from their data.
In today’s competitive private equity landscape, using a Private Equity Dashboard in Power BI no longer feels optional. Instead, it becomes a strategic advantage.
Frequently Asked Questions (FAQs)
What is a Private Equity Dashboard in Power BI used for?
A Private Equity Dashboard in Power BI helps firms monitor portfolio performance, valuation, IRR, and trends using interactive visuals.
Can this dashboard handle multiple funds?
Yes. With proper data modeling, the dashboard supports multiple funds, regions, and industries.
Does the dashboard require real-time data?
The dashboard works with scheduled or real-time data refreshes, depending on data sources.
Can users export reports from Power BI?
Yes. Users can export visuals or reports to PDF or PowerPoint for presentations.
Is Power BI secure for private equity data?
Yes. Power BI offers role-based security and access control to protect sensitive data.
Who benefits the most from this dashboard?
General partners, investment managers, analysts, and investor relations teams benefit the most.
Visit our YouTube channel to learn step-by-step video tutorials