Effective procurement management is a critical component of organizational efficiency and cost control. The Procurement Analysis Report in Excel is a ready-to-use, comprehensive tool designed to help procurement professionals, finance teams, and managers monitor purchasing activities, track supplier performance, and analyze cost trends.
With this report, all procurement data is centralized, visualized, and ready for analysis, enabling actionable insights and informed decision-making.
Key Features of the Procurement Analysis Report
This Excel-based report comes with three prebuilt sheet tabs, each serving a unique purpose for procurement tracking and analysis.
1. Summary Sheet Tab
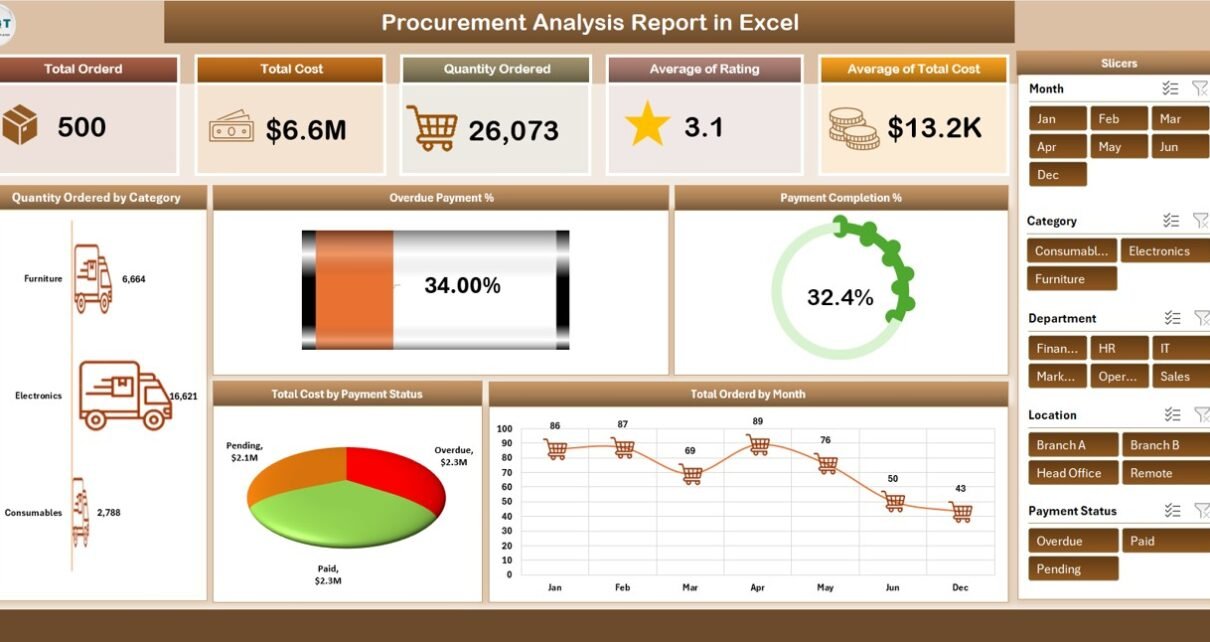
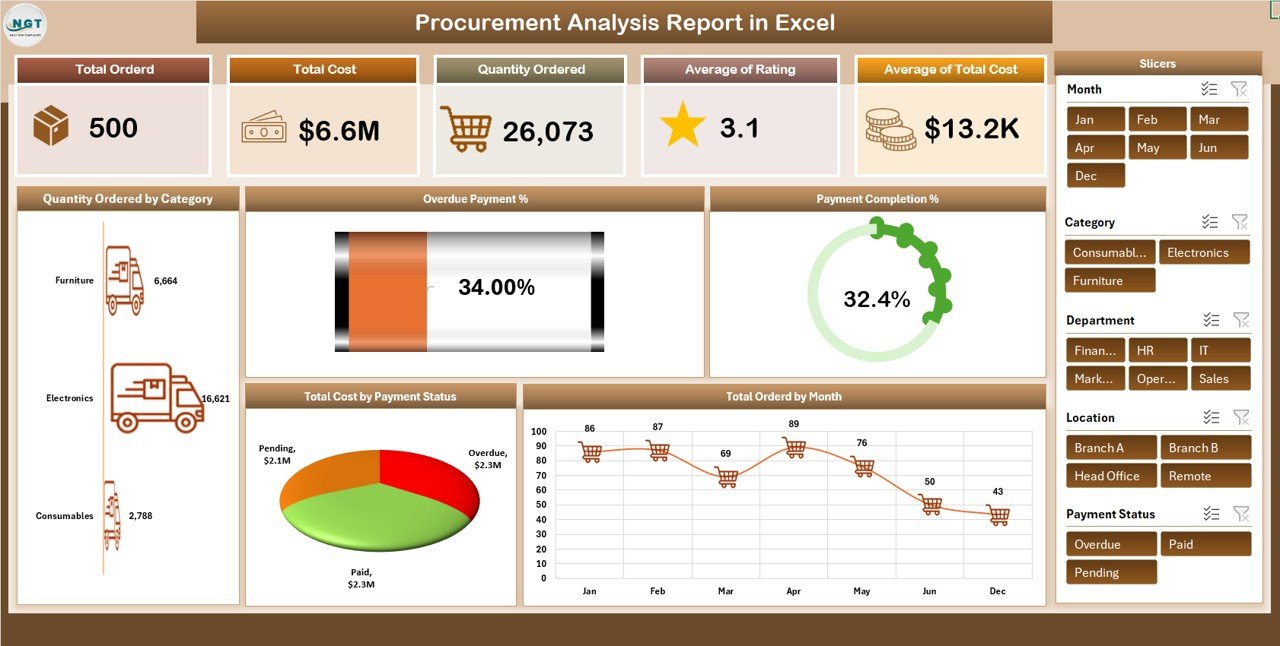
The Summary sheet is the main dashboard where key metrics and visual insights are displayed.
Cards include:
-
Total Orders: The total number of purchase orders placed.
-
Total Cost: Sum of all procurement costs for the selected period.
-
Quantity Ordered: Total units or items ordered across all categories.
-
Average Rating: Average supplier or product rating.
-
Average Total Cost: Average cost per order or unit.
Charts include:
-
Payment Completion %: Track how many orders have been fully paid.
-
Quantity Ordered by Category: Identify which categories have higher procurement volumes.
-
Overdue Payment %: Monitor delayed payments for better financial control.
-
Total Orders by Month: Visualize order trends month-over-month.
-
Total Cost by Payment Status: Analyze financial commitments based on payment status.
The Summary sheet provides a snapshot of procurement performance, enabling quick decision-making for managers and procurement teams.
Click to Buy Procurement Analysis Report in Excel
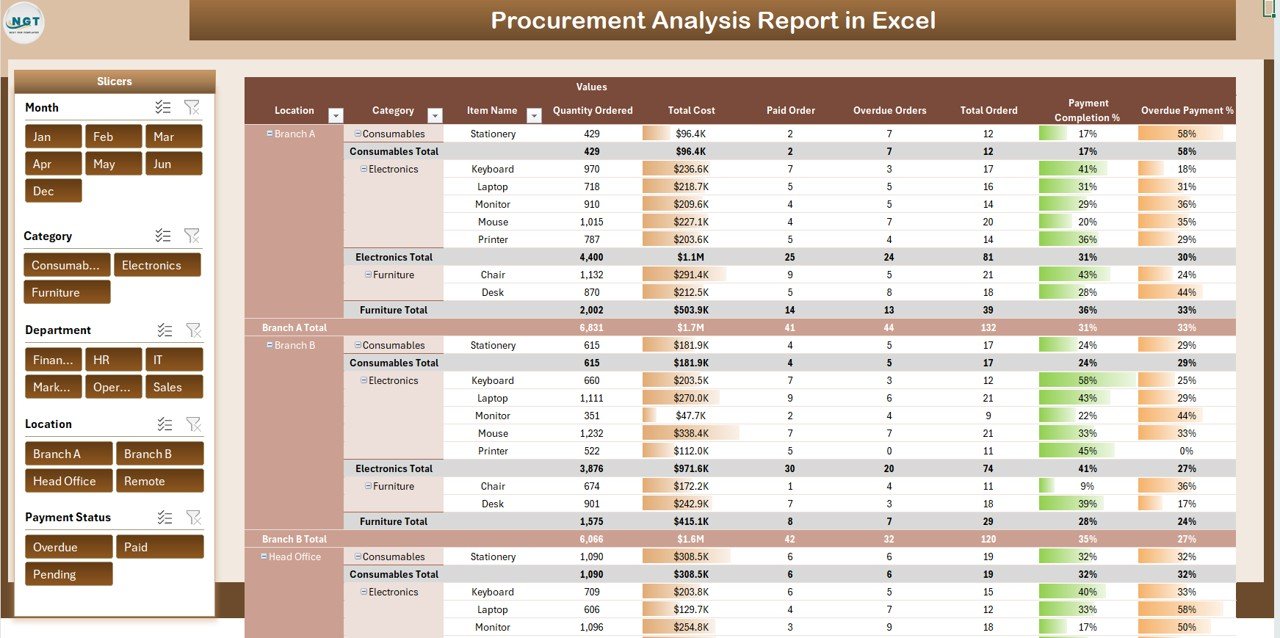
2. Report Sheet Tab
The Report sheet serves as a power pivot view of the procurement data.
Features include:
-
Dynamic Filtering: Slice and dice procurement data by supplier, category, location, or month.
-
Pivot Tables & Charts: Generate insights such as total cost by supplier, order frequency by category, and payment trends.
-
Performance Comparison: Compare supplier performance and track overdue payments to improve vendor management.
This sheet allows deeper analysis and is ideal for detailed presentations or internal reporting.
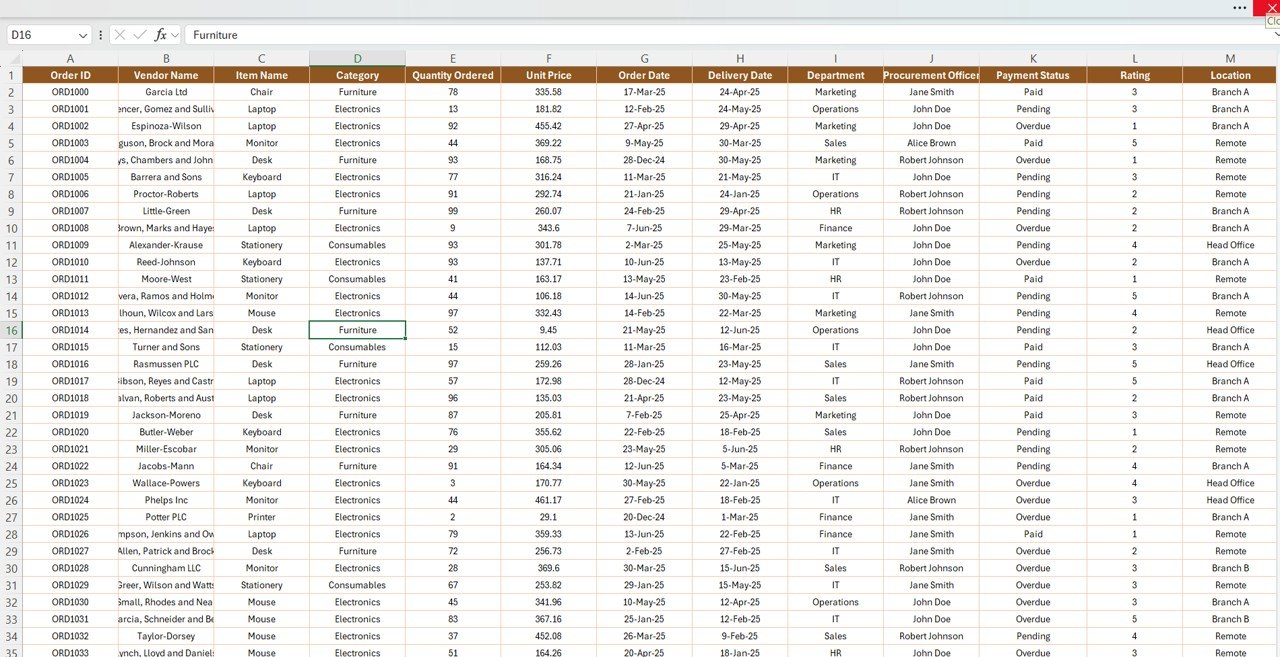
3. Data Sheet Tab
The Data sheet acts as the input repository for all procurement information.
Key fields may include:
-
Order ID: Unique identifier for each purchase order.
-
Supplier Name: Vendor supplying the goods or services.
-
Category: Type of product or service ordered.
-
Order Date & Delivery Date: Track procurement timelines.
-
Quantity Ordered: Number of units purchased.
-
Unit Cost / Total Cost: Financial values for each order.
-
Payment Status: Paid, Pending, Overdue.
-
Rating: Supplier or product quality rating.
-
Remarks: Any additional notes or comments.
The Data sheet serves as the backbone of the report. All dashboards and charts in the Summary and Report tabs are linked to this data, ensuring updates automatically reflect in the visual reports.
Click to Buy Procurement Analysis Report in Excel
Advantages of Using This Procurement Analysis Report
-
Consolidates all procurement data in a single Excel file
-
Provides instant visual insights with cards and charts
-
Tracks payments, overdue amounts, and supplier performance
-
Supports MTD, YTD, and category-wise analysis
-
Enables quick decision-making and cost optimization
Opportunities for Improvement
Click to Buy Procurement Analysis Report in Excel
-
Integration with ERP or accounting software for automatic updates
-
Add supplier scorecards to track performance over time
-
Include predictive analysis for procurement costs and trends
-
Introduce KPI tracking for compliance and contract adherence
Best Practices
-
Regularly update procurement data to maintain accuracy
-
Use filters in the Report tab to analyze data by department or supplier
-
Review trends monthly to optimize procurement strategies
-
Combine with budget tracking for better financial control
Conclusion
Click to Buy Procurement Analysis Report in Excel
The Procurement Analysis Report in Excel is an essential tool for organizations seeking a clear and structured approach to procurement management. By consolidating data, providing visual insights, and enabling detailed pivot analysis, this report empowers procurement teams and managers to make informed decisions, control costs, and enhance supplier relationships efficiently.
Visit our YouTube channel to learn step-by-step video tutorials
Watch the step-by-step video Demo:
Click to Buy Procurement Analysis Report in Excel