Procurement Management Dashboard in Excel is a professionally designed, ready-to-use Excel dashboard template built for procurement managers, supply chain professionals, and operations teams who need to monitor procurement spending, supplier performance, delivery timelines, and budget compliance from a single interactive workbook. This fully dynamic template includes 5 interactive dashboard pages, a structured data sheet, and a support sheet with pivot tables — giving you complete procurement visibility within Microsoft Excel 📊🛒.
Without centralized procurement analytics, organizations face budget overruns, supplier quality gaps, and missed delivery deadlines. The Procurement Management Dashboard in Excel solves these challenges by consolidating all your procurement data into one auto-refreshing dashboard with KPI cards, dynamic charts, and slicer-based filtering. This template includes 5 interactive pages and tracks 5 key performance indicators including Total Spend, Total Budget, Total Orders, Total Quantity, and Avg. Lead Time.
📌 Click here to Purchase Procurement Management Dashboard in Excel
Key Features of Procurement Management Dashboard in Excel
This Excel dashboard template delivers comprehensive procurement analytics across 5 interactive pages with 16+ dynamic charts and slicers. The Overview page displays 5 KPI cards — Total Spend, Total Budget, Total Orders, Total Quantity, and Avg. Lead Time — alongside 4 analytical charts covering monthly spend vs budget trends, category-wise spend breakdowns, order status distribution, and regional budget comparisons. Built-in slicers on every page enable instant filtering, allowing managers to drill down into specific suppliers, categories, regions, or time periods within seconds.
The template uses pivot-powered dynamic charts that auto-refresh when you update the data sheet. No VBA or macros are required — everything runs on standard Excel formulas and pivot tables. The Spend Trend page tracks spending patterns over time with year-over-year comparisons and budget compliance percentages. The Supplier Analysis page evaluates vendor performance through budget variance, on-time delivery rates, lead times, and quality scores. The Category Insights page breaks down procurement metrics by product category and department. The Delivery Performance page monitors lead times by buyer and spending patterns by payment terms.
The dashboard works in Microsoft Excel 2016 and later versions. It is fully unlocked and customizable — you can modify charts, add new KPIs, change color themes, and adjust slicer options to match your organization’s requirements. For complementary supply chain analytics, explore the Supply Chain Dashboard in Excel and the Vendor Performance Dashboard in HTML. Browse all available Excel Dashboard Templates on NextGenTemplates.
Dashboard Pages Explained
1. Overview Page
The Overview page serves as the executive command center of the entire procurement operation. At the top, five powerful KPI cards display real-time metrics: Total Spend, Total Budget, Total Orders, Total Quantity, and Avg. Lead Time. These give managers a quick snapshot of procurement health without drilling into details.
Below the KPI cards, four dynamic charts provide deeper analysis: Total Spend Vs Total Budget by Month helps identify months where procurement spending exceeded or remained within budget allocations. Total Spend by Category reveals which product or service categories consume the largest share of procurement budget. Total Orders by Status shows the distribution of orders across different fulfillment stages such as pending, completed, and cancelled. Total Spend Vs Budget by Region compares spending and budget performance across geographic regions. Multiple slicers allow instant filtering to see specific subsets of data quickly.
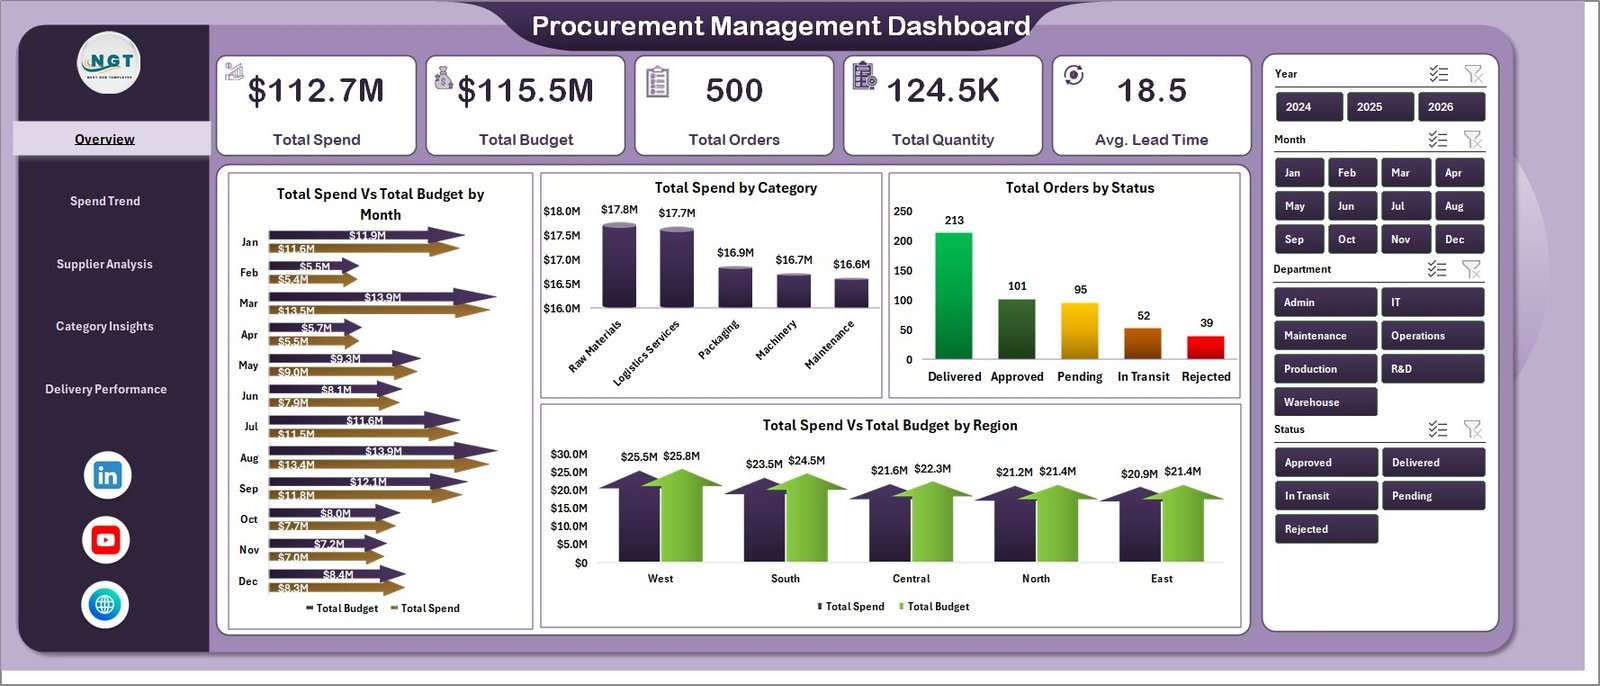
Procurement Management Dashboard in Excel
2. Spend Trend Page
The Spend Trend page dives deep into procurement spending patterns over time. Four specialized charts provide actionable insights: Total Spend Vs Total Quantity by Year tracks how spending and order volumes correlate across fiscal years, helping identify cost inflation or efficiency improvements. Avg. Cost Per Order by Month reveals monthly trends in per-order procurement costs, enabling teams to spot cost creep early. Total Spend Vs Total Quantity by Supplier compares spending levels against order volumes for each vendor, highlighting suppliers where costs may be disproportionately high. Within Budget % by Month displays the percentage of procurement activity that stayed within approved budget limits each month — a critical compliance metric for finance teams.
This page is especially valuable for procurement directors who present quarterly spending reports to leadership and need clear trend data to support budget requests and cost-reduction initiatives.

Spend Trend Page
3. Supplier Analysis Page
The Supplier Analysis page evaluates vendor performance across multiple dimensions. Budget Variance by Supplier identifies which suppliers consistently come in over or under budget, supporting more accurate future budget planning. On-Time Delivery % by Supplier tracks delivery reliability for each vendor — a crucial metric for production-dependent organizations. Total Spend Vs Total Budget by Category provides a category-level view of budget adherence across different procurement categories. Avg. Lead Time Vs Avg. Quality Score by Supplier plots delivery speed against quality ratings, helping procurement teams identify the best-value suppliers and those requiring corrective action.
This page is essential for strategic sourcing decisions, supplier scorecards, vendor negotiations, and annual supplier review meetings. For more advanced vendor analytics, consider the Vendor Performance Dashboard in HTML.
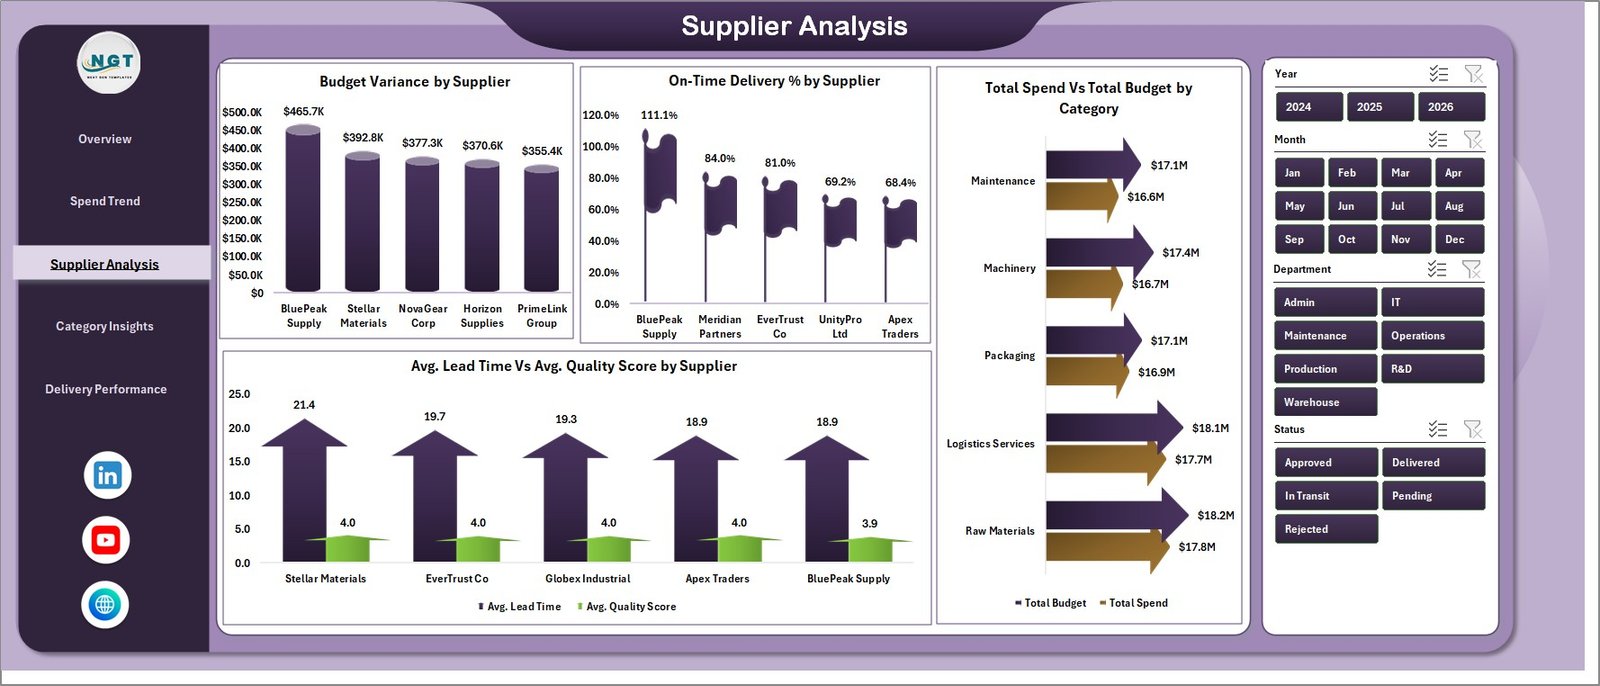
Supplier Analysis Page
4. Category Insights Page
The Category Insights page breaks down procurement performance by product category, region, and department. Total Quantity by Category shows which categories generate the highest order volumes. Avg. Cost Per Order by Category identifies categories with the highest per-order procurement costs, flagging areas for potential cost optimization. On-Time Delivery % by Region reveals geographic patterns in delivery performance, helping supply chain teams address regional logistics challenges. Total Spend by Department distributes procurement spending across organizational departments, supporting internal budget allocation and chargeback analysis.
Procurement analysts and finance controllers use this page to identify high-spend categories, optimize purchasing strategies, and allocate budgets more effectively across departments.
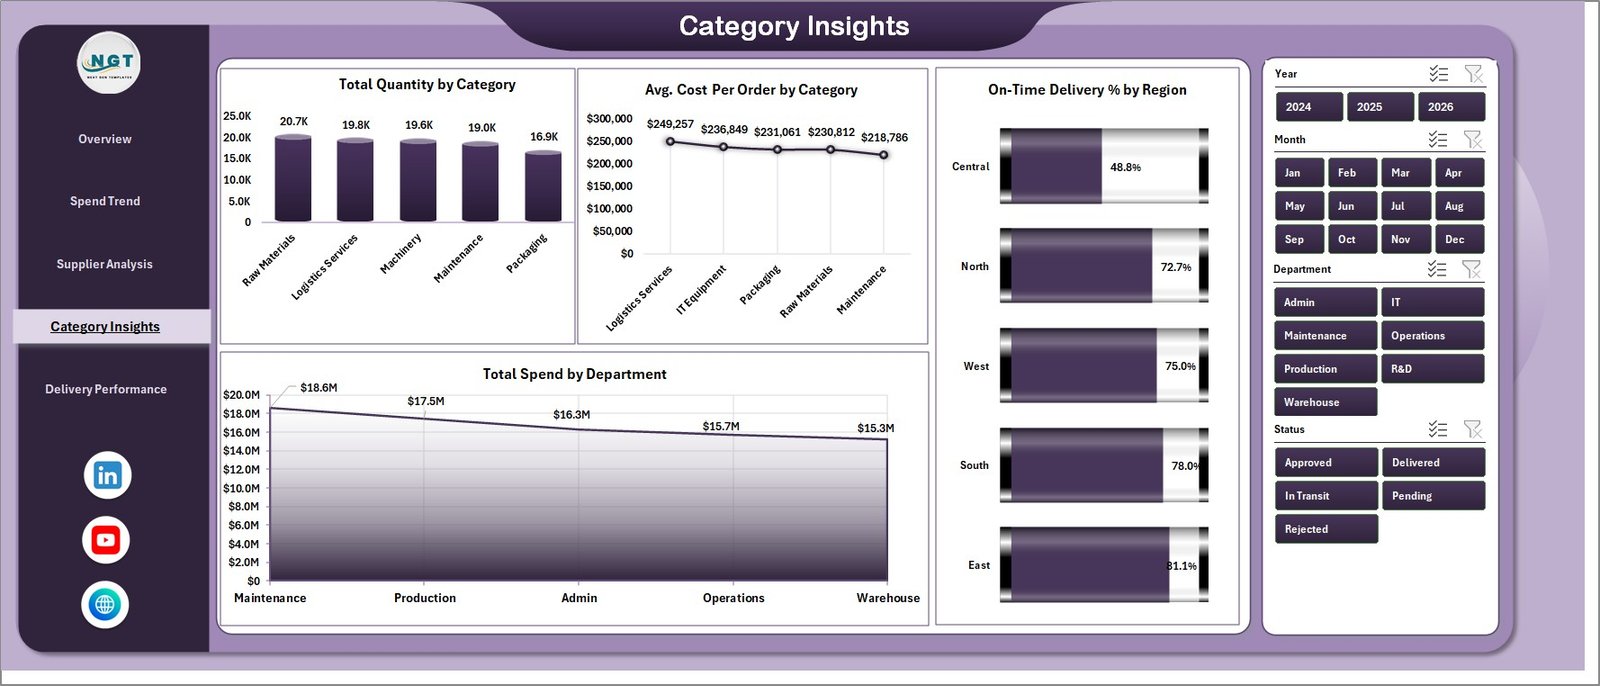
Category Insights Page
5. Delivery Performance Page
The Delivery Performance page focuses on procurement delivery efficiency and payment analysis. Avg. Lead Time by Buyer tracks which buyers experience the longest procurement lead times, helping identify process bottlenecks or supplier issues at the buyer level. Total Spend Vs Total Orders by Status compares spending against order count across different fulfillment statuses, revealing whether high-spend orders are completing on time or stalling. Total Spend by Payment Terms breaks down procurement spending by payment arrangement, supporting cash flow planning and vendor payment strategy optimization.
Operations managers and procurement officers use this page daily to monitor delivery pipelines, identify delayed orders, and optimize payment terms for better cash management. For complementary logistics tracking, explore the Trucking and Logistics Dashboard in Excel.

Delivery Performance Page
6. Data Sheet
The Data Sheet is where you enter your procurement transaction records. Simply add your data in the same format as the sample dataset provided — maintaining the same column structure — and the entire dashboard will auto-update when you refresh the pivot tables. Fields include order details, supplier information, category, region, department, budget amounts, actual spend, quantity, lead time, quality score, delivery status, payment terms, and buyer name. A pre-loaded sample dataset with 500 records is included so you can see the dashboard in action immediately.
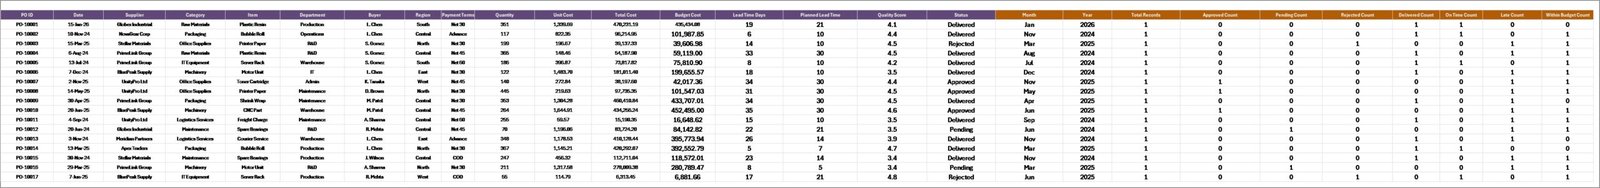
Data Sheet Tab
7. Support Sheet
The Support Sheet contains all the pivot tables that power the dashboard’s charts and KPI cards dynamically. After updating your data in the Data Sheet, go to the Data tab in the Excel Ribbon and click Refresh All — all pivots will recalculate and all charts will update automatically. You can keep this sheet hidden during everyday use to maintain a clean and professional workbook appearance when sharing with stakeholders.
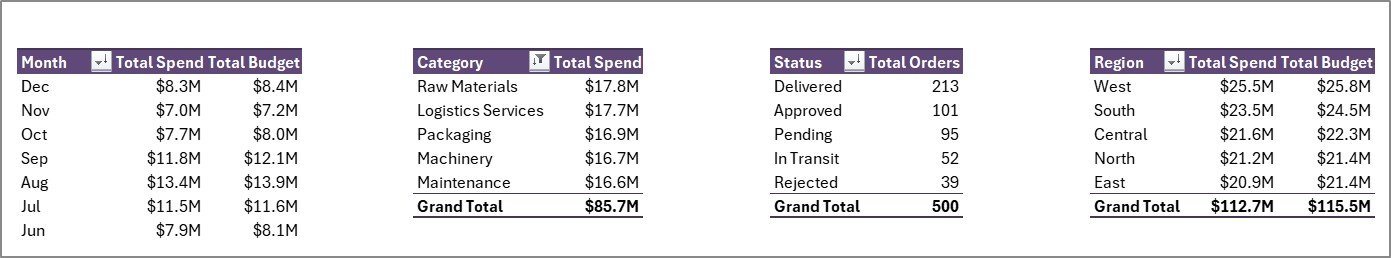
Support Sheet Tab
Advantages of Procurement Management Dashboard in Excel
This dashboard eliminates manual procurement reporting by automating all calculations through pivot tables. Procurement managers save hours of work every week because charts and KPIs update with a single click. The spend vs budget analysis on the Overview page and Spend Trend page provides instant visibility into budget compliance, helping finance teams catch overruns before they escalate.
The Supplier Analysis page enables data-driven vendor evaluations by combining delivery performance, budget variance, lead time, and quality metrics into a single view — replacing subjective vendor assessments with objective scorecards. The Category Insights page supports strategic procurement planning by revealing which categories and departments consume the most budget. The slicer-based filtering across all pages means any user can create custom views instantly without modifying the underlying data or structure.
Because the dashboard works entirely in Microsoft Excel, no additional software licenses, cloud subscriptions, or technical expertise are required — making it accessible to any procurement professional regardless of technical background.
Opportunities for Improvement
While this dashboard provides comprehensive procurement analytics for most organizations, very large enterprises with datasets spanning multiple years and thousands of suppliers might benefit from upgrading to a Power BI Dashboard for enhanced scalability and real-time data connectivity. Organizations that need contract lifecycle management alongside procurement spend tracking might consider supplementing this dashboard with the Contract Expiry and Compliance Dashboard in Google Sheets for cloud-based contract monitoring.
Best Practices for Using the Procurement Management Dashboard
Update your data weekly or monthly to keep the dashboard current and actionable. Use the slicers on each page to create focused views for management meetings — for example, filter by a single supplier or region to present targeted insights during vendor review sessions. Always click Refresh All in the Data tab after updating data to ensure all pivot tables and charts recalculate properly. Consider hiding the Support Sheet to keep the workbook clean when sharing with executives or stakeholders.
For the best experience, use Microsoft Excel 2016 or later. Avoid deleting or rearranging columns in the Data Sheet, as this will break the pivot table references. If you need to add new data fields, add them as new columns at the end of the existing structure. Back up the original template before making structural modifications.
Explore Relevant Templates
🔹 Vendor Performance Dashboard in HTML — Interactive HTML dashboard for monitoring vendor delivery, quality, and cost performance with 5 analytical pages and dynamic filters.
🔹 Trucking and Logistics Dashboard in Excel — Track fleet operations, delivery timelines, route efficiency, and transportation costs in Excel.
🔹 Supply Chain Dashboard in Excel — End-to-end supply chain visibility with supplier performance, logistics tracking, and inventory analytics.
🔹 Inventory Management Dashboard in HTML — Interactive HTML inventory dashboard with stock analysis, reorder tracking, and warehouse metrics.
🔹 Food Supply Chain KPI Scorecard in Excel — Specialized KPI scorecard for food supply chain tracking with MTD/YTD analysis.
Frequently Asked Questions
What is the best Excel template for tracking procurement management?
The Procurement Management Dashboard in Excel from NextGenTemplates is specifically designed for procurement tracking. It includes 5 interactive dashboard pages that monitor Total Spend, Total Budget, Total Orders, Total Quantity, and Avg. Lead Time across suppliers, categories, regions, and departments with dynamic charts and slicer-based filtering.
How do I track procurement spend vs budget in Excel?
This dashboard includes dedicated charts for Total Spend Vs Total Budget by Month and Total Spend Vs Budget by Region on the Overview page, plus Within Budget % by Month on the Spend Trend page. Simply enter your procurement data in the Data Sheet, click Refresh All, and see instant budget compliance analysis across all dimensions.
Do I need VBA or macros to use this procurement dashboard?
No. The Procurement Management Dashboard in Excel is 100% formula and pivot-table based. No VBA or macros are needed. It works in Microsoft Excel 2016 and later versions without enabling macros, making it safe and accessible for any user.
How does this dashboard help evaluate supplier performance in Excel?
The Supplier Analysis page tracks Budget Variance by Supplier, On-Time Delivery % by Supplier, and Avg. Lead Time Vs Avg. Quality Score by Supplier. These metrics provide a comprehensive vendor scorecard that helps procurement teams make data-driven decisions about supplier selection, contract renewals, and negotiation strategies.
Can I customize this procurement dashboard for my specific business needs?
Yes. The dashboard is fully unlocked and editable in Microsoft Excel. You can modify charts, add new KPIs, change color themes, adjust slicer options, add new data columns, and connect it to your own data structure. All pivot tables and formulas are accessible for complete customization.
What data fields are required for the Procurement Management Dashboard?
The Data Sheet requires procurement transaction records with fields including order details, supplier information, category, region, department, budget amounts, actual spend, quantity, lead time, quality score, delivery status, payment terms, and buyer name. A sample dataset with 500 records is pre-loaded so you can see the exact format required.
Conclusion
The Procurement Management Dashboard in Excel transforms complex procurement data into clear, actionable, and visually engaging insights. With 5 interactive pages covering spend analysis, supplier evaluation, category breakdowns, and delivery performance, this template empowers procurement professionals to make data-driven decisions that optimize spending, improve supplier relationships, and ensure budget compliance.
Whether you manage procurement for a small business or a large enterprise, this dashboard provides the clarity and speed you need to stay on top of every purchase order, supplier contract, and budget allocation. Stop relying on scattered spreadsheets and start making smarter procurement decisions today.
👉 Click here to Purchase the Procurement Management Dashboard in Excel
🎥 Visit our YouTube channel to learn step-by-step video tutorials
👉 Youtube.com/@PK-AnExcelExpert