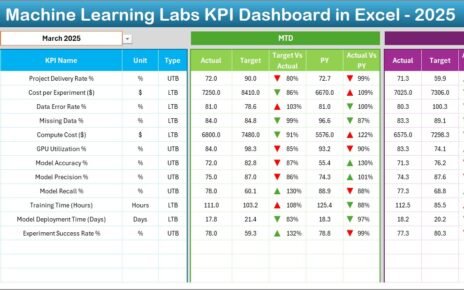
In today’s fast-paced and competitive environment, product development managers must track progress accurately and act quickly on insights. But how do you stay on top of evolving targets, KPIs, and development milestones without getting lost in endless spreadsheets? The answer is simple – a Project Management Product Development KPI Dashboard in Excel.
This ready-to-use Excel dashboard helps teams monitor key performance indicators (KPIs) in one place, offering a snapshot of performance with real-time updates. In this comprehensive guide, we’ll explore how this dashboard works, its key advantages, best practices, and more!
Click to Purchases Project Management Product Development KPI Dashboard in Excel
What Is a Product Development KPI Dashboard?
A Product Development KPI Dashboard is a visual tool that tracks all critical metrics involved in the development lifecycle. These KPIs may include time-to-market, defect rate, development cost, and more. The dashboard presents this data in charts, progress bars, and summary cards to help stakeholders monitor progress and make informed decisions quickly.
Key Features of the Excel Template
This dashboard comes with 7 smartly organized worksheets designed to capture, process, and display performance data efficiently:
Home Sheet

- Works as an index page
- Includes six navigation buttons that let you jump directly to any other worksheet
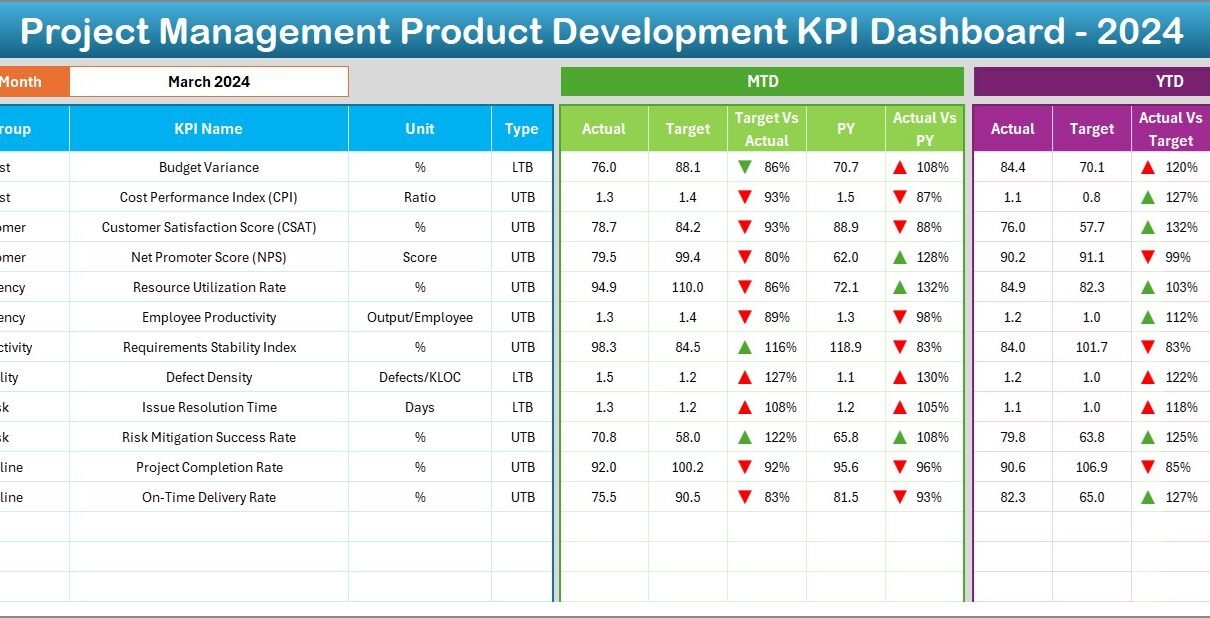
Dashboard Sheet
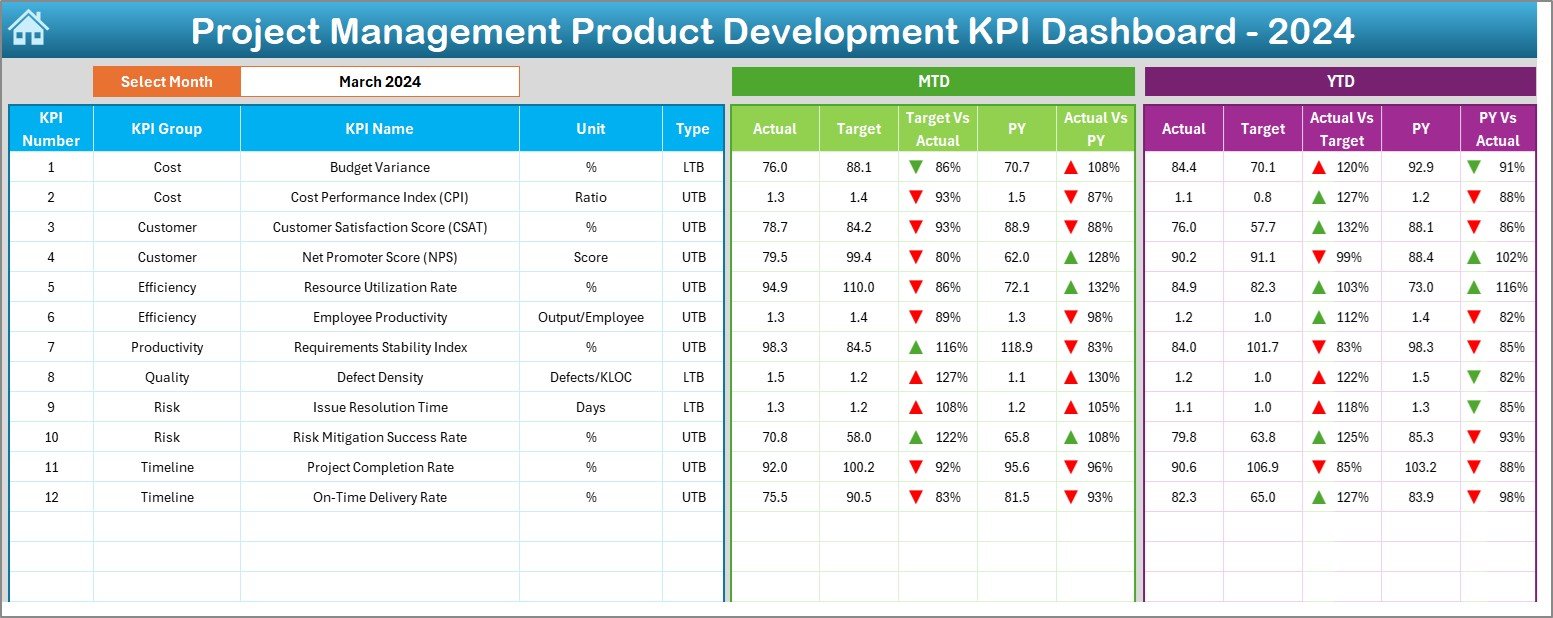
- Main visual summary of KPIs
- Month selection drop-down in cell D3
- Shows MTD (Month-to-Date) and YTD (Year-to-Date) values
- Compares Actual vs Target and Previous Year (PY) figures
- Up/down arrows using conditional formatting indicate performance trends
Click to Purchases Project Management Product Development KPI Dashboard in Excel
KPI Trend Sheet
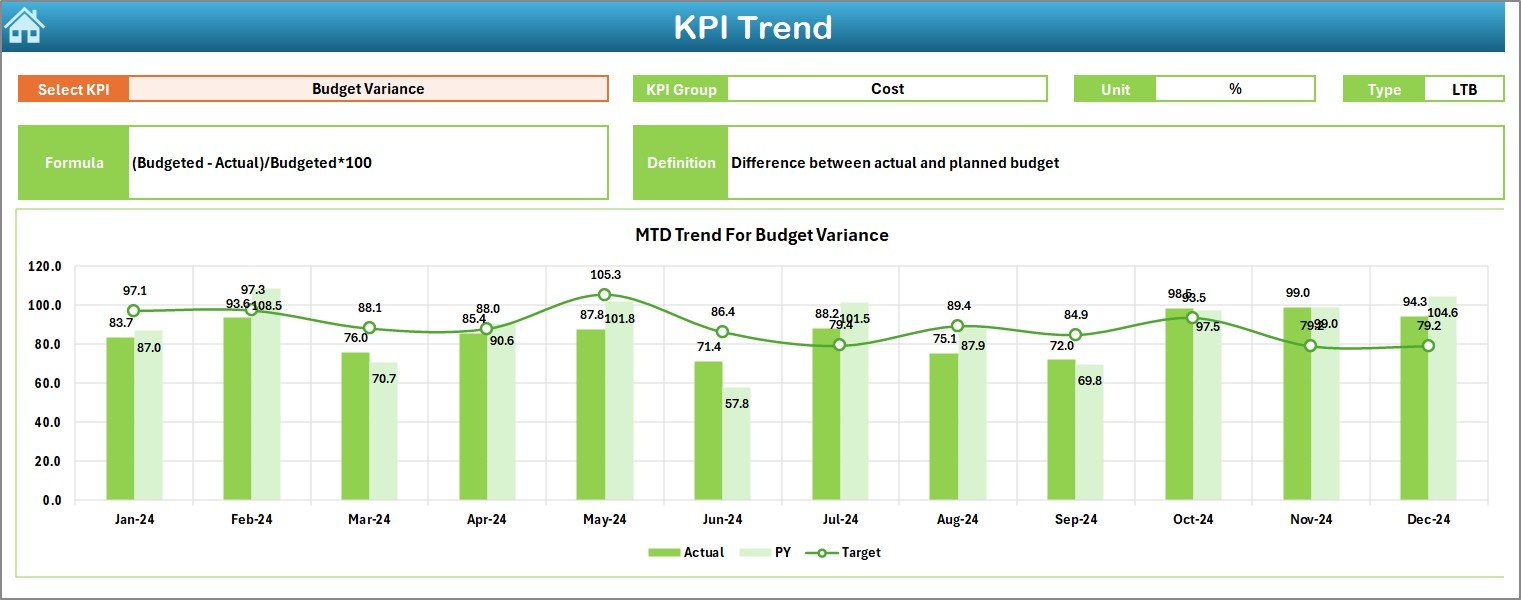
- Drop-down in cell C3 to select any KPI
- Displays KPI Group, Unit, KPI Type (UTB/LTB), Formula, and Definition
- Includes trend charts for MTD and YTD actual, target, and PY values
Actual Numbers Input Sheet
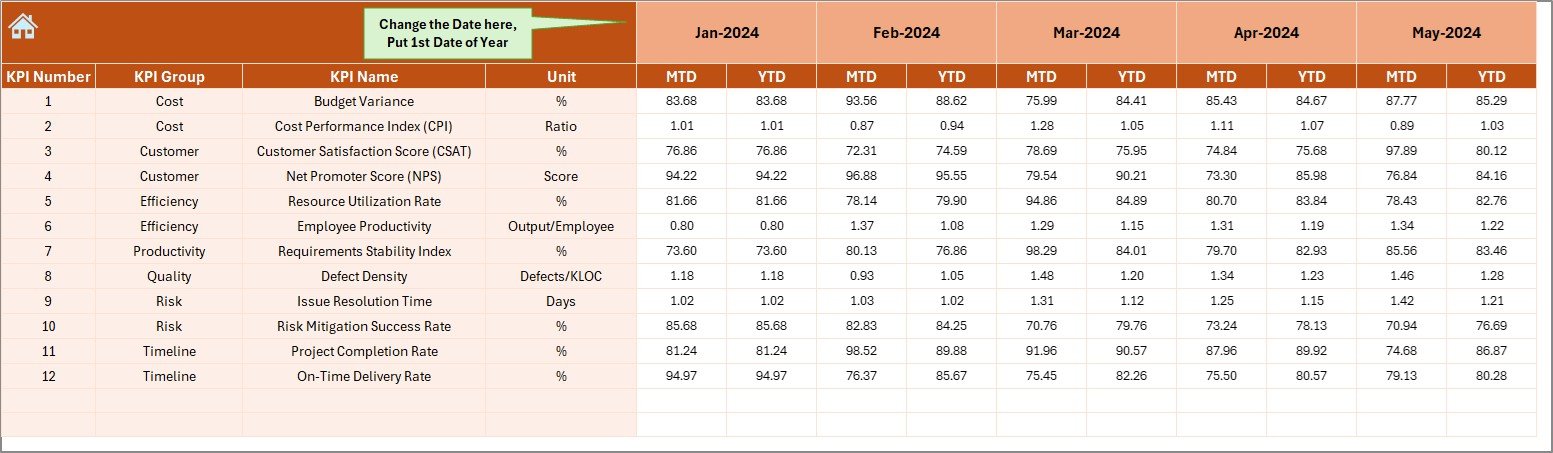
- Enter MTD and YTD actual figures monthly
- Cell E1 defines the first month of the year
Target Sheet
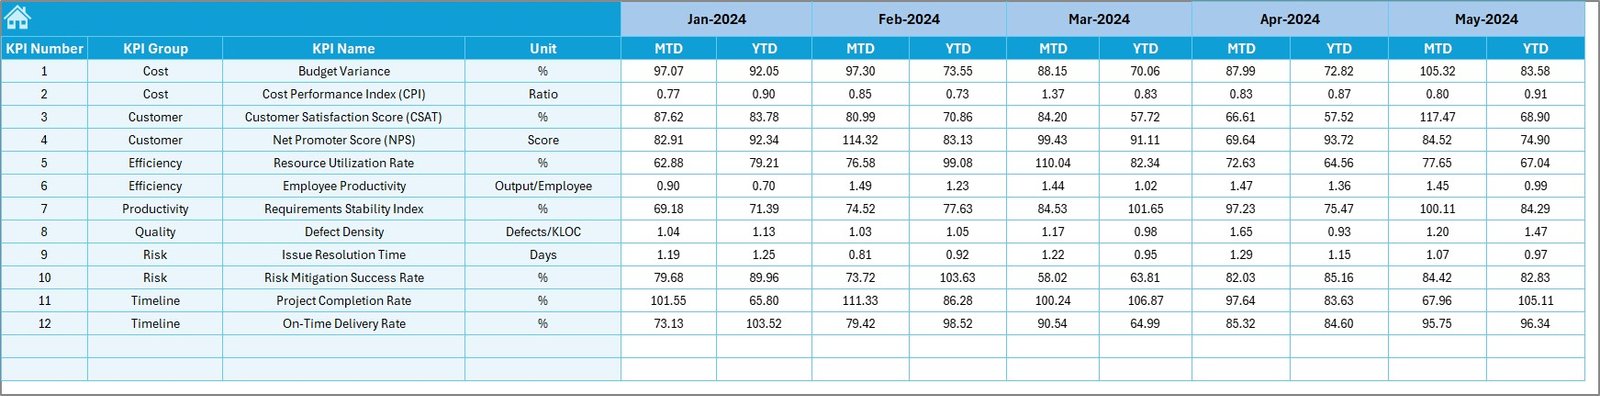
- Input monthly MTD and YTD target figures for each KPI
Previous Year Numbers Sheet
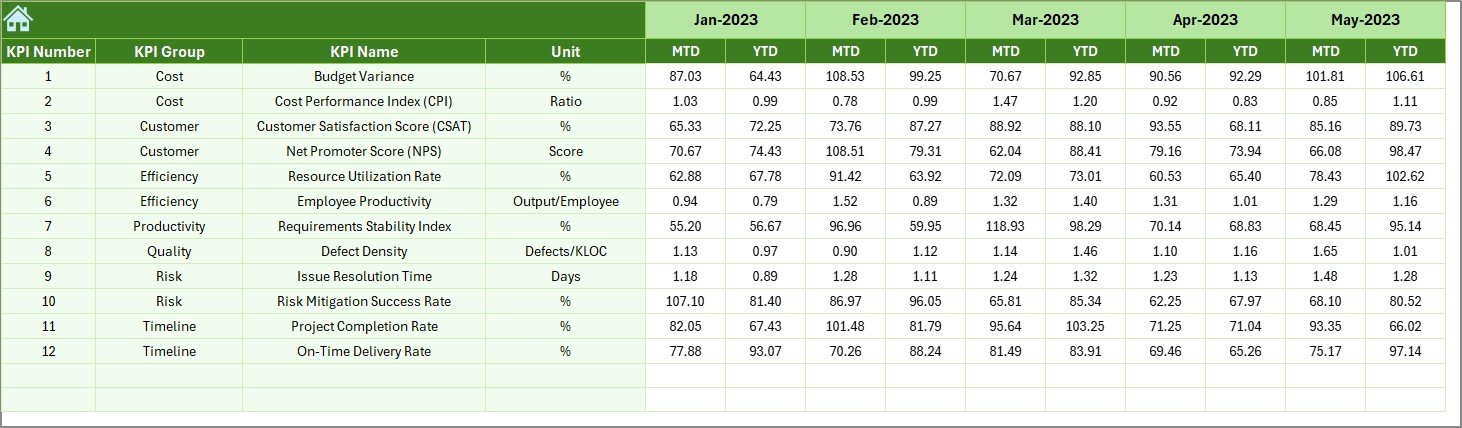
- Store MTD and YTD numbers for the previous year
- Useful for year-on-year performance comparison
KPI Definition Sheet
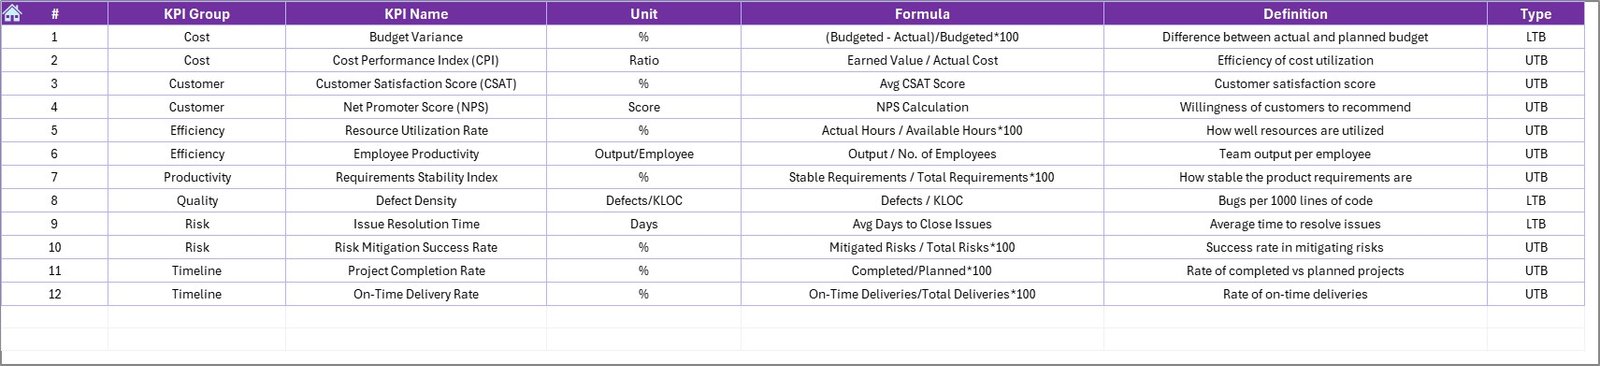
- Define each KPI with its name, group, unit, formula, and brief explanation
-
Click to Purchases Project Management Product Development KPI Dashboard in Excel
Advantages of Using a KPI Dashboard for Product Development
📊 Centralized Monitoring
With all your KPIs in one place, tracking performance becomes easier and faster.
⏰ Real-Time Updates
Just select a month, and the dashboard auto-refreshes. No need to create separate reports.
🎯 Goal Alignment
Compare MTD and YTD performance against targets and last year’s figures for strategic alignment.
🔄 Historical Analysis
Track progress and performance trends with visual graphs in the KPI Trend sheet.
✅ Actionable Insights
Conditional formatting provides visual clues (up/down arrows) to quickly spot underperformance.
Best Practices for Using the Excel Dashboard
1. Maintain Data Consistency
Always follow the defined structure in Actual, Target, and Previous Year sheets. Don’t rename KPIs randomly.
2. Update Regularly
Update actual numbers monthly for best results. Input data immediately after month closure.
3. Set SMART Targets
Ensure that KPI targets are Specific, Measurable, Achievable, Relevant, and Time-bound.
4. Use the Dropdowns Wisely
Use the drop-downs in Dashboard and KPI Trend sheets to change months or select KPIs instead of manually editing formulas.
5. Review the KPI Definitions
The KPI Definition sheet is your reference guide. Make sure it reflects your project goals accurately.
Most Common KPIs for Product Development Projects
Here are some KPIs that you can include in your dashboard:
- Time to Market (TTM): Measures the time taken from idea to launch
- Bug/Defect Rate: Number of bugs identified in development
- Cost Variance: Difference between planned and actual cost
- Schedule Variance: Difference between planned and actual delivery dates
- Innovation Rate: Ratio of new features to total features
- Development Velocity: Number of tasks or story points completed per sprint
- Customer Feedback Score: Rating based on user feedback
Why Use Excel for KPI Dashboards?
Although tools like Power BI or Tableau are great, Excel remains the most accessible and widely used tool:
- 🌐 No Internet Dependency
- 🚀 Quick Setup
- 🔧 Highly Customizable
- 💻 Easy Sharing and Collaboration
- 💡 No Extra Software Cost
You don’t need a developer or license. Anyone with basic Excel knowledge can use this dashboard.
Conclusion
The Project Management Product Development KPI Dashboard in Excel offers everything you need to track, analyze, and act on your product development KPIs. Whether you’re a project manager, product owner, or team lead, this template gives you clarity and control without overwhelming complexity.
Frequently Asked Questions (FAQs)
📈 What KPIs are most important for product development?
Some of the key KPIs include Time to Market, Bug Rate, Cost Variance, and Development Velocity. These help track efficiency, quality, and delivery performance.
🌟 Can I customize the Excel dashboard for my project?
Yes, the template is fully customizable. You can add/remove KPIs or modify the formulas to suit your project.
🔄 How often should I update the dashboard?
It’s best to update the dashboard at the end of every month to ensure real-time tracking and accuracy.
✅ Is this Excel dashboard beginner-friendly?
Absolutely! The dashboard is designed to be user-friendly. With clear labels and dropdowns, anyone with basic Excel skills can use it.
🔍 How do I use the KPI Trend tab?
Select the KPI from the drop-down (cell C3) to view its details and trend chart. It provides a visual representation of MTD and YTD progress.
📅 Can I track previous year data?
Yes, the dashboard allows you to compare current performance with last year’s data through the PY columns and arrows.
🚀 Is this suitable for Agile product development?
Yes! KPIs like velocity, sprint completion, and defect rates make this dashboard ideal for Agile teams too.
Click to Purchases Project Management Product Development KPI Dashboard in Excel
Visit our YouTube channel to learn step-by-step video tutorials
Watch the step-by-step video tutorial: