Every organization that delivers products or services understands the importance of quality. Customers expect reliability, consistency, and satisfaction in every interaction. To achieve this, businesses need effective ways to measure and monitor their performance. One of the most practical tools for this purpose is a Quality Assurance KPI Dashboard in Excel.
This type of dashboard brings together all critical quality metrics in one place, allowing managers and teams to track progress, identify issues, and improve processes. Because it is built in Excel, the dashboard is easy to use, flexible, and highly customizable for any industry.
In this guide, we will explore the structure, features, benefits, best practices, and real-world applications of a Quality Assurance KPI Dashboard in Excel. By the end, you will clearly understand why this dashboard is a powerful solution for maintaining and improving quality in your organization.
Click to Purchases Quality Assurance KPI Dashboard in Excel
What Is a Quality Assurance KPI Dashboard in Excel?
A Quality Assurance KPI Dashboard is a structured reporting tool that displays the most important Key Performance Indicators (KPIs) related to product or service quality. Instead of manually checking scattered reports, the dashboard centralizes all quality data and shows it in a clear, visual format.
In Excel, this dashboard becomes even more powerful because of built-in formulas, charts, and pivot tables. You can track monthly and yearly trends, compare against targets, and highlight gaps—all without complex software.
Simply put, the dashboard acts as your command center for quality monitoring.
Why Use Excel for QA KPI Tracking?
Many organizations wonder why they should use Excel for KPI tracking when there are specialized tools available. Here are some strong reasons:
-
Accessibility: Almost every business already has Excel installed, making it cost-effective.
-
Flexibility: You can customize the dashboard to suit your unique KPIs and reporting needs.
-
No learning curve: Most employees already know the basics of Excel, so training needs are minimal.
-
Integration: Excel can easily pull data from other systems or allow manual entry for smaller businesses.
-
Scalability: Whether you are a small startup or a large enterprise, Excel dashboards scale to your needs.
Excel provides the perfect balance between simplicity and functionality for quality assurance KPI management.
Key Features of the Quality Assurance KPI Dashboard
The Quality Assurance KPI Dashboard in Excel includes several features designed for easy monitoring and decision-making:
-
Centralized dashboard view to track all KPIs in one place.
-
Interactive drop-downs to select months and see updated data.
-
Comparison indicators (MTD, YTD, target, and previous year values).
-
Conditional formatting arrows to highlight performance improvements or declines.
-
Detailed KPI definitions for clarity and consistency.
-
Separate input sheets for actuals, targets, and previous year numbers.
-
Trend charts to monitor long-term progress.
These features make the dashboard user-friendly while ensuring accurate performance tracking.
Step-by-Step Explanation of the Dashboard Structure
This Excel dashboard consists of seven worksheets, each with a specific role. Let us break them down one by one.
Home Sheet
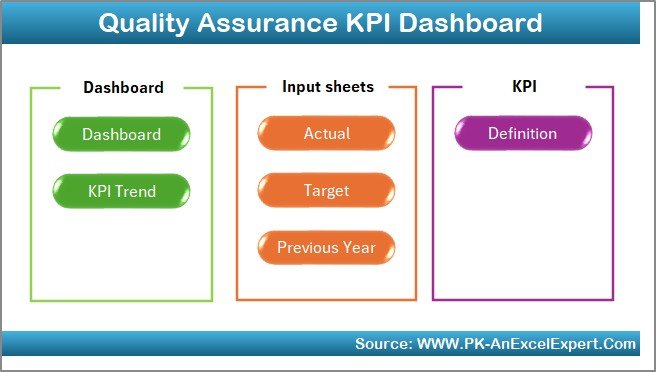
The Home sheet serves as the index page. It contains six navigation buttons that take you directly to the respective sheets. This saves time and makes the file more professional and user-friendly.
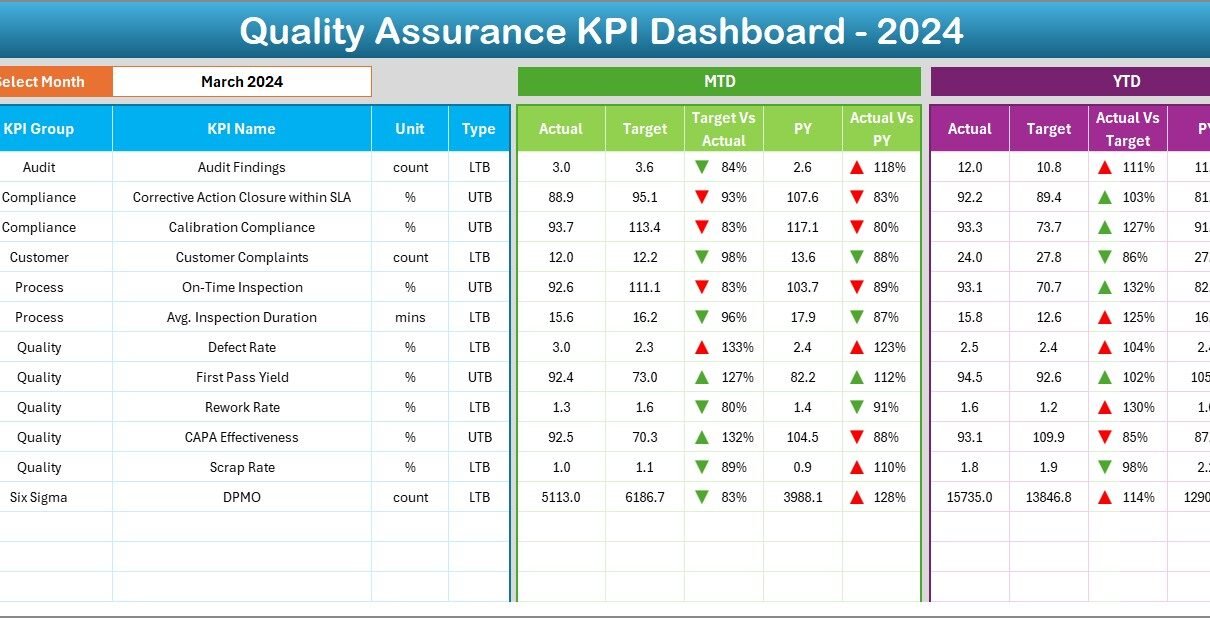
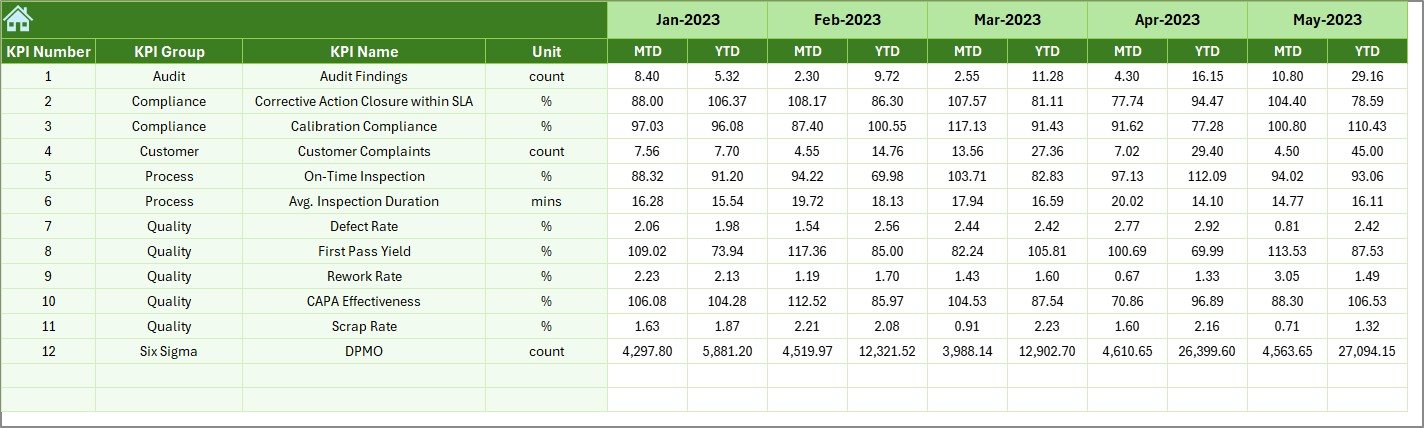
Dashboard Sheet Tab
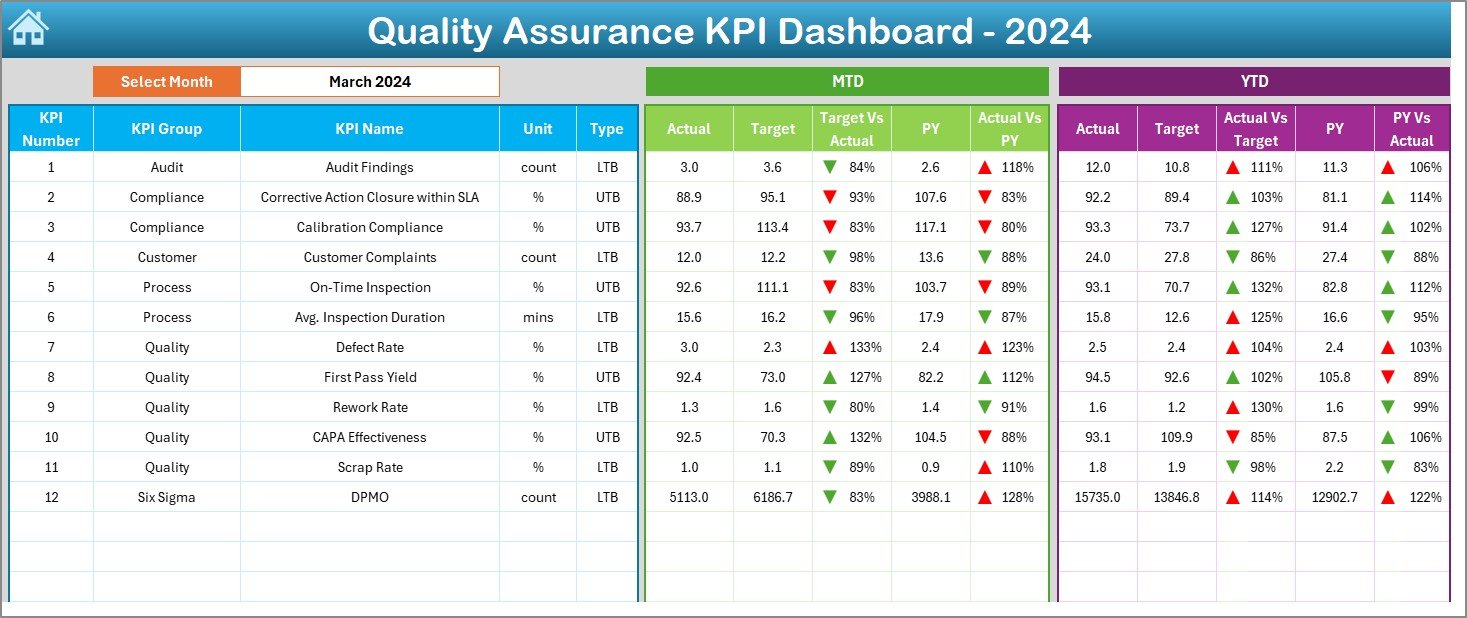
This is the main sheet of the template where all KPI information is displayed.
-
At cell D3, you can select the month from a drop-down menu.
-
Once the month is selected, all KPI values automatically update.
-
Both Month-to-Date (MTD) and Year-to-Date (YTD) data are displayed.
-
Comparison with Target and Previous Year (PY) values is shown.
-
Conditional formatting arrows highlight whether performance improved or declined.
This sheet provides a real-time snapshot of quality performance.
Click to Purchases Quality Assurance KPI Dashboard in Excel
KPI Trend Sheet Tab
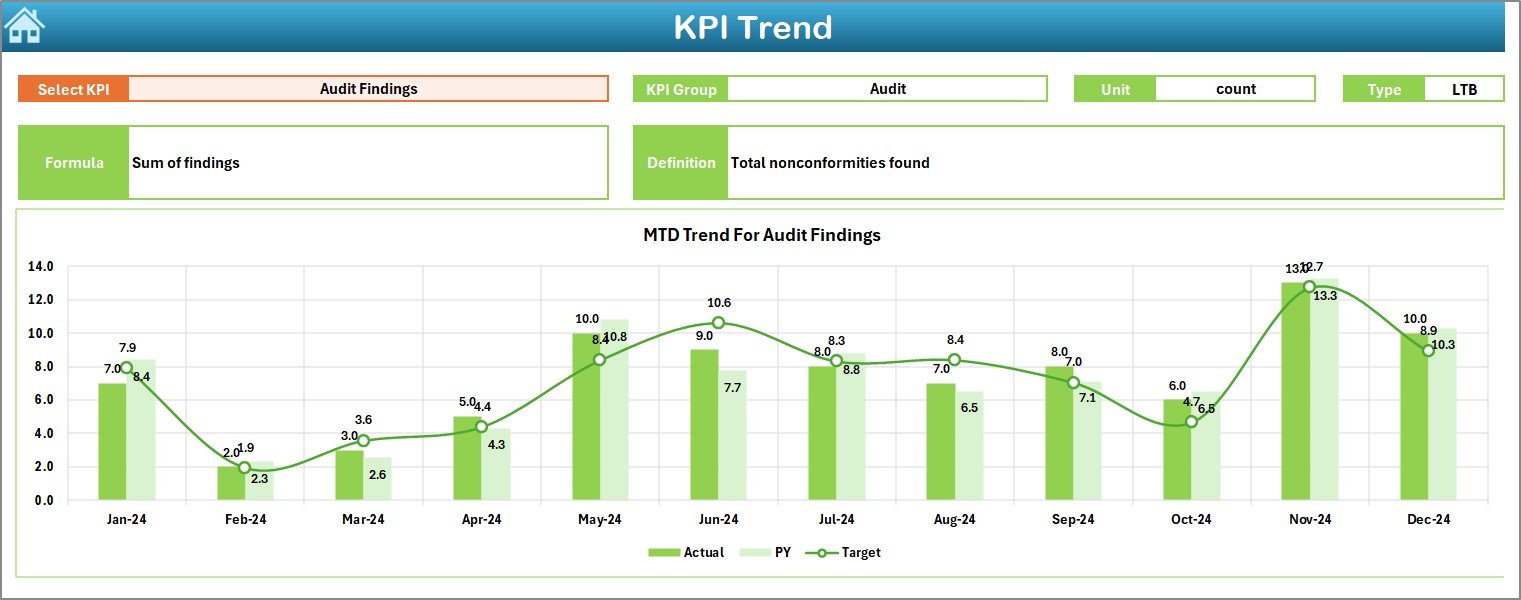
The KPI Trend sheet is designed for detailed performance tracking.
-
At cell C3, you can select a KPI name from a drop-down.
Once selected, the sheet shows details such as:
- KPI Group
- Unit
- Type (UTB – Upper the Better, LTB – Lower the Better)
- Formula
- Definition
-
The sheet also includes trend charts for MTD and YTD numbers compared with Target and PY.
This helps identify whether performance is improving or declining over time.
Actual Numbers Input Sheet
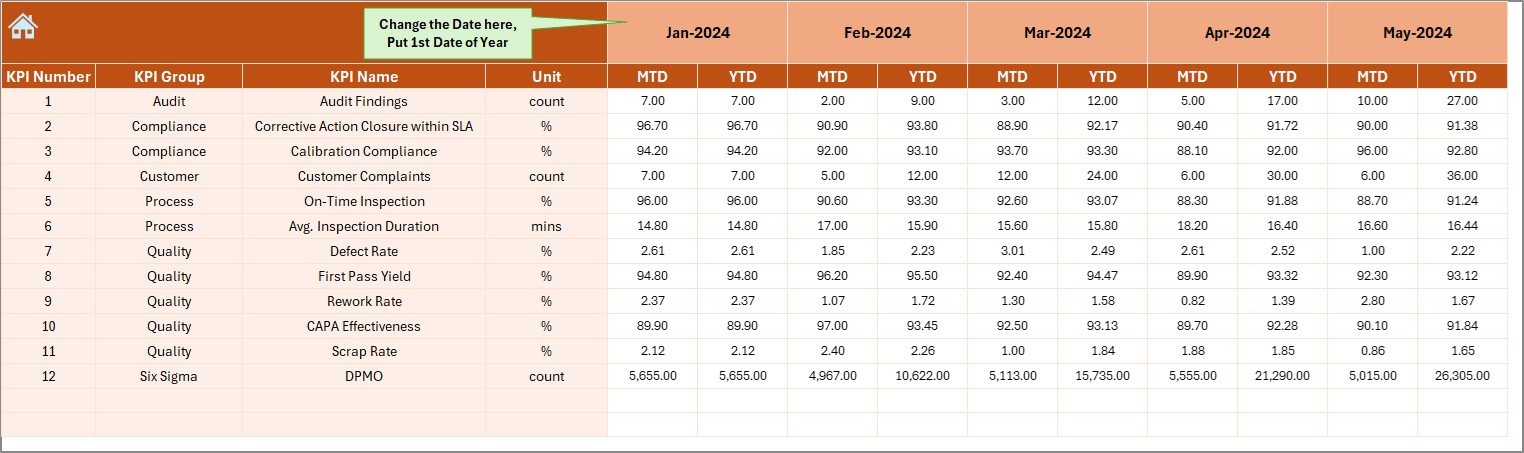
This is the sheet where actual performance numbers are entered.
-
Enter both MTD and YTD values for each KPI.
-
The month can be changed at cell E1, which then adjusts the input fields accordingly.
This ensures that actual results feed directly into the dashboard.
Target Sheet Tab
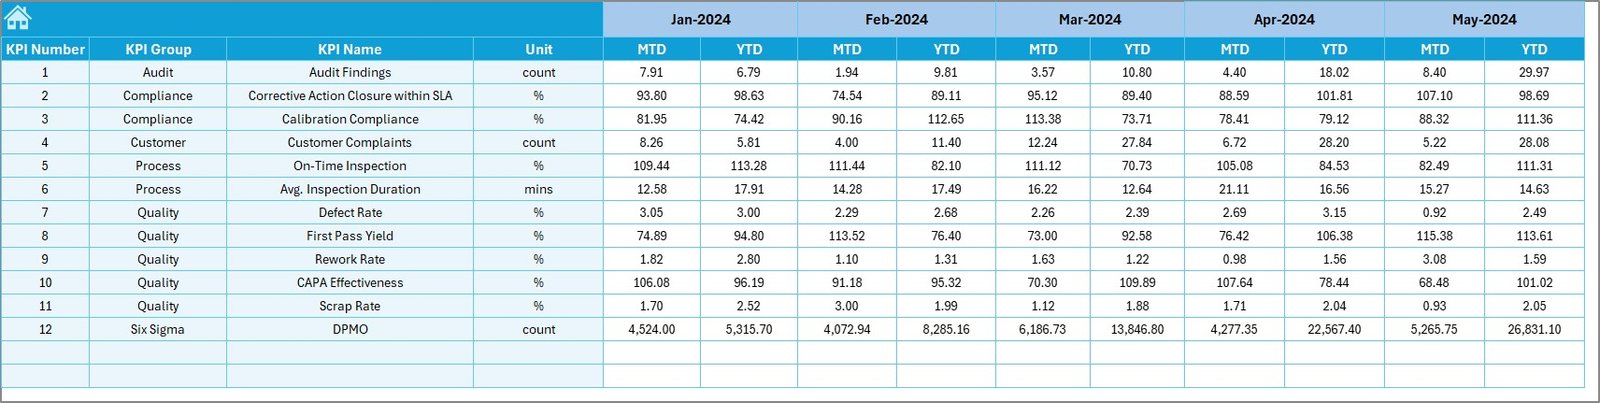
The Target sheet is where you define the goals for each KPI.
-
Enter monthly targets for MTD and YTD values.
-
These targets are automatically used in comparisons on the dashboard.
Previous Year Numbers Sheet Tab
This sheet is used to store last year’s performance data.
-
Input both MTD and YTD values.
-
These values act as benchmarks to evaluate growth and consistency.
KPI Definition Sheet Tab
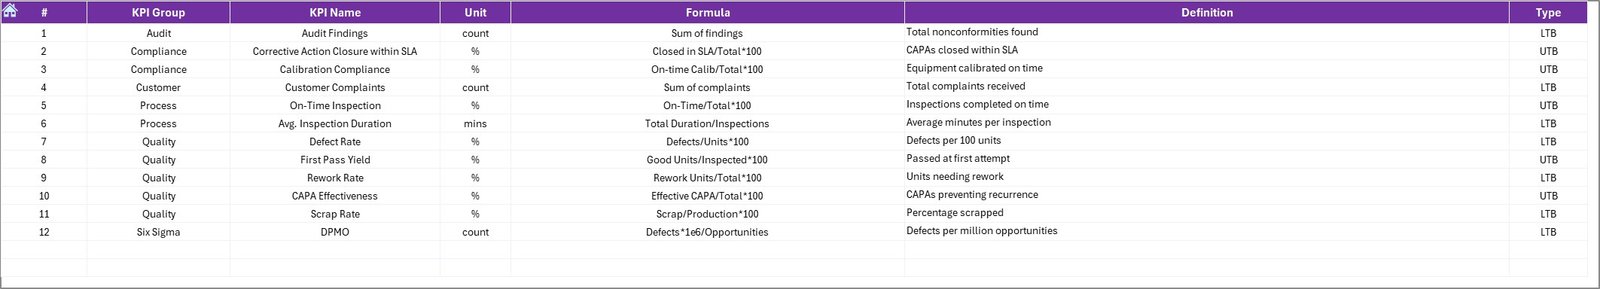
The KPI Definition sheet is a reference sheet that ensures clarity.
-
Enter KPI Name, KPI Group, Unit, Formula, and Definition.
-
This acts as a guide for everyone using the dashboard.
With these seven sheets, the dashboard creates a comprehensive and automated quality tracking system.
Advantages of a Quality Assurance KPI Dashboard in Excel
Using this dashboard provides several benefits:
📊 Centralized View: Track all quality KPIs in one place.
📈 Data-Driven Decisions: Managers can make informed decisions based on real numbers.
⏳ Time-Saving: Automated calculations reduce manual effort.
🎯 Goal Alignment: Easy comparison of actual vs. target performance.
🔍 Transparency: Everyone in the organization can access and understand performance.
📉 Trend Monitoring: Identify issues before they become critical.
💡 Customization: Add or modify KPIs as per organizational needs.
Opportunities for Improvement
Although Excel dashboards are powerful, they also have some limitations:
⚡ Performance may slow down with very large datasets.
🔄 Manual data entry can increase the risk of human error.
📤 Collaboration is limited compared to cloud-based tools.
🔒 Security features in Excel are basic compared to enterprise tools.
Organizations should keep these factors in mind and decide whether to integrate the Excel dashboard with other systems for advanced needs.
Best Practices for Using a Quality Assurance KPI Dashboard
To get maximum benefit from this dashboard, follow these best practices:
✅ Keep KPI definitions clear and consistent.
✅ Regularly update actual, target, and previous year numbers.
✅ Use conditional formatting for better visualization.
✅ Train employees to understand MTD vs. YTD comparisons.
✅ Review KPIs monthly to track continuous improvement.
✅ Protect sheets with formulas to avoid accidental edits.
✅ Back up the file regularly to prevent data loss.
Real-World Applications of QA KPI Dashboards
Here are some practical use cases of Quality Assurance KPI Dashboards in Excel:
Manufacturing: Monitor defect rates, rework time, and on-time delivery.
Healthcare: Track patient safety incidents, compliance checks, and treatment quality.
Education: Evaluate teaching quality, student satisfaction, and assessment accuracy.
Software Development: Measure bug resolution rate, testing efficiency, and release quality.
Retail: Track product return rates, customer complaints, and service quality.
In every industry, the dashboard provides a clear picture of performance and areas of improvement.
How to Customize the Dashboard for Your Organization
Every business is unique, so you may need to adjust the dashboard:
-
Add new KPIs based on your industry.
-
Modify formulas to align with internal metrics.
-
Create additional charts for deeper analysis.
-
Use Excel’s Power Query to automate data import.
-
Protect sheets and lock sensitive data.
With these customizations, the dashboard becomes a tailored tool for quality management.
Conclusion
A Quality Assurance KPI Dashboard in Excel is an essential tool for organizations that want to monitor, improve, and maintain quality. It provides a clear and centralized way to track KPIs, compare against targets, and review trends over time.
With seven structured sheets, the dashboard is easy to use, customizable, and highly effective. While there are some limitations compared to cloud-based systems, Excel remains a reliable and cost-efficient solution.
By following best practices and customizing the dashboard to your needs, you can turn data into actionable insights and drive continuous improvement in quality assurance.
Frequently Asked Questions (FAQs)
1. What KPIs should be included in a Quality Assurance Dashboard?
Common KPIs include defect rate, rework time, on-time delivery, compliance rate, and customer satisfaction. You can customize the dashboard to include industry-specific metrics.
2. How often should I update the dashboard?
It is best to update the dashboard monthly, but some organizations may choose weekly updates depending on their needs.
3. Can small businesses use this Excel dashboard?
Yes, small businesses benefit the most since Excel is cost-effective and easy to implement.
4. Is Excel secure enough for sensitive quality data?
Excel has basic password protection, but for highly sensitive data, you may consider additional layers of security or controlled access.
5. Can the dashboard be shared across teams?
Yes, you can share the Excel file through a shared drive, email, or cloud storage. For real-time collaboration, consider using Excel Online or integrating with SharePoint.
6. What is the difference between MTD and YTD values?
-
MTD (Month-to-Date): Data from the start of the current month until today.
-
YTD (Year-to-Date): Data from the start of the current year until today.
7. How can I make the dashboard more visual?
You can use conditional formatting, progress bars, and trend charts to make the dashboard visually engaging.
Visit our YouTube channel to learn step-by-step video tutorials