The railway freight industry plays a crucial role in global logistics and transportation. Every day, railway operators transport massive volumes of commodities such as coal, steel, grain, cement, and industrial goods across regions and countries. Because railway cargo operations involve multiple stakeholders, complex logistics, and large financial transactions, organizations must continuously monitor operational and financial performance.
However, many railway organizations still rely on scattered spreadsheets, manual reports, and disconnected systems to track cargo operations. As a result, managers often struggle to analyze freight revenue, monitor operating costs, evaluate profit margins, and track payment status efficiently.
Therefore, railway operators increasingly adopt modern dRailway Cargo Dashboard in Power BI ata analytics tools like Power BI to visualize operational data and gain actionable insights. A well-designed dashboard enables organizations to analyze cargo performance in real time and improve decision-making.
One such powerful analytics solution is the Railway Cargo Dashboard in Power BI. This interactive dashboard provides a structured view of freight revenue, operating cost, invoice performance, and profit analysis across different zones, commodities, and wagon types.
Instead of reviewing multiple reports, railway managers can monitor the entire cargo operation through a single centralized dashboard.
In this comprehensive guide, we will explore:
- What a Railway Cargo Dashboard in Power BI is
- Why railway organizations need cargo analytics dashboards
- Key features of the dashboard
- Important railway freight KPIs
- Advantages of using this dashboard
- Best practices for implementing railway cargo dashboards
- Frequently asked questions about railway cargo analytics
Click to buy Railway Cargo Dashboard in Power BI
What is a Railway Cargo Dashboard in Power BI?
A Railway Cargo Dashboard in Power BI is an interactive data visualization tool that helps railway companies monitor freight operations, financial performance, and operational efficiency.
This dashboard consolidates large volumes of railway cargo data into a structured and visually appealing format. Because Power BI offers powerful data modeling and visualization capabilities, users can analyze multiple metrics such as freight revenue, operating cost, profit margin, and invoice payment performance in real time.
Instead of analyzing multiple spreadsheets or static reports, decision-makers can quickly identify operational trends and performance gaps through dynamic charts and KPIs.
A railway cargo dashboard typically tracks:
- Freight revenue generated from cargo shipments
- Operating costs associated with transportation
- Profitability of different routes and cargo types
- Invoice payment status and collection performance
- Commodity-based cargo performance
- Wagon type utilization and profitability
- Zone-wise revenue and cost analysis
As a result, railway logistics managers, financial analysts, and operational teams can make faster and more informed decisions.
Why Do Railway Organizations Need a Cargo Analytics Dashboard?
Railway freight operations involve thousands of shipments, multiple destinations, various commodity types, and complex cost structures. Therefore, tracking operational performance manually becomes extremely difficult.
A Power BI dashboard simplifies this process by providing clear insights.
Here are several reasons why railway companies need a cargo analytics dashboard.
- Monitor Freight Revenue Performance
Railway companies generate revenue from transporting cargo across different zones. A dashboard helps track freight revenue across regions, commodities, and wagon types.
- Control Operating Costs
Operating costs include fuel consumption, maintenance, labor, and infrastructure expenses. By visualizing cost data, managers can identify cost drivers and reduce inefficiencies.
- Track Invoice Payment Performance
Railway cargo services generate invoices for customers. Monitoring the paid invoice percentage helps finance teams evaluate payment collection performance.
- Analyze Profitability Across Operations
By comparing revenue and cost data, organizations can evaluate profit and profit margins across zones, commodities, and wagon types.
- Improve Strategic Decision Making
A centralized analytics dashboard provides insights that help management improve pricing strategies, route planning, and resource allocation.
Key Features of the Railway Cargo Dashboard in Power BI
The Railway Cargo Dashboard in Power BI includes multiple analytical pages designed to analyze freight operations from different perspectives.
This dashboard contains five interactive pages, each focusing on a specific type of analysis.
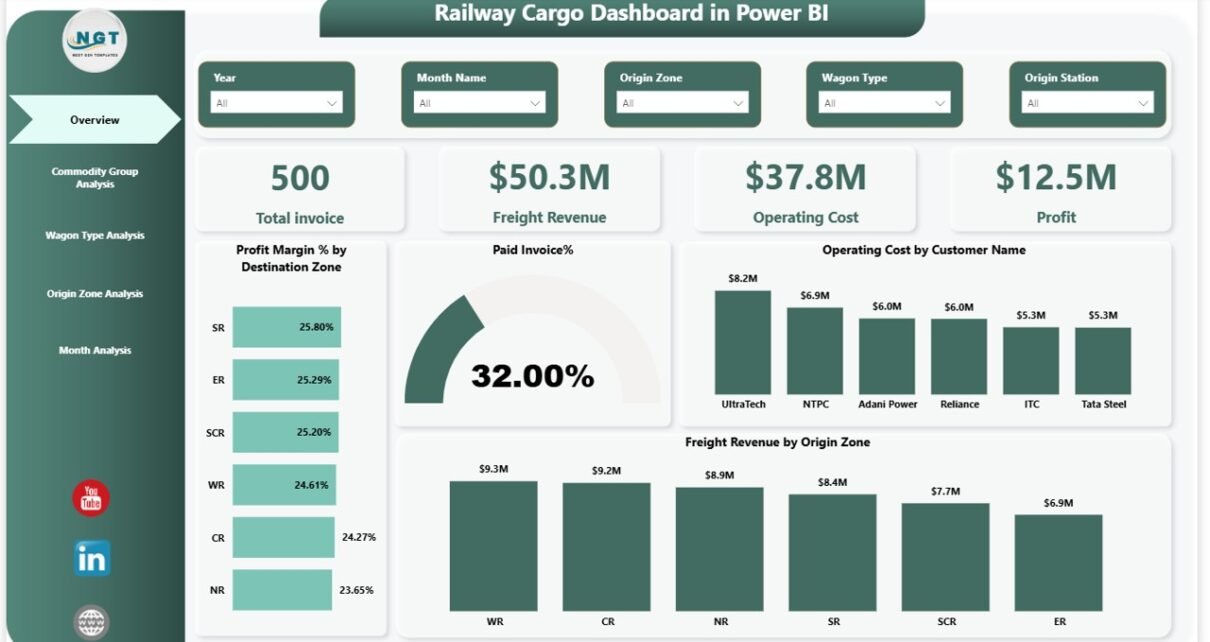
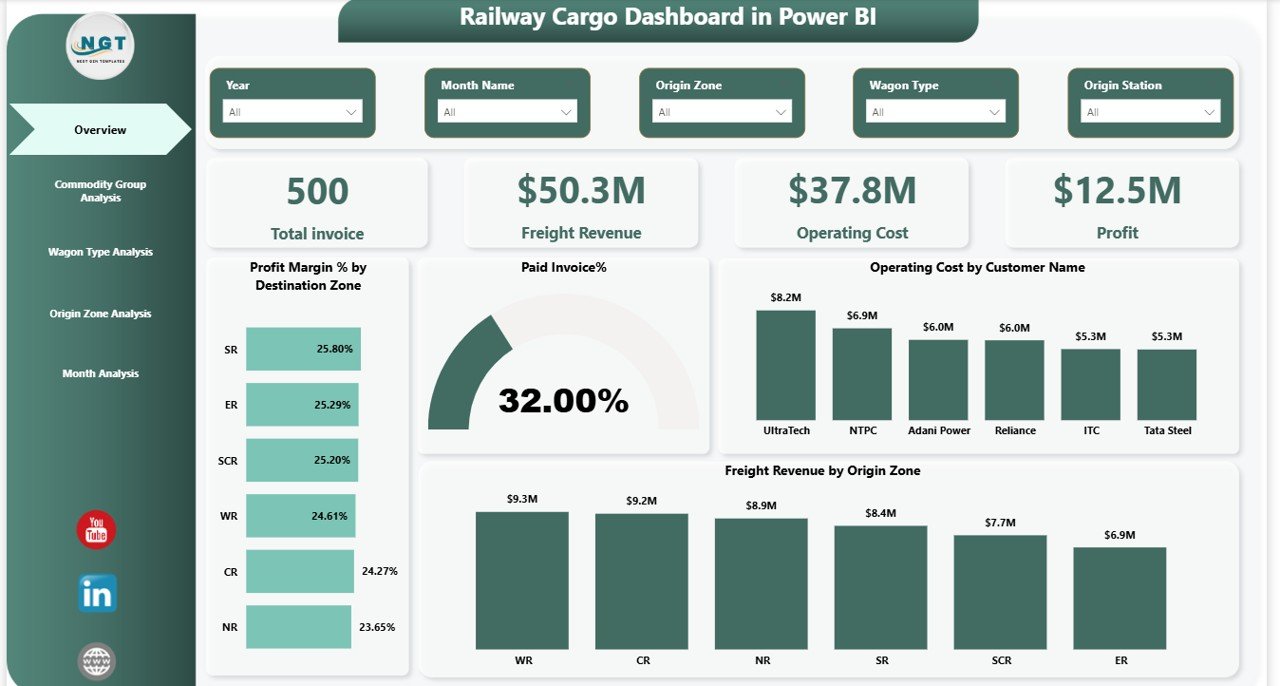
Overview Page: How Does the Main Dashboard Work?
The Overview Page serves as the main dashboard that provides a quick snapshot of railway cargo performance.
This page contains several key indicators and charts that help decision-makers understand overall performance instantly.
KPI Cards on the Overview Page
The dashboard displays four important KPI cards:
- Total Invoice – Total number of cargo invoices generated
- Freight Revenue – Total revenue earned from freight transportation
- Operating Cost – Total operational expenses
- Profit – Net profit generated from cargo operations
These KPIs provide an instant view of financial performance.
Charts Available on the Overview Page
The dashboard also includes several analytical charts:
- Profit Margin % by Destination Zone
Helps analyze profitability across different destination zones. - Paid Invoice %
Tracks the percentage of invoices paid by customers. - Operating Cost by Customer Name
Identifies customers associated with high operational costs. - Freight Revenue by Origin Zone
Shows which zones generate the highest freight revenue.
Together, these visualizations help managers quickly understand operational and financial performance.
Click to buy Railway Cargo Dashboard in Power BI
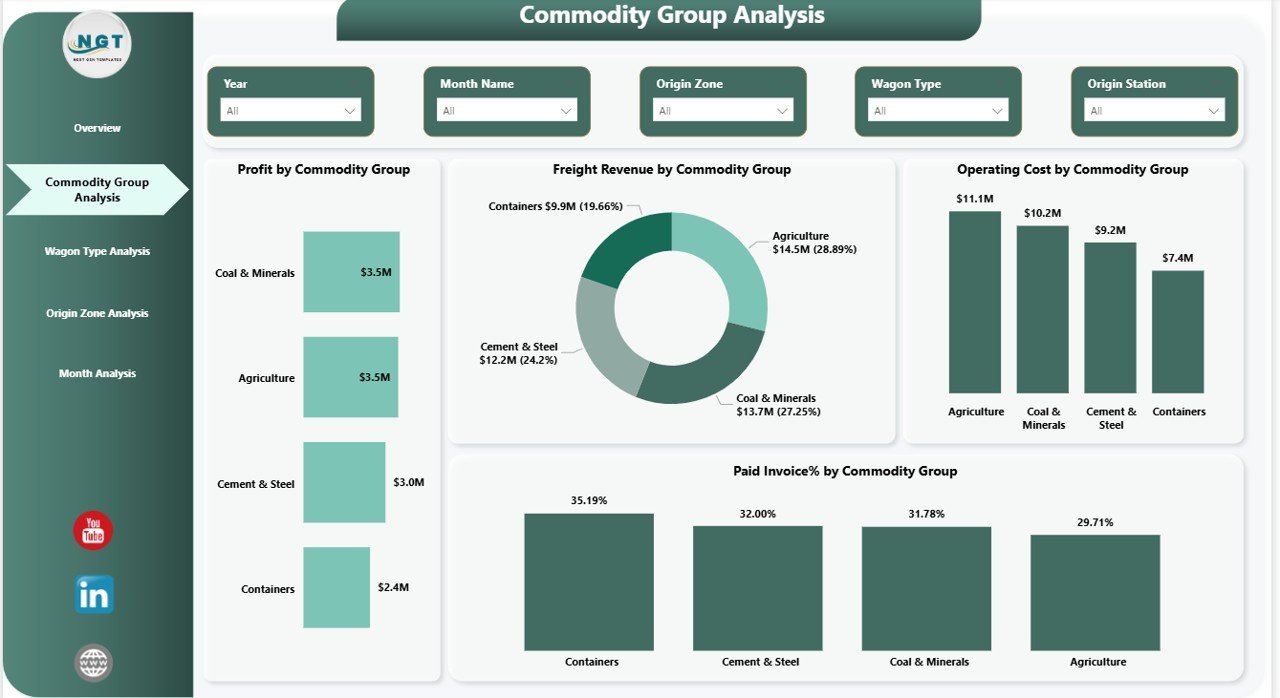
Commodity Group Analysis: How Does Cargo Type Affect Profitability?
Different commodities generate different levels of revenue and operational cost. Therefore, railway operators must analyze cargo performance by commodity group.
The Commodity Group Analysis page provides insights into cargo performance across different commodity categories.
Charts Included in Commodity Analysis
This page includes the following charts:
- Profit by Commodity Group
- Freight Revenue by Commodity Group
- Operating Cost by Commodity Group
- Paid Invoice % by Commodity Group
With these insights, managers can identify which commodity types generate the highest profits and which ones require cost optimization.
Click to buy Railway Cargo Dashboard in Power BI
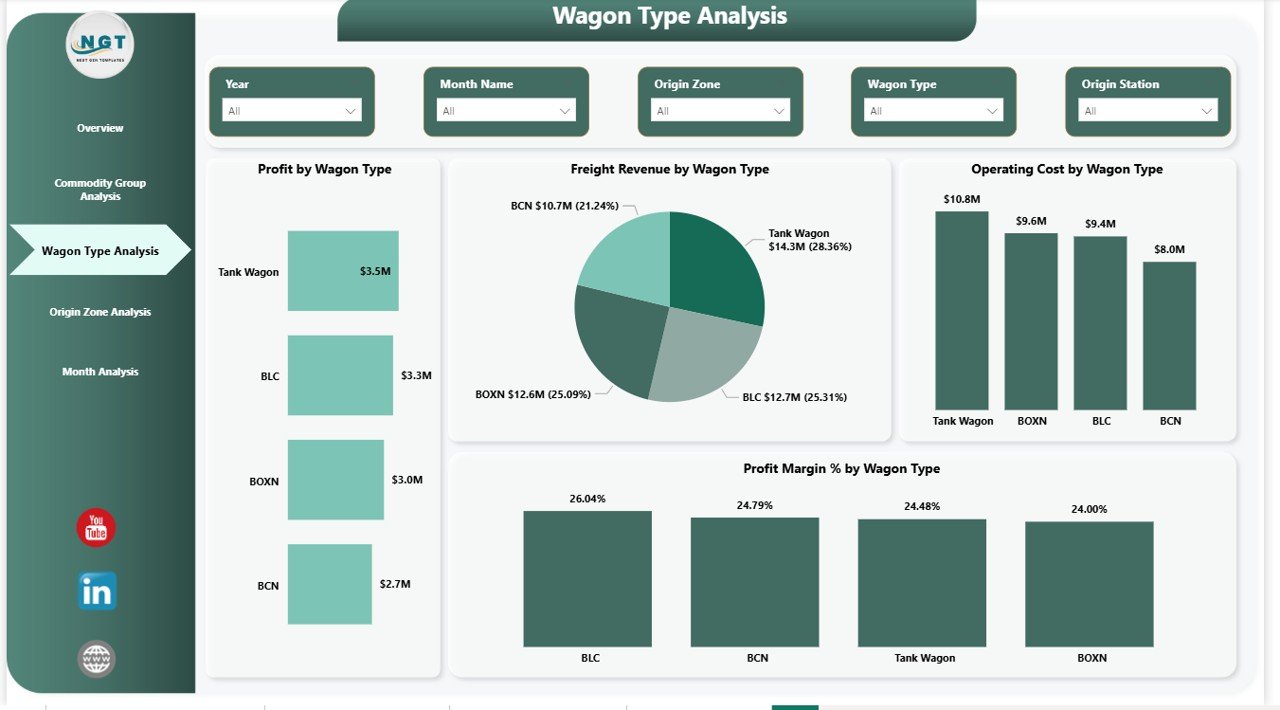
Wagon Type Analysis: Which Wagon Types Generate the Most Profit?
Railway freight operations use different wagon types depending on the cargo category. Some wagons transport bulk materials while others carry containerized cargo.
The Wagon Type Analysis page evaluates the financial performance of each wagon type.
Charts Included in Wagon Type Analysis
- Profit by Wagon Type
- Freight Revenue by Wagon Type
- Operating Cost by Wagon Type
- Profit Margin % by Wagon Type
This analysis helps railway operators determine which wagon types generate the highest profitability.
As a result, organizations can optimize wagon utilization and improve cargo planning.
Click to buy Railway Cargo Dashboard in Power BI
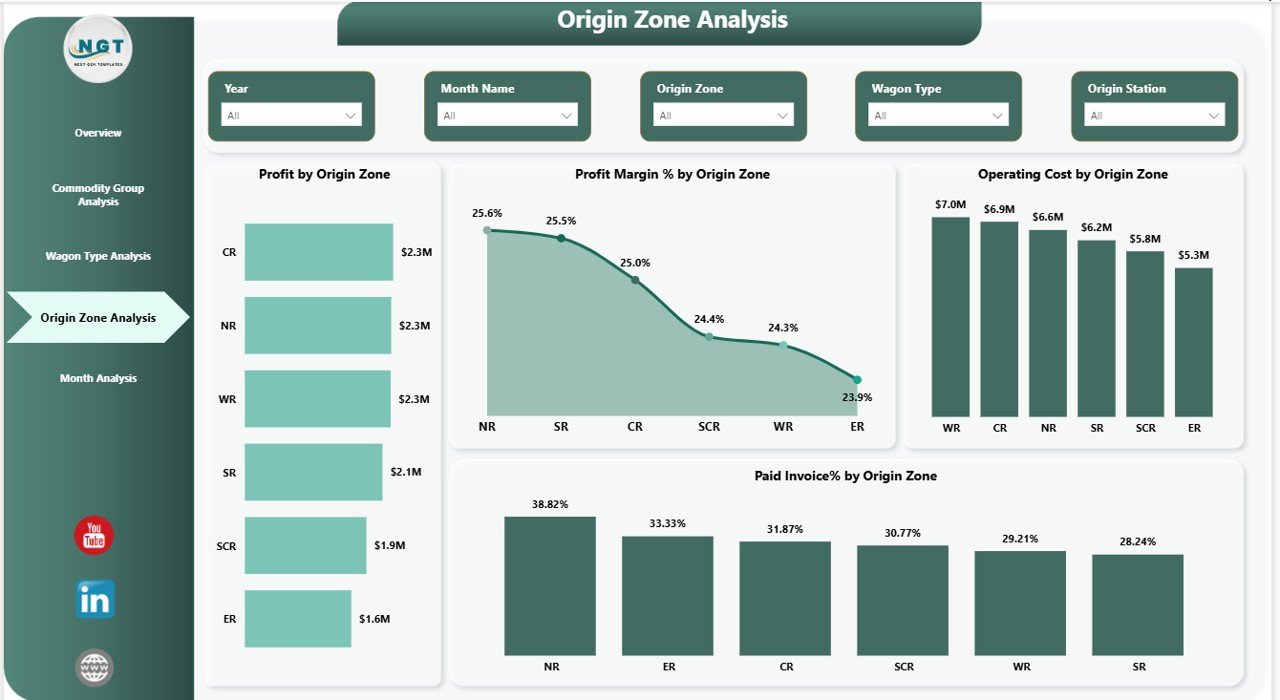
Origin Zone Analysis: How Do Different Zones Perform?
Railway networks often cover multiple geographic zones. Some zones generate higher freight volumes, while others incur higher operational costs.
The Origin Zone Analysis page helps evaluate performance across different zones.
Charts Included in Origin Zone Analysis
- Profit by Origin Zone
- Profit Margin % by Origin Zone
- Operating Cost by Origin Zone
- Paid Invoice % by Origin Zone
By analyzing zone performance, railway organizations can optimize routing strategies and resource allocation.
Click to buy Railway Cargo Dashboard in Power BI
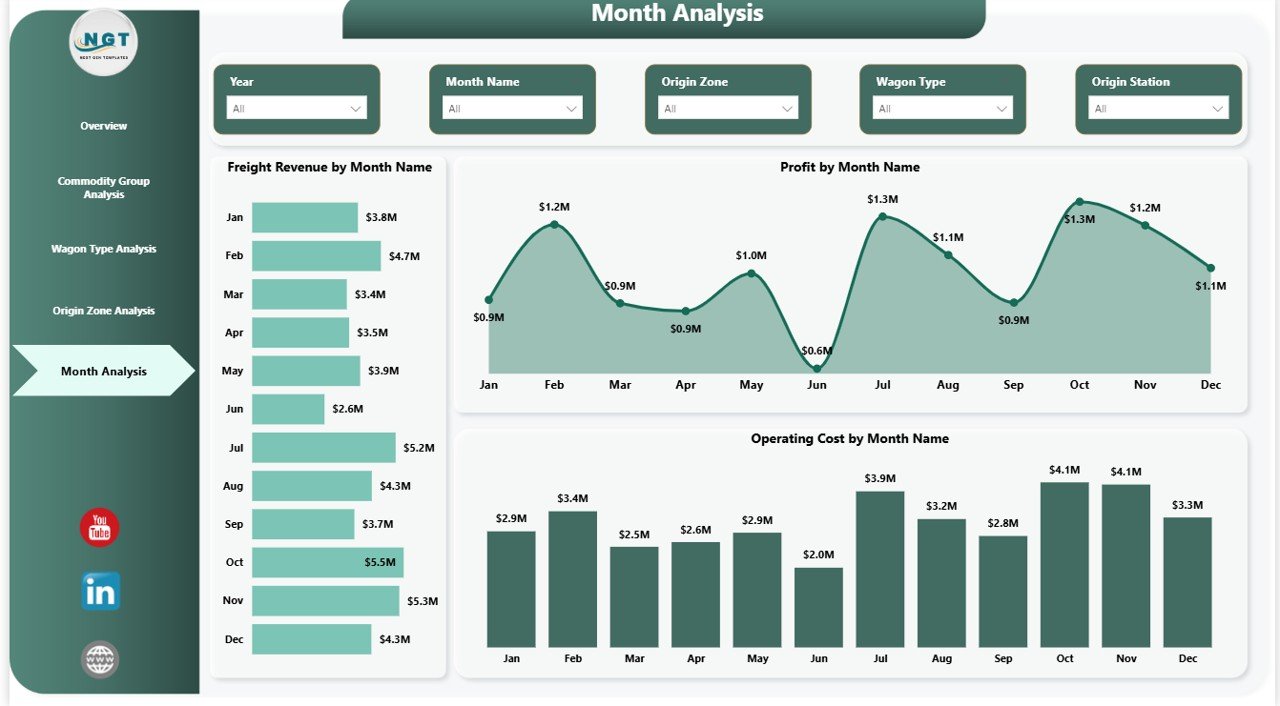
Month Analysis: How Does Performance Change Over Time?
Freight transportation often shows seasonal variations. Some months experience higher cargo volumes while others experience reduced shipments.
The Month Analysis page tracks monthly performance trends.
Charts Included in Monthly Analysis
- Freight Revenue by Month Name
- Profit by Month Name
- Operating Cost by Month Name
This analysis allows management teams to monitor seasonal trends and forecast future cargo demand.
Click to buy Railway Cargo Dashboard in Power BI
Important KPIs for Railway Cargo Performance
A railway cargo dashboard tracks multiple key performance indicators.
Here are some of the most important KPIs included in the dashboard.
Financial KPIs
- Freight Revenue
- Operating Cost
- Profit
- Profit Margin %
Operational KPIs
- Total Invoice Count
- Paid Invoice Percentage
- Revenue by Zone
- Cost by Customer
Cargo Performance KPIs
- Profit by Commodity Group
- Revenue by Wagon Type
- Cost by Origin Zone
Monitoring these KPIs helps railway companies improve operational efficiency and financial performance.
Advantages of Railway Cargo Dashboard in Power BI
A well-designed railway cargo dashboard offers multiple benefits for railway operators.
Centralized Data Visibility
- Consolidates multiple data sources into a single dashboard
- Provides a unified view of cargo performance
- Eliminates manual report analysis
Faster Decision Making
- Managers quickly identify performance trends
- Real-time insights support operational decisions
- Leadership teams make faster strategic decisions
Improved Cost Control
- Identifies high-cost operations
- Helps optimize resource allocation
- Supports cost reduction strategies
Better Revenue Tracking
- Tracks freight revenue across regions and commodities
- Identifies profitable cargo segments
- Helps improve pricing strategies
Enhanced Operational Efficiency
- Improves cargo planning
- Optimizes wagon utilization
- Improves freight scheduling
Opportunities for Improvement in Railway Cargo Analytics
Although railway dashboards provide powerful insights, organizations can improve analytics capabilities further.
Integrate Real-Time Data
Real-time data integration improves operational visibility and enables faster decision making.
Add Predictive Analytics
Predictive models can forecast cargo demand and revenue trends.
Include Route Performance Metrics
Route performance analytics help identify bottlenecks and optimize freight routes.
Integrate Customer Analytics
Customer-level analytics help identify high-value customers and improve service quality.
Best Practices for the Railway Cargo Dashboard
Organizations should follow several best practices when implementing a railway cargo analytics dashboard.
Use Clean and Structured Data
- Maintain consistent data formats
- Validate freight revenue and cost data
- Ensure accurate invoice records
Define Clear KPIs
Clearly defined KPIs help users interpret dashboard insights easily.
Use Interactive Filters
Power BI slicers allow users to analyze data by:
- Zone
- Commodity group
- Wagon type
- Month
Maintain Data Refresh Schedules
Regular data refresh ensures that dashboard insights remain up to date.
Train Users Properly
Organizations should train operational and finance teams to interpret dashboard insights effectively.
Who Can Benefit from a Railway Cargo Dashboard?
Several professionals in the railway and logistics industry can benefit from this dashboard.
Railway Operations Managers
Monitor cargo volumes, route performance, and operational efficiency.
Finance Teams
Track freight revenue, operating costs, and profit margins.
Logistics Planners
Analyze commodity movement and optimize cargo planning.
Senior Management
Use insights for strategic planning and operational optimization.
Conclusion
The railway freight industry requires continuous monitoring of financial and operational performance. However, manual reporting methods make it difficult to analyze large volumes of cargo data efficiently.
The Railway Cargo Dashboard in Power BI provides a powerful solution for analyzing railway freight operations. By consolidating cargo data into an interactive dashboard, railway organizations can monitor freight revenue, control operating costs, evaluate profit margins, and track invoice performance.
Furthermore, the dashboard enables managers to analyze performance across commodities, wagon types, geographic zones, and monthly trends.
As railway logistics operations continue to grow in complexity, data-driven dashboards will play an increasingly important role in improving operational efficiency and profitability.
Organizations that adopt modern analytics solutions like Power BI will gain a significant advantage in managing cargo transportation effectively.
Frequently Asked Questions (FAQs)
What is a Railway Cargo Dashboard?
A railway cargo dashboard is a data visualization tool that helps railway companies monitor freight revenue, operating costs, cargo performance, and profitability.
Why should railway companies use Power BI for cargo analytics?
Power BI provides powerful data visualization, real-time analytics, and interactive dashboards that help railway companies analyze cargo performance efficiently.
What KPIs should railway cargo dashboards track?
Common KPIs include freight revenue, operating cost, profit margin, paid invoice percentage, cargo volume, and wagon utilization.
Can Power BI handle large railway freight datasets?
Yes. Power BI can handle large datasets and integrate with multiple data sources such as databases, ERP systems, and Excel files.
Who should use a railway cargo dashboard?
Railway operations managers, logistics planners, financial analysts, and senior executives can all use this dashboard to monitor cargo performance.
Watch the step-by-step video tutorial:
Visit our YouTube channel to learn step-by-step video tutorials
Click to buy Railway Cargo Dashboard in Power BI