In today’s dynamic real estate market, data drives every investment decision. Investors, analysts, and fund managers need quick insights into performance, risks, and opportunities. That’s where the Real Estate Investment Trusts (REITs) Dashboard in Excel comes in — a powerful, ready-to-use analytical solution that turns raw investment data into clear, actionable insights.
This dashboard helps you visualize trends, track market value, monitor investment performance, and identify high-risk areas — all within a single Excel file. Whether you manage multiple properties or analyze real estate portfolios, this dashboard empowers you with clarity, precision, and speed.
Click to Purchases Real Estate Investment Trusts (REITs) Dashboard in Excel
🧭 What Is a Real Estate Investment Trust (REIT)?
A Real Estate Investment Trust (REIT) is a company that owns, operates, or finances income-generating real estate. REITs provide investors with the opportunity to earn dividends from real estate investments without directly buying, managing, or financing properties themselves.
They typically invest in:
-
Commercial properties like offices, shopping malls, and hotels
-
Residential apartments and rental housing
-
Industrial facilities and warehouses
-
Healthcare, data centers, and infrastructure projects
Managing REIT data involves multiple variables — market value, ROI, property type, occupancy, and risk levels. Without proper visualization, this data remains complex and scattered. That’s exactly where the REIT Dashboard in Excel helps.
https://nextgentemplates.com/product/real-estate-investment-trusts-reits-dashboard-in-excel/
📊 What Is a REIT Dashboard in Excel?
A REIT Dashboard in Excel is a digital analytics solution built in Microsoft Excel that consolidates REIT data into one interactive visual interface. It uses charts, tables, slicers, and formulas to deliver real-time insights into the performance of different properties, regions, and investment types.
This dashboard eliminates the need for multiple reports or manual data tracking. With automated visuals and filters, you can instantly see where your investments are performing well — and where attention is needed.
⚙️ Key Features of the Real Estate Investment Trusts (REITs) Dashboard in Excel
The REITs Dashboard in Excel is designed with simplicity, usability, and efficiency in mind. It comes with five analytical pages and two support sheets, all integrated through an easy-to-use Page Navigator located on the left side.
Let’s explore its structure in detail.
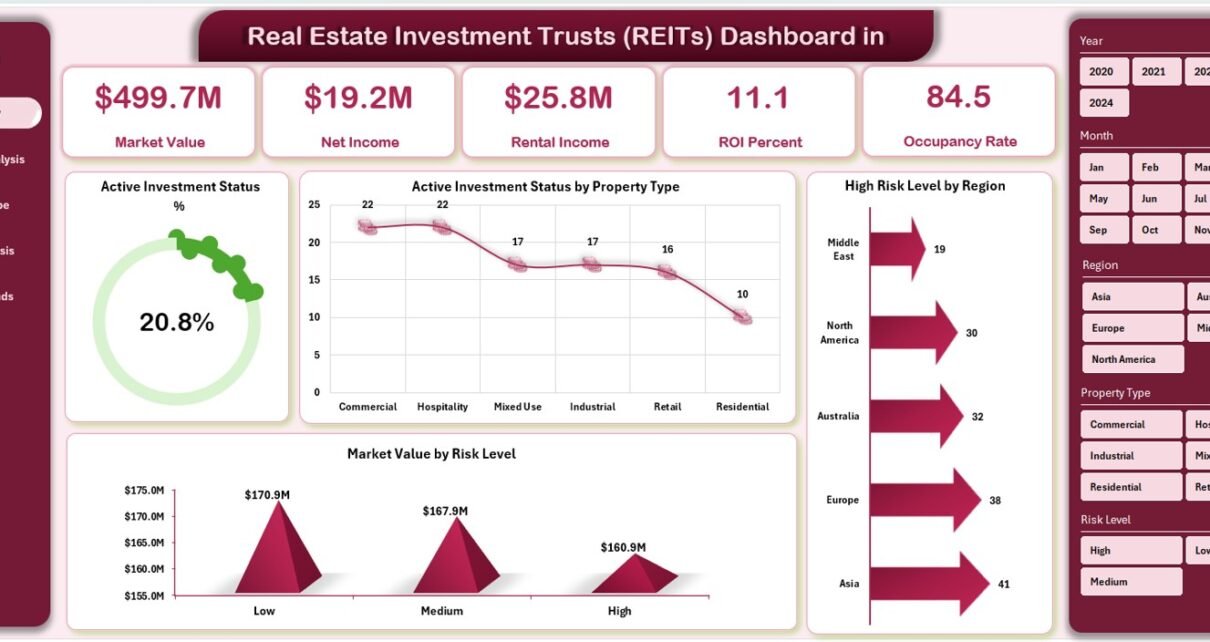
1️⃣ Overview Page
The Overview Page acts as the main control panel of the dashboard.
Here you’ll find:
-
Five key KPI cards that summarize investment performance.
-
Four analytical charts, each designed to highlight critical business metrics.
Charts Included:
-
📈 Active Investment Status – Displays the proportion of active vs. inactive investments.
-
🏢 Active Investment by Property Type – Breaks down ongoing investments by categories like residential, commercial, and industrial.
-
🌍 High-Risk Level by Region – Identifies regions with higher risk exposure.
-
💰 Market Value by Risk Level – Compares total investment value across different risk categories.
This page gives you a quick snapshot of your entire REIT portfolio’s health.
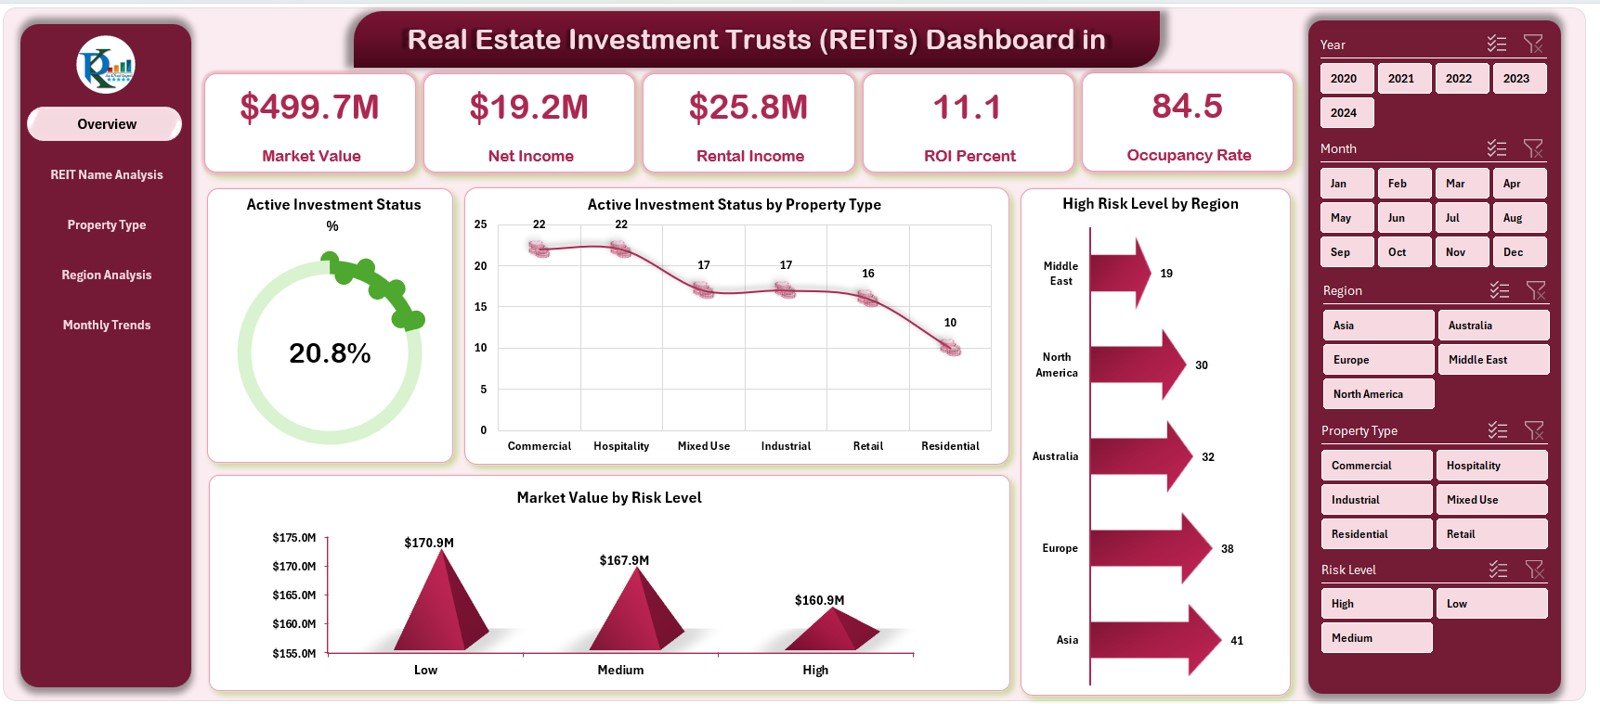
2️⃣ REIT Name Analysis Page
The REIT Name Analysis page dives deeper into each trust’s performance.
It includes:
-
Market Value by REIT Name – Reveals which REITs hold the most valuable assets.
-
ROI (%) by REIT Name – Tracks profitability and return on investment for each trust.
-
Active vs. Pending Investment Status – Compares current progress levels of investments.
-
Rental Income by REIT Name – Shows income-generating performance across trusts.
This analysis helps identify top performers and underperformers in your portfolio.
3️⃣ Property Type Analysis Page
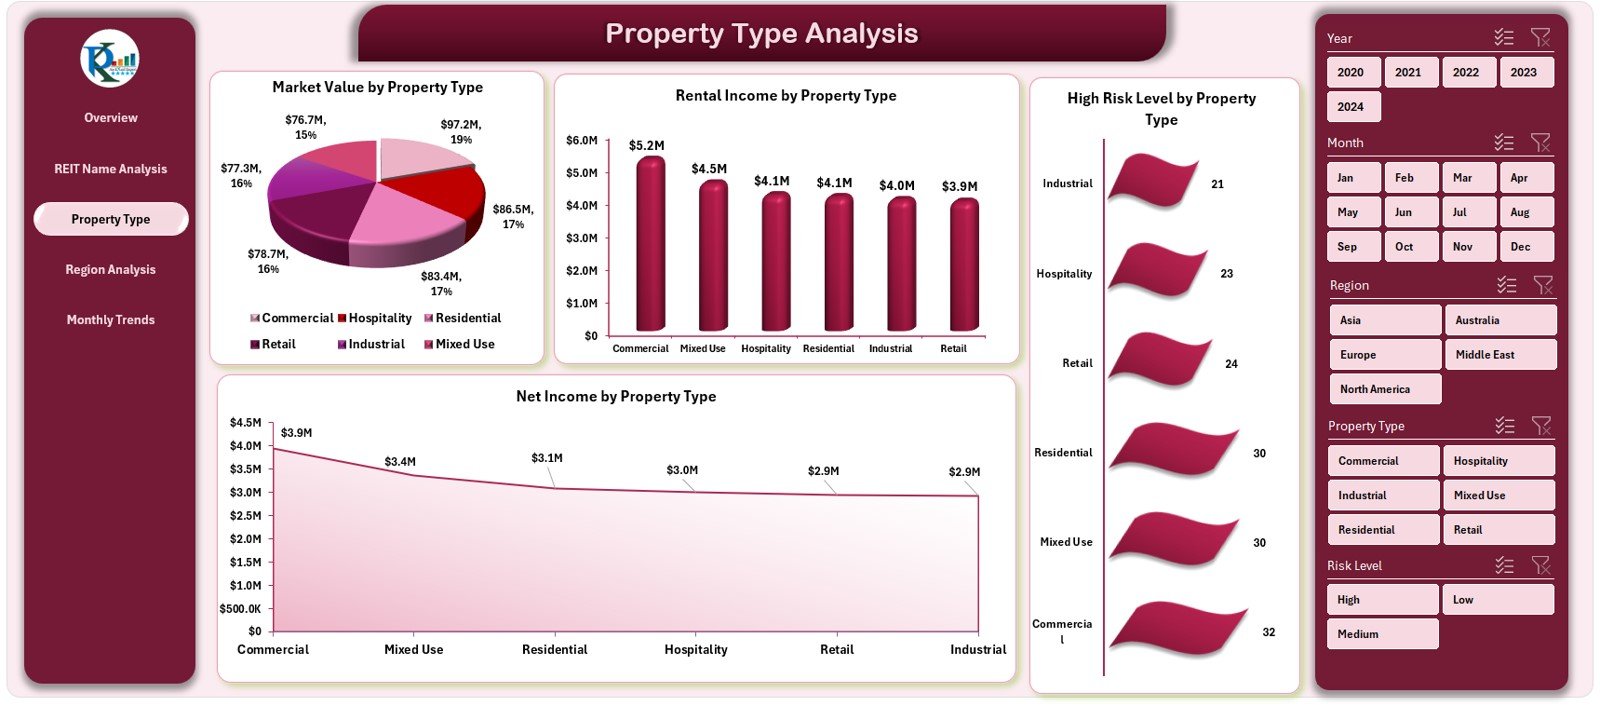
Property Type Analysis Page
The Property Type Analysis section focuses on asset diversification.
Charts Included:
-
🏙 Market Value by Property Type – Compares investment distribution across categories like office spaces, retail, and residential.
-
💵 Rental Income by Property Type – Reveals which property types generate the highest rental yield.
-
📊 Net Income by Property Type – Highlights profitability after operating expenses.
-
⚠️ High-Risk Level by Property Type – Assesses which property classes involve greater investment risk.
This page helps investors allocate resources strategically and balance portfolios effectively.
4️⃣ Region Analysis Page

Geographic performance plays a vital role in REIT analysis. The Region Analysis Page focuses on this dimension.
Charts Included:
-
🌎 Market Value by Region – Displays total investments across different regions or countries.
-
📈 Acquired Investment Status by Region – Tracks property acquisition progress.
-
💰 Net Income by Region – Highlights regional profitability.
-
🏠 Rental Income by Region – Shows how different regions contribute to rental income.
This insight enables you to make informed geographic expansion or divestment decisions.
5️⃣ Monthly Trends Page
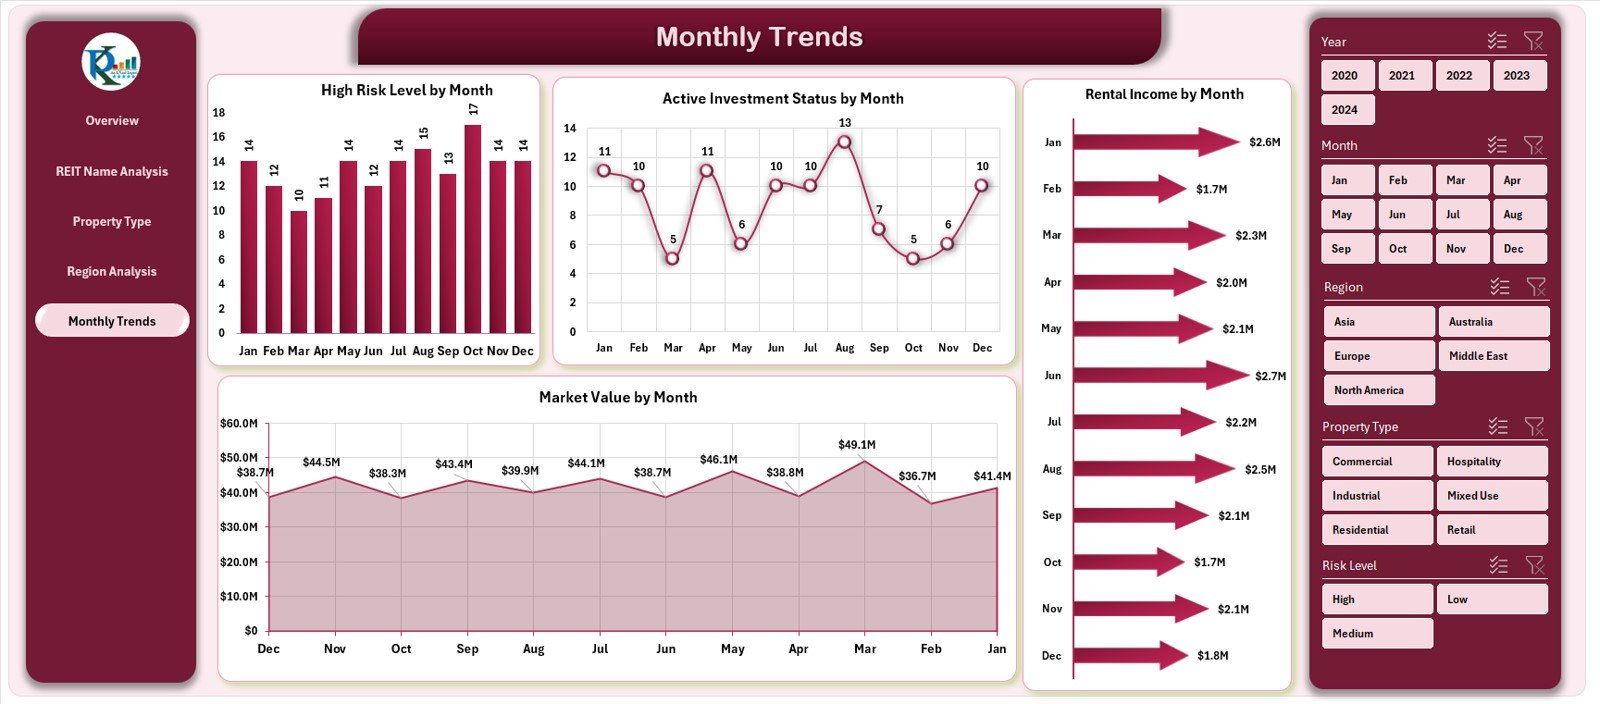
The Monthly Trends page visualizes investment behavior over time.
Charts Included:
-
📆 High-Risk Level by Month – Tracks monthly risk exposure trends.
-
🕒 Active Investment Status by Month – Shows how active investments change each month.
-
💸 Market Value by Month – Monitors total market value fluctuations.
-
🏦 Rental Income by Month – Analyzes rental income trends and seasonality.
These visuals help spot recurring patterns, predict performance, and plan for the future.
🧾 Support Sheet
The Support Sheet acts as a configuration area — containing lists, data validation ranges, slicer source data, and references used throughout the dashboard. It ensures that dropdowns and slicers remain dynamic and easy to maintain.
📑 Data Sheet
The Data Sheet is the foundation of the dashboard. It contains the raw data for REITs, including property names, investment dates, regions, risk levels, ROI, and income. Users can update this sheet with new monthly data to keep the dashboard live and accurate.
💡 Why Use the REITs Dashboard in Excel?
Excel remains the most trusted analytical tool across industries. The REITs Dashboard takes advantage of Excel’s formulas, PivotTables, slicers, and charts to provide a comprehensive, cost-effective solution.
Click to Purchases Real Estate Investment Trusts (REITs) Dashboard in Excel
🔹 Key Benefits
-
Real-time monitoring: Track market trends and investment performance instantly.
-
Customization: Modify visuals, KPIs, and thresholds to suit your needs.
-
Automation: No need to create reports manually; charts update automatically.
-
Accessibility: No expensive software — just Excel.
-
Decision support: Get data-driven insights at a glance.
🧩 How to Use the Real Estate Investment Trusts (REITs) Dashboard in Excel
Using this dashboard is simple and intuitive.
Step 1: Enter Data
Update the Data Sheet with new figures for market value, ROI, and income each month. Ensure all columns — such as REIT Name, Property Type, Region, and Month — are filled.
Step 2: Refresh Pivot Tables
Once data is updated, refresh all pivot tables by pressing Ctrl + Alt + F5 or right-clicking and selecting Refresh All.
Step 3: Explore Dashboard Pages
Use the Page Navigator on the left side to switch between analytical pages like Overview, Region Analysis, and Monthly Trends.
Step 4: Use Slicers and Filters
You can filter data by month, property type, region, or REIT name using slicers. This makes it easy to focus on specific metrics.
Step 5: Analyze and Share
Review key visuals and KPIs. Share insights with team members or clients via Excel, PDF export, or screenshots.
🌟 Advantages of Real Estate Investment Trusts (REITs) Dashboard in Excel
The REITs Dashboard is more than a reporting tool — it’s a decision-making powerhouse.
1️⃣ Better Visibility
All your investment data appears in one central place. You no longer need to open multiple sheets or reports.
2️⃣ Time Efficiency
Automated charts and pivot tables save hours of manual reporting work.
3️⃣ Strategic Insights
Analyze which property types, regions, or REIT names contribute the most to revenue and profits.
4️⃣ Risk Management
Visualize high-risk areas early to take proactive measures.
5️⃣ Informed Decisions
See performance patterns and make smart investment moves based on data, not guesses.
6️⃣ Professional Presentation
Whether for board meetings or investor updates, the dashboard adds a professional touch to your reports.
Click to Purchases Real Estate Investment Trusts (REITs) Dashboard in Excel
💼 Who Can Use the REITs Dashboard in Excel?
This tool caters to multiple stakeholders in the real estate investment industry:
-
Portfolio Managers: To assess overall performance and returns.
-
Financial Analysts: To track ROI, rental income, and risk metrics.
-
Real Estate Developers: To evaluate profitability by property type and region.
-
Investors and Shareholders: To monitor REIT performance and distributions.
-
Consulting Firms: To present client-ready real estate performance reports.
🧠 Insights You Can Gain from the Dashboard
-
Identify top-performing REITs by ROI and rental yield.
-
Compare property types to optimize investment mix.
-
Spot underperforming regions with lower income or higher risks.
-
Monitor market trends to forecast future returns.
-
Assess diversification levels to minimize portfolio risk.
💻 Why Excel Is Ideal for REIT Analysis
While tools like Power BI and Tableau exist, Excel remains a favorite for many professionals because:
-
It’s widely accessible and requires no special setup.
-
Users can customize visuals and formulas easily.
-
It allows offline access and simple data entry.
-
It supports pivot charts, slicers, and automation for dynamic reporting.
-
It’s cost-effective, especially for small and mid-sized firms.
With this dashboard, you get enterprise-level analytics at a fraction of the cost.
📈 Real-World Use Cases of the REIT Dashboard
Here are a few practical applications:
🏙 Real Estate Portfolio Management
Track all investments across multiple REITs, ensuring each property aligns with profitability goals.
💹 Investor Reporting
Generate performance summaries and distribute reports to investors quickly.
🧾 Risk Assessment
Identify exposure across different risk categories and regions.
📊 Performance Forecasting
Analyze historical data to predict future market behavior and rental income.
🏦 Compliance and Auditing
Maintain accurate records for auditing and regulatory requirements.
Click to Purchases Real Estate Investment Trusts (REITs) Dashboard in Excel
🧰 Best Practices for Using the REITs Dashboard in Excel
To maximize the benefits of your dashboard, follow these proven practices:
✅ 1. Keep Data Clean
Ensure your data sheet has consistent entries — same date format, property names, and categories. This prevents chart errors.
✅ 2. Refresh Regularly
Update your dataset monthly to reflect accurate KPIs and maintain relevance.
✅ 3. Use Consistent Units
Keep all financial figures in the same currency (e.g., USD) and consistent decimal places.
✅ 4. Backup Your File
Save periodic backups to protect historical insights.
✅ 5. Customize KPIs
Tailor cards and metrics based on your investment focus — ROI, rental yield, or occupancy rate.
✅ 6. Protect Dashboard Layout
Lock formula cells and design elements to prevent accidental edits.
✅ 7. Use Color Coding Wisely
Highlight positive metrics in green and risk zones in red for better visualization.
✅ 8. Integrate with Power Query
If handling large datasets, use Power Query to automate imports and transformations.
✅ 9. Share Reports Securely
Export the dashboard as a PDF before sharing externally to maintain formatting.
🧩 How the REITs Dashboard Enhances Decision-Making
The REITs Dashboard acts as a digital command center for real estate investors. By offering 360-degree visibility into your REIT portfolio, it simplifies complex decisions like:
-
Which property types to expand or exit?
-
Which regions are overexposed to risk?
-
How to balance short-term returns with long-term growth?
With all insights in one place, your decision-making becomes faster, smarter, and more strategic.
🏁 Conclusion
The Real Estate Investment Trusts (REITs) Dashboard in Excel is a game-changing tool for anyone managing or analyzing real estate investments. It combines the power of data visualization with the simplicity of Excel — delivering insights that drive better performance and profitability.
Whether you’re an individual investor, a fund manager, or a consultant, this dashboard helps you track investments, evaluate risks, monitor ROI, and plan strategically — all within a single, intuitive Excel file.
Stay ahead in the competitive real estate world with the REITs Dashboard — your key to smarter, data-driven investment decisions.
❓ Frequently Asked Questions (FAQs)
1️⃣ What is a REIT Dashboard in Excel?
A REIT Dashboard in Excel is an analytical tool that consolidates all real estate investment data and presents it in visual form using charts, KPIs, and slicers.
2️⃣ How does the REIT Dashboard help investors?
It helps investors analyze performance across REIT names, regions, and property types — enabling faster and more informed decisions.
3️⃣ Do I need advanced Excel skills to use it?
No. The dashboard is user-friendly and comes with pre-built formulas and charts. You just need to update your data sheet regularly.
4️⃣ Can I customize the dashboard?
Yes. You can modify KPIs, color themes, and data structures based on your reporting needs.
5️⃣ How often should I update the dashboard?
Ideally, you should update it monthly or quarterly to keep your analysis relevant and up to date.
6️⃣ What kind of data can I include?
You can include property type, REIT name, region, market value, ROI, rental income, and risk levels.
7️⃣ Is it compatible with all Excel versions?
The dashboard works best with Microsoft Excel 2016 or later (Windows or Mac).
8️⃣ Can I integrate it with Power BI or Google Sheets?
Yes. You can export the data to Power BI or import it into Google Sheets for extended visualization.
Click to Purchases Real Estate Investment Trusts (REITs) Dashboard in Excel
Visit our YouTube channel to learn step-by-step video tutorials