Real estate valuation plays a major role in smart property decisions. Whether you manage residential units, commercial spaces, or mixed-use portfolios, you need complete clarity on your property performance. However, when you track numbers manually, the process becomes slow, confusing, and time-consuming.
That is why a Real Estate Valuation KPI Dashboard in Excel offers a simple yet powerful solution. It brings all important numbers into one automated dashboard and helps you measure valuation KPIs with precision. In this detailed guide, you will learn what this dashboard does, how it works, and how you can use it to improve your property valuation accuracy.
Click to Purchases Real Estate Valuation KPI Dashboard in Excel
What Is a Real Estate Valuation KPI Dashboard in Excel?
A Real Estate Valuation KPI Dashboard in Excel is a smart reporting system that tracks all valuation KPIs such as market value, rental yield, cap rate, occupancy rate, operating costs, and net operating income. It converts raw property data into clean visuals, cards, trend charts, and insights.
Excel automates the calculations, so you don’t struggle with formulas or manual reports. You just update the actual numbers, and the dashboard refreshes instantly. Because of this, real estate owners, valuation specialists, brokers, asset managers, and property consultants use such dashboards for accurate performance tracking.
Why Do You Need a Real Estate Valuation KPI Dashboard?
You need this dashboard because:
-
Property data gets complicated when you manage multiple assets.
-
Monthly valuation reports take time when created manually.
-
Decision-makers require accurate insights on returns, trends, and performance gaps.
-
Investors expect transparency and justification for asset values.
This dashboard simplifies everything. It gives you clarity, consistency, and confidence when evaluating any property.
Click to Purchases Real Estate Valuation KPI Dashboard in Excel
Key Features of the Real Estate Valuation KPI Dashboard in Excel
This dashboard includes 7 worksheets, each designed to help you track the right KPIs easily.
1. Home Sheet – Quick Navigation Panel
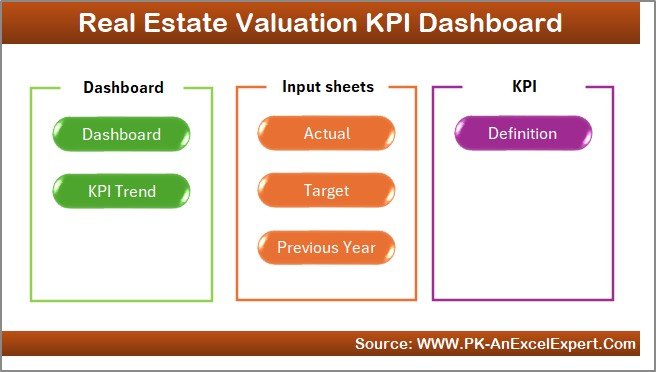
The Home sheet acts as the index page.
It includes six clickable buttons, each linked to an important sheet.
You jump to any part of the dashboard instantly, so you save time and avoid confusion.
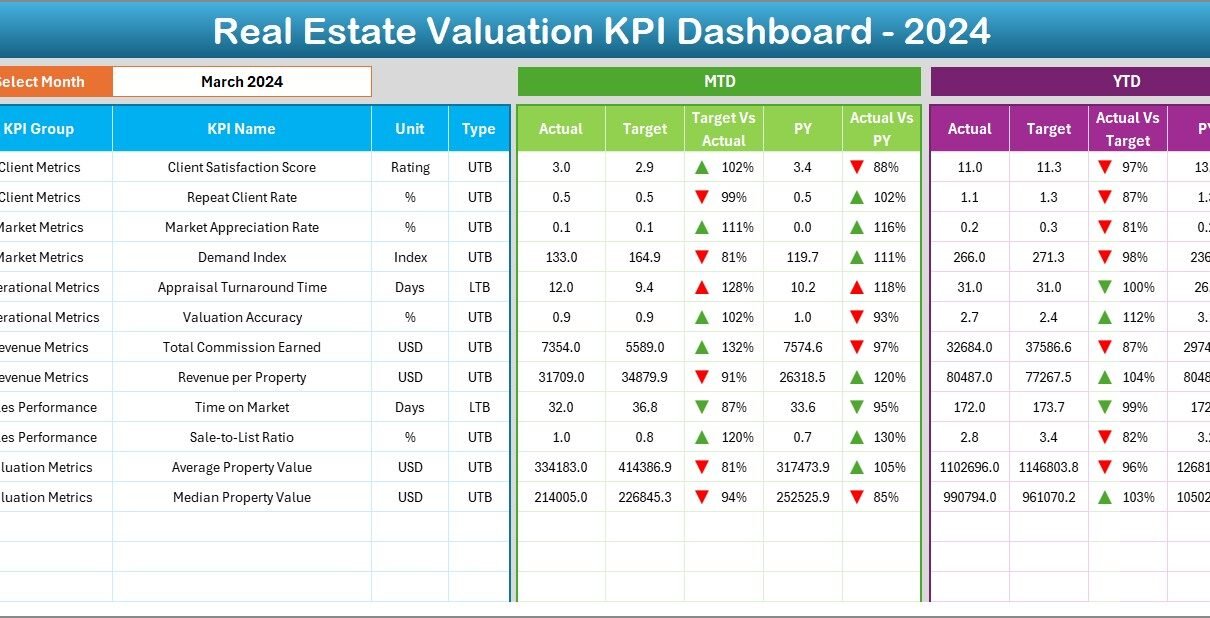
2. Dashboard Sheet – Main KPI Summary Page
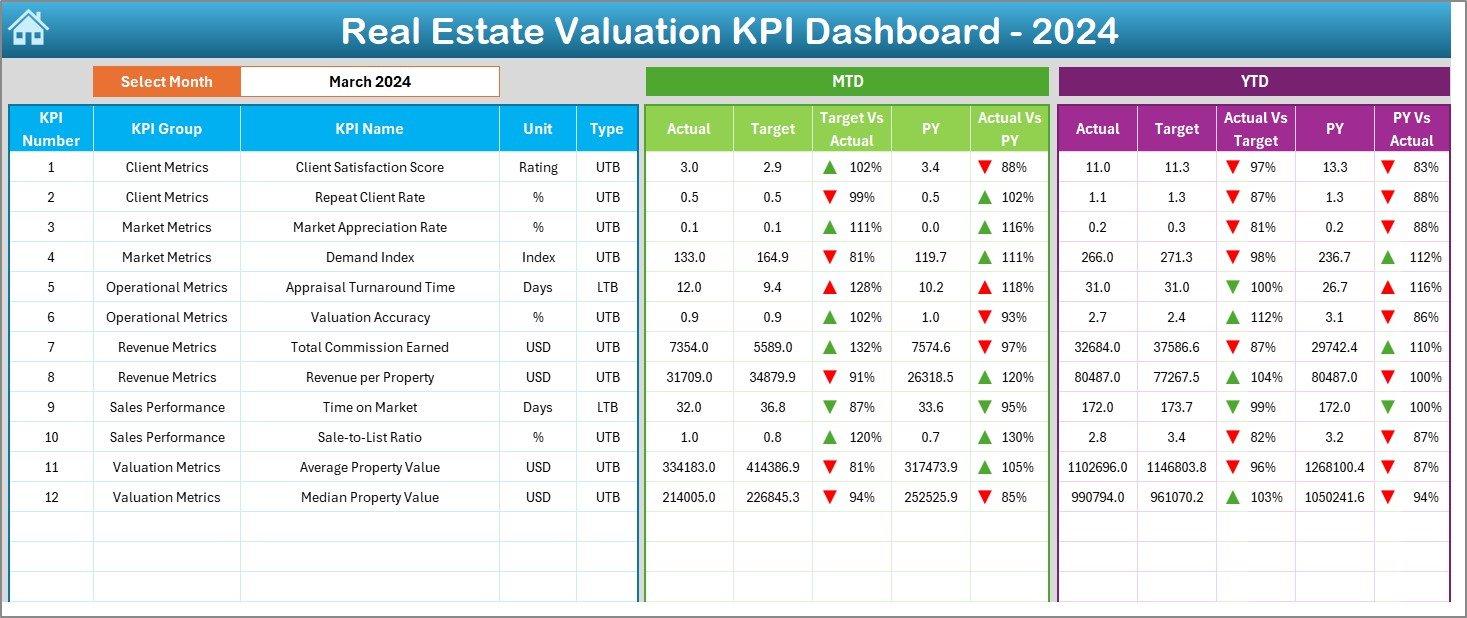
This is the central page of the entire Excel file.
You view all valuation KPIs in one place, along with comparison charts and card-style visuals.
Select the Month Easily
-
Use the drop-down menu in cell D3.
-
Choose any month.
-
The dashboard instantly updates all KPI summaries.
Dashboard Insights Include:
MTD (Month-To-Date) KPIs
-
Actual
-
Target
-
Previous Year (PY)
-
Target vs Actual
-
PY vs Actual
Each comparison includes up/down conditional arrows, so you know if the KPI is improving or declining.
YTD (Year-To-Date) KPIs
-
Actual
-
Target
-
Previous Year
-
Target vs Actual
-
PY vs Actual
The dashboard highlights valuation accuracy, revenue performance, rental efficiency, and cost ratios across the year.
3. KPI Trend Sheet – KPI Wise Monthly Trends
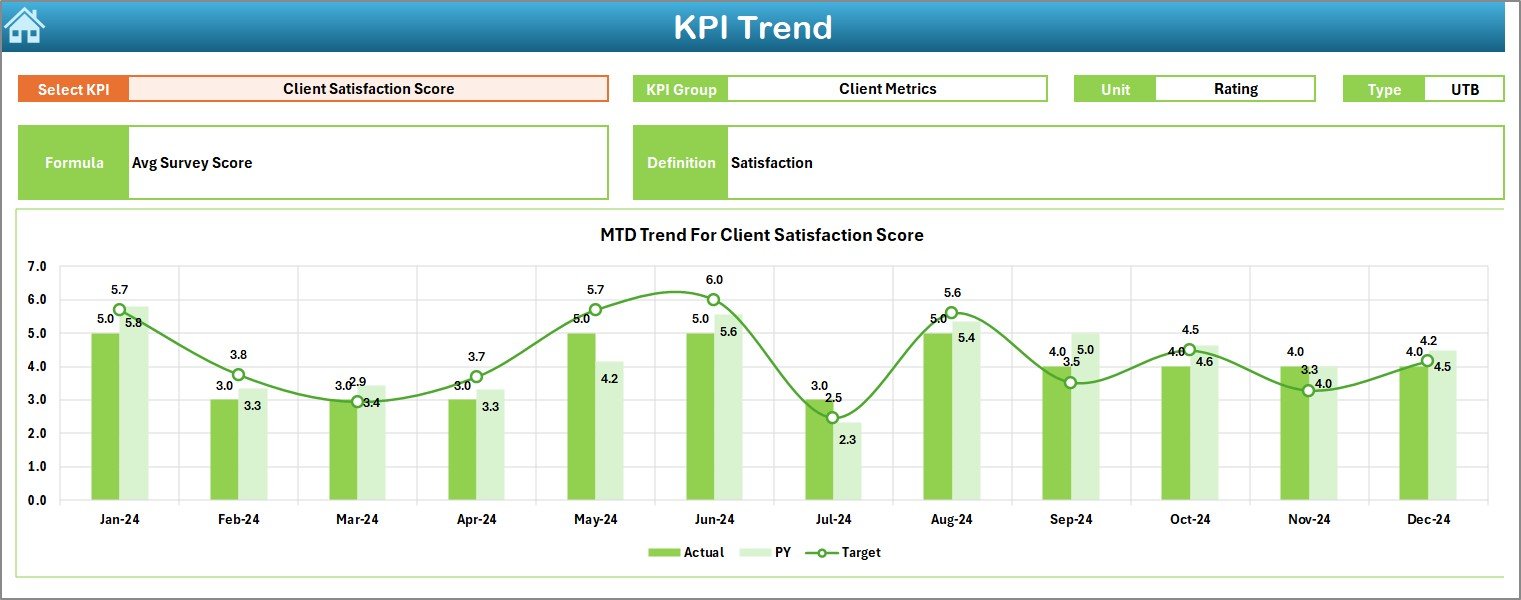
This sheet helps you study individual KPI performance over months.
Features of KPI Trend Sheet
-
Select a KPI from the dropdown in cell C3.
-
Instantly view:
-
KPI Group
-
Unit
-
Type (Lower the Better – LTB, Upper the Better – UTB)
-
Formula
-
Simple definition
-
-
View MTD & YTD trend charts for:
-
Actual
-
Target
-
Previous Year
-
This sheet improves forecasting and helps you understand seasonality patterns.
Click to Purchases Real Estate Valuation KPI Dashboard in Excel
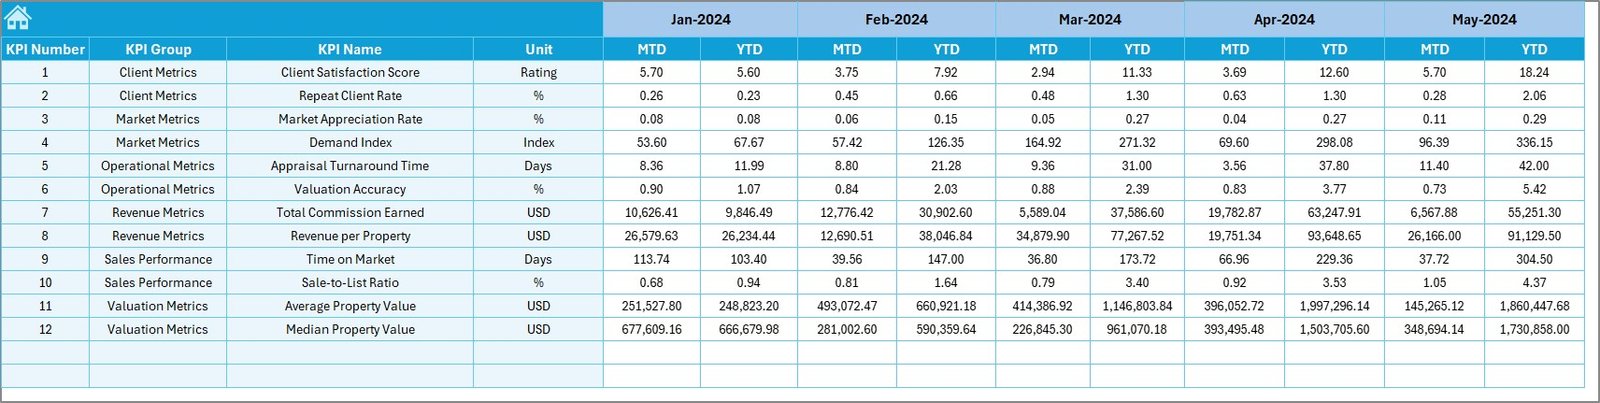
4. Actual Numbers Input Sheet – Enter Monthly Actual Numbers
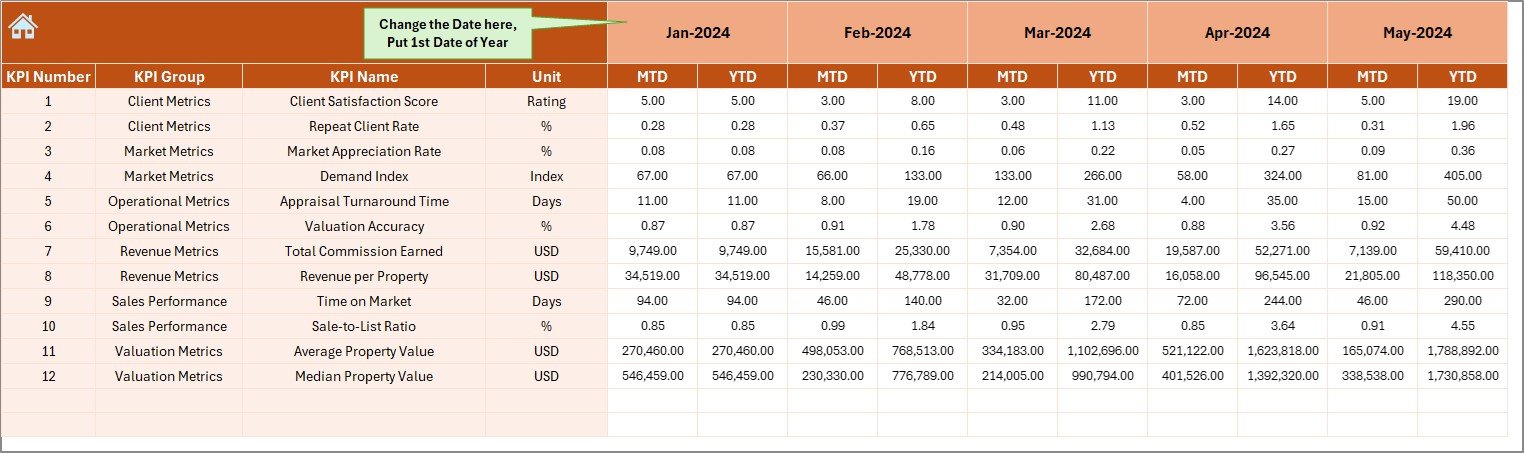
This sheet is where you enter the actual performance numbers for each KPI.
How It Works
-
Set the starting month in cell E1.
-
Enter MTD and YTD values for each KPI based on the selected month.
-
The dashboard automatically pulls values from this sheet.
This system reduces errors and keeps the calculations fully automated.
5. Target Sheet – Enter KPI Targets
Here you enter:
-
Monthly KPI targets (MTD Target)
-
Annual cumulative KPI targets (YTD Target)
Setting clear targets helps compare performance and identify gaps quickly.
6. Previous Year Numbers Sheet – Enter Last Year Data
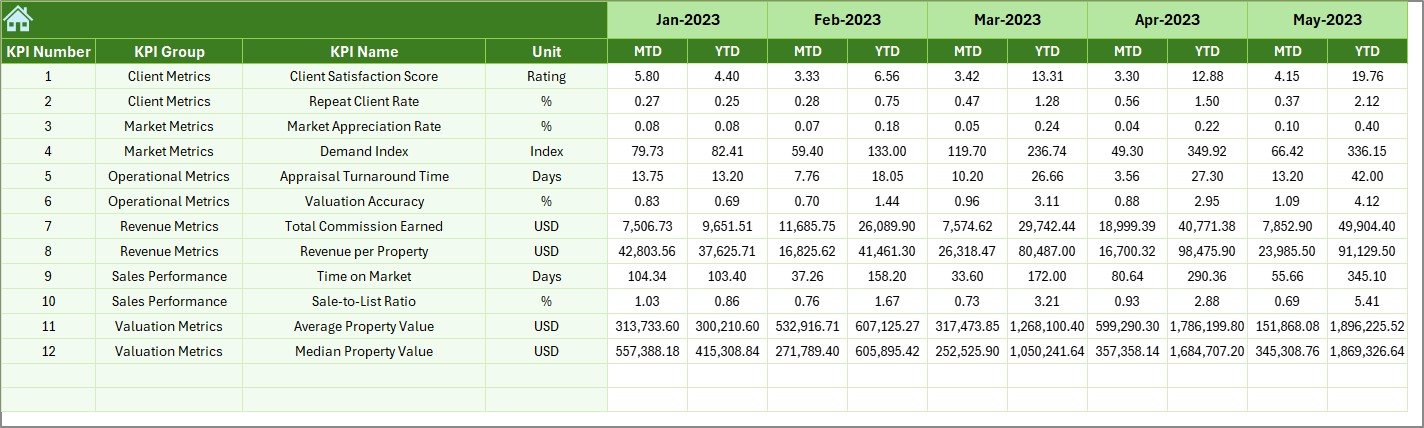
This sheet stores last year’s numbers for every KPI.
It helps compare current data with historical performance.
You understand growth, decline, stability, and improvement over time.
7. KPI Definition Sheet – Complete KPI Dictionary
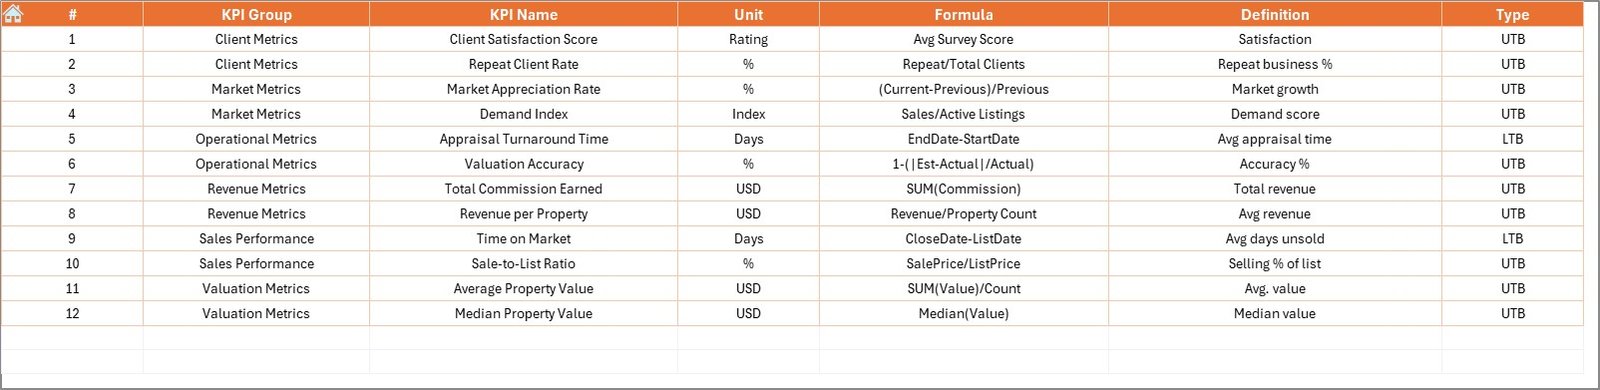
This sheet includes:
-
KPI Name
-
KPI Group
-
Unit
-
Formula
-
Short Definition
-
KPI Type (UTB or LTB)
This works as the reference library for anyone who uses the dashboard.
Which KPIs Should You Track in a Real Estate Valuation Dashboard?
Here are some of the most used valuation KPIs:
-
Market Value
-
Capitalization Rate (Cap Rate)
-
Gross Rental Yield
-
Net Rental Yield
-
Occupancy Rate
-
Vacancy Rate
-
Net Operating Income (NOI)
-
Cash Flow
-
Operating Expense Ratio
-
Price Per Square Foot
-
Maintenance Cost Ratio
-
Loan-to-Value Ratio (LTV)
These KPIs provide deep clarity on financial strength, property efficiency, and long-term valuation trends.
How Does the Real Estate Valuation KPI Dashboard Improve Decision-Making?
This dashboard improves decision-making by presenting clear insights:
1. Faster Valuation Comparisons
You compare multiple valuation KPIs across months, years, and targets in seconds.
2. Automated Insights
Excel formulas update the dashboard instantly, reducing manual work.
3. Trend Tracking
Charts show where the property performance is moving.
4. Improved Investment Planning
You understand returns, risks, and growth potential with confidence.
5. Easy Reporting
You share clean insights with investors, clients, or management teams.
6. Better Cost Management
You identify areas where expenses exceed targets and improve profitability.
Click to Purchases Real Estate Valuation KPI Dashboard in Excel
Advantages of Using a Real Estate Valuation KPI Dashboard in Excel
A dedicated section highlighting key benefits:
1. Easy to Use
The dashboard runs in Excel, so you don’t need advanced software.
2. Fully Automated
You only enter actual, target, and previous year numbers.
3. Saves Time
Reports that earlier took hours now take seconds.
4. Improves Accuracy
It removes manual errors and inconsistencies.
5. Offers Clear Visuals
Charts, cards, and trend lines make data easy to read.
6. Strengthens Decision-Making
You make confident valuation decisions based on real numbers.
7. Suitable for All Real Estate Types
Commercial, residential, retail, industrial, land, and mixed-use properties.
What Makes This Excel Dashboard Better Than Manual Reporting?
Manual Reporting Problems
-
Errors
-
Data duplication
-
Long processing time
-
Confusing formulas
-
No real-time analysis
Dashboard Advantages
-
Auto-calculations
-
Real-time visuals
-
Centralized data
-
Monthly & yearly analysis
-
Professional reporting
How to Use the Dashboard Effectively?
Follow these steps:
Step 1 – Enter Starting Month
Go to Actual Numbers Input sheet → Enter first month in cell E1.
Step 2 – Fill Actual Numbers
Enter actual MTD and YTD for each KPI.
Step 3 – Fill Targets
Enter target values in the Target sheet.
Step 4 – Enter Previous Year Values
Fill last year’s MTD/YTD values.
Step 5 – Use Dashboard Page
Select a month → View all KPIs.
Step 6 – Analyze Trends
Go to KPI Trend → Select a KPI → Study MTD/YTD trend.
Click to Purchases Real Estate Valuation KPI Dashboard in Excel
Best Practices for Using the Real Estate Valuation KPI Dashboard
1. Keep Data Clean
Update your actual, target, and PY numbers regularly.
2. Use Correct KPI Definitions
Follow the KPI dictionary to avoid confusion.
3. Update One Sheet at a Time
Never update multiple data sheets simultaneously.
4. Review Monthly Changes
Check whether KPIs improve or decline each month.
5. Monitor Trends
Always check trend charts to understand market patterns.
6. Use Conditional Arrows for Quick Decisions
Green arrows show progress; red arrows show areas of concern.
7. Make Backup Copies
Maintain a backup before making major data changes.
Conclusion
A Real Estate Valuation KPI Dashboard in Excel gives you full control over your property valuation process. It removes manual work, simplifies reporting, and delivers quick insights that support smarter decisions. With its easy navigation, automated charts, and powerful KPI tracking system, this dashboard becomes an essential tool for real estate professionals, investors, asset managers, and consultants.
When you use this dashboard consistently, you gain clarity, accuracy, and confidence in every valuation decision.
Frequently Asked Questions (FAQs)
1. What KPIs should I track for real estate valuation?
Track KPIs like market value, NOI, cap rate, rental yield, occupancy rate, and operating expense ratio.
2. Can beginners use this dashboard?
Yes. The dashboard is beginner-friendly because it uses simple Excel features and automated calculations.
3. Can I customize the KPIs?
Yes. You can add, remove, or modify KPIs in the KPI Definition sheet.
4. How often should I update the dashboard?
You should update the MTD and YTD numbers every month.
5. Can I use this for multiple properties?
Yes. You can track performance across multiple assets by adding more KPI rows.
6. Does the dashboard include trend analysis?
Yes. The trend sheet helps you compare monthly and yearly performance visually.
7. Do I need Excel expertise to use it?
No. The dashboard is designed for simplicity, and all formulas run in the background.
Click to Purchases Real Estate Valuation KPI Dashboard in Excel
Visit our YouTube channel to learn step-by-step video tutorials