In today’s competitive property market, real estate decisions depend heavily on accurate valuations, reliable KPIs, and timely insights. However, many organizations still rely on scattered spreadsheets and static reports. As a result, decision-making slows down, risks increase, and opportunities get missed. That is exactly where a Real Estate Valuation KPI Dashboard in Power BI creates real value.
A Real Estate Valuation KPI Dashboard in Power BI transforms raw valuation and performance data into clear, actionable insights. Moreover, it allows analysts, valuation teams, and leadership to monitor targets, actuals, and trends from a single interactive interface. Since the dashboard uses Excel as the data source and Power BI as the visualization layer, it combines flexibility with analytical power.
In this article, you will explore everything about the Real Estate Valuation KPI Dashboard in Power BI. You will understand how it works, why it matters, what pages it contains, and how best practices help you get the maximum return from it. Additionally, you will also learn how different stakeholders can use it to improve valuation accuracy and performance tracking.
Click to Purchases Real Estate Valuation KPI Dashboard in Power BI
What Is a Real Estate Valuation KPI Dashboard in Power BI?
A Real Estate Valuation KPI Dashboard in Power BI is a ready-to-use analytical dashboard designed specifically to track, compare, and analyze real estate valuation KPIs.
Instead of looking at individual reports for each month or property category, this dashboard brings all critical KPIs together. Consequently, users can instantly see whether valuation targets meet expectations or fall short.
The dashboard pulls structured data from Excel and converts it into dynamic visuals, KPI tables, trend charts, and drill-through reports. Moreover, Power BI ensures that the dashboard stays interactive, fast, and scalable.
Why Is a Real Estate Valuation KPI Dashboard Important?
Real estate valuation involves multiple variables such as pricing accuracy, market movement, historical comparison, and target achievement. Without a centralized dashboard, tracking these variables becomes complex and time-consuming.
Here is why this dashboard matters:
-
It centralizes all valuation KPIs in one place
-
It improves visibility across months, years, and KPI groups
-
It helps identify overperforming and underperforming KPIs quickly
-
It saves time by eliminating manual calculations
-
It supports data-driven valuation decisions
As a result, organizations gain better control over valuation accuracy and performance.
Click to Purchases Real Estate Valuation KPI Dashboard in Power BI
How Does the Real Estate Valuation KPI Dashboard in Power BI Work?
The dashboard follows a simple yet powerful workflow:
-
Data entry happens in structured Excel sheets
-
Power BI connects directly to these Excel files
-
Measures and visuals update automatically when data refreshes
-
Users interact with slicers, drill-throughs, and charts
Therefore, teams spend less time compiling data and more time analyzing insights.
What Are the Key Features of the Real Estate Valuation KPI Dashboard in Power BI?
The dashboard contains three well-structured pages, each designed to answer specific business questions.
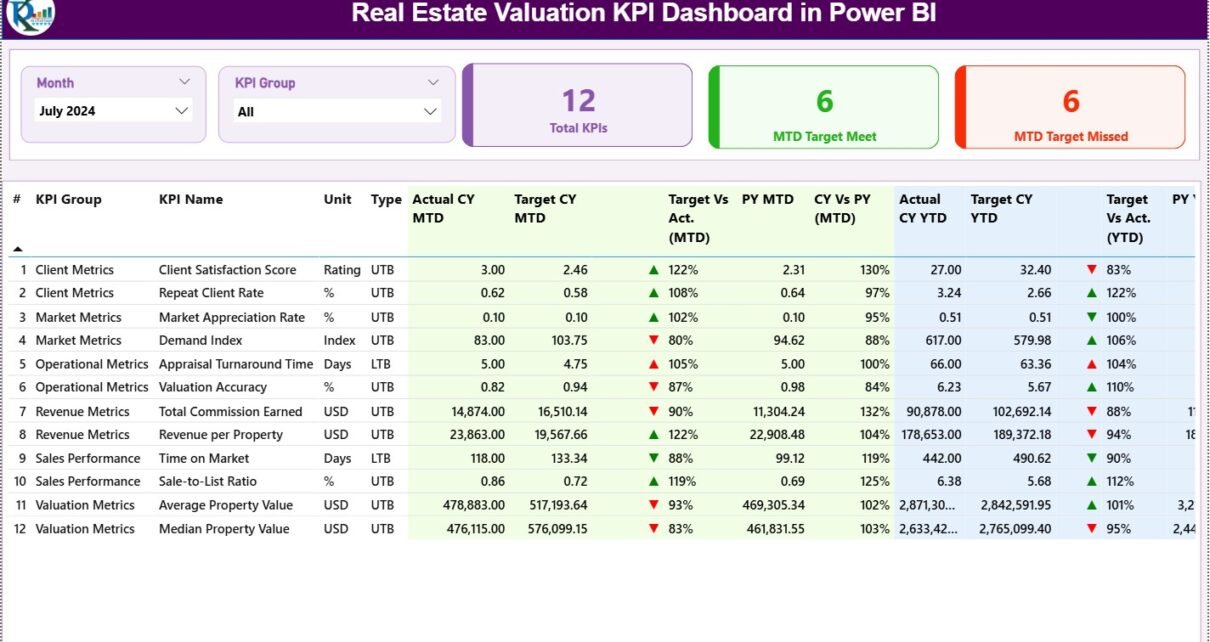
Summary Page: What Does the Overview Show?
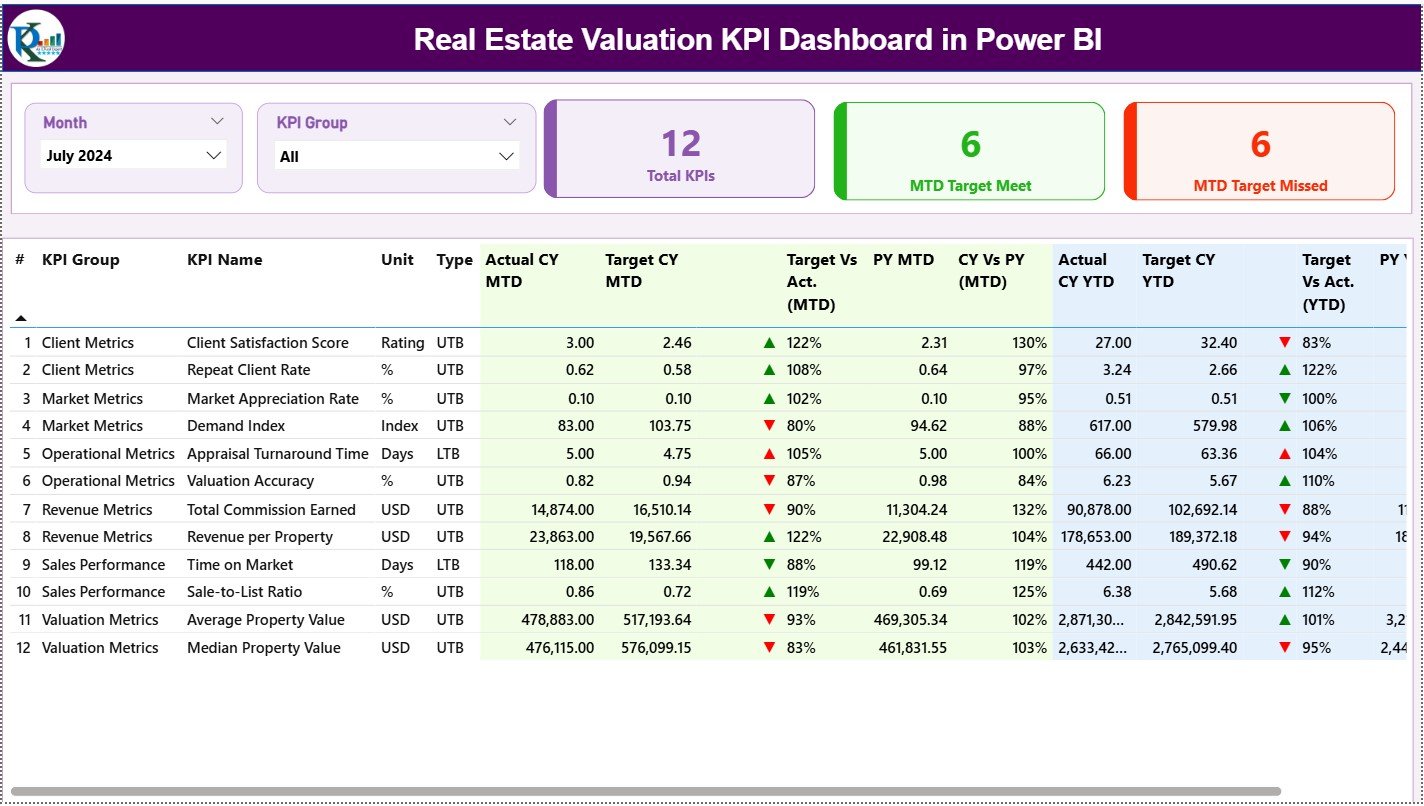
The Summary Page acts as the main entry point of the dashboard. It provides a high-level snapshot of real estate valuation performance.
Key Elements of the Summary Page
-
Month Slicer: Allows users to filter analysis by month
-
KPI Group Slicer: Enables category-wise KPI selection
KPI Cards on the Summary Page
At the top, three KPI cards instantly display:
-
Total KPIs Count
-
MTD Target Met Count
-
MTD Target Missed Count
These cards immediately show how many KPIs meet or miss targets.
Detailed KPI Performance Table
Below the cards, the dashboard shows a detailed and highly informative table.
Table Columns Explained Clearly
-
KPI Number: Sequential identifier of each KPI
-
KPI Group: Category or group of KPIs
-
KPI Name: Name of the valuation KPI
-
Unit: Measurement unit of the KPI
-
Type: KPI type (LTB – Lower the Better, UTB – Upper the Better)
Monthly Performance Metrics
-
Actual CY MTD: Current year actual month-to-date value
-
Target CY MTD: Current year target month-to-date value
-
MTD Icon: Visual indicator (▲ green or ▼ red) for target status
-
Target vs Actual (MTD): Actual ÷ Target (MTD percentage)
-
PY MTD: Previous year month-to-date value
-
CY vs PY (MTD): Current year MTD ÷ Previous year MTD
Year-to-Date Performance Metrics
-
Actual CY YTD: Current year actual YTD value
-
Target CY YTD: Current year target YTD value
-
YTD Icon: Green or red indicator for YTD target status
-
Target vs Actual (YTD): Actual ÷ Target (YTD percentage)
-
PY YTD: Previous year YTD value
-
CY vs PY (YTD): Current YTD ÷ Previous YTD
Because of this structure, users can evaluate short-term and long-term performance together.
KPI Trend Page: How Can You Analyze Valuation Trends?
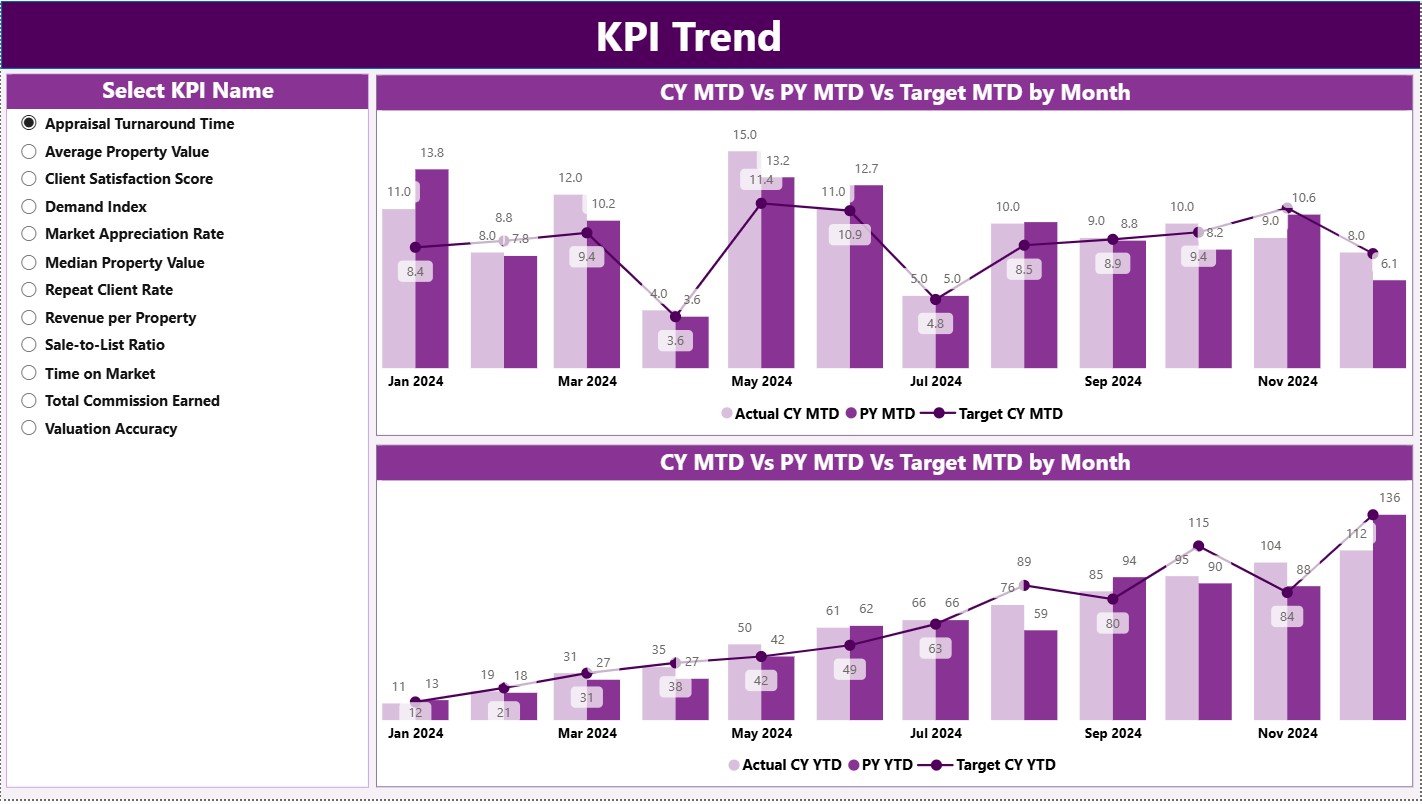
The KPI Trend Page focuses on trends and comparisons over time.
What Does This Page Show?
-
Two combo charts for MTD and YTD analysis
-
Actual values of the current year
-
Actual values of the previous year
-
Target values for benchmarking
Interactive KPI Selection
A slicer on the left allows users to select any KPI. As soon as the KPI changes, all trend visuals update instantly.
Therefore, users can easily track growth, decline, and consistency across months.
Click to Purchases Real Estate Valuation KPI Dashboard in Power BI
KPI Definition Page: Where Can You View KPI Logic?
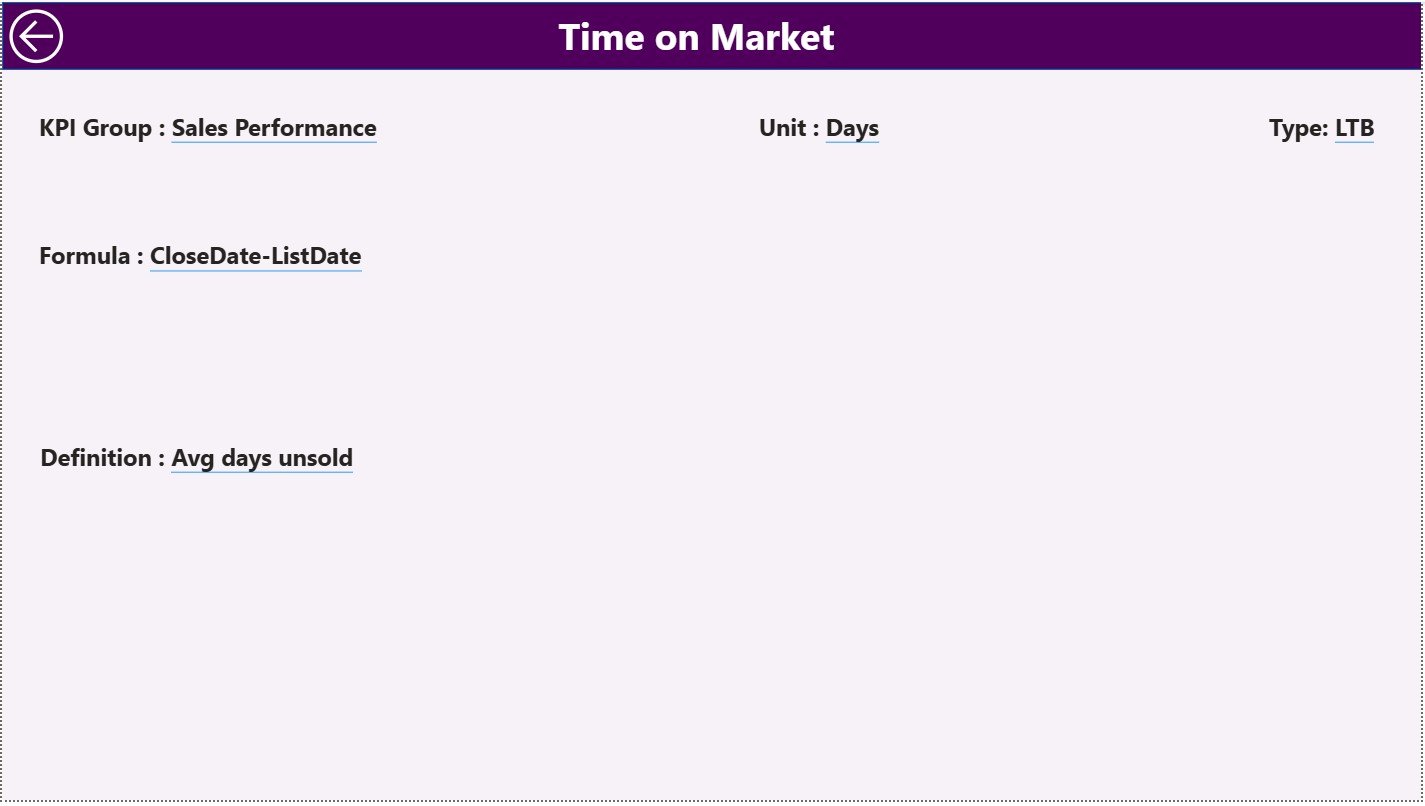
The KPI Definition Page provides clarity and transparency for KPI calculations.
Key Highlights
-
This page works as a drill-through page
-
The page remains hidden for a clean user experience
-
Users can drill through from the Summary Page
Information Available on This Page
-
KPI Formula
-
KPI Definition
-
Logical interpretation of performance
A Back button on the top-left helps users return to the Summary Page quickly.
What Excel Data Structure Does This Dashboard Use?
The dashboard uses Excel as its data source, which keeps it flexible and user-friendly.
Excel Workbook Structure
The Excel file contains three mandatory worksheets.
Input_Actual Sheet: How Do You Store Actual Values?
This sheet records real performance data.
Required Columns
-
KPI Name
-
Month (use the first date of the month)
-
MTD Value
-
YTD Value
Users only need to update actual numbers monthly.
Input_Target Sheet: How Do You Maintain Targets?
This sheet stores planned or benchmark values.
Required Columns
-
KPI Name
-
Month (first date of month)
-
MTD Target
-
YTD Target
Since targets remain controlled, comparisons stay reliable.
KPI Definition Sheet: Why Is This Sheet Important?
This sheet defines KPI logic and classification.
Required Columns
-
KPI Number
-
KPI Group
-
KPI Name
-
Unit
-
Formula
-
Definition
-
Type (LTB or UTB)
As a result, KPI calculations remain consistent and transparent.
Click to Purchases Real Estate Valuation KPI Dashboard in Power BI
Advantages of Real Estate Valuation KPI Dashboard in Power BI
Using this dashboard offers multiple operational and strategic benefits.
✅ Centralized KPI monitoring in one dashboard
✅ Easy comparison between Actual, Target, and Previous Year
✅ Clear MTD and YTD performance visibility
✅ Interactive filtering and drill-through features
✅ Faster decision-making with visual indicators
✅ Reduced dependency on manual reporting
Because of these advantages, valuation teams work more efficiently.
Best Practices for the Real Estate Valuation KPI Dashboard in Power BI
Following best practices ensures long-term success.
-
Keep KPI definitions clear and standardized
-
Use consistent units of measurement
-
Update Excel data regularly to maintain accuracy
-
Limit KPIs to relevant and actionable metrics
-
Monitor both MTD and YTD performance together
-
Use color indicators consistently for clarity
When teams follow these practices, insights become more reliable.
Common Mistakes to Avoid While Using the Dashboard
Despite its simplicity, some mistakes reduce dashboard effectiveness.
-
Avoid mixing different date formats in Excel
-
Do not leave KPI definitions incomplete
-
Do not overload the dashboard with too many KPIs
-
Avoid inconsistent target-setting methods
-
Do not skip previous-year comparison
By avoiding these issues, users maintain dashboard reliability.
Click to Purchases Real Estate Valuation KPI Dashboard in Power BI
Who Can Use the Real Estate Valuation KPI Dashboard?
This dashboard supports multiple user roles.
-
Real Estate Valuation Analysts
-
Property Managers
-
Investment Analysts
-
Finance Teams
-
Strategy and Planning Teams
-
Senior Management and Leadership
Since the dashboard stays intuitive, both technical and non-technical users can use it comfortably.
Conclusion
A Real Estate Valuation KPI Dashboard in Power BI simplifies complex valuation performance tracking into one unified system. It enhances transparency, improves accuracy, and supports data-driven decisions.
By combining structured Excel inputs with powerful Power BI visuals, organizations gain clarity over targets, actuals, and historical trends. As a result, valuation teams can act faster, reduce risk, and improve performance continuously.
If your organization values clear insights, consistent KPIs, and smarter decisions, this dashboard becomes an essential analytical asset.
Frequently Asked Questions (FAQs)
What is the purpose of a Real Estate Valuation KPI Dashboard?
The dashboard helps track valuation KPIs against targets and past performance in a visual and interactive way.
Can I update data without modifying Power BI visuals?
Yes. You only need to update the Excel input sheets and refresh Power BI.
Does the dashboard support MTD and YTD analysis?
Yes. The dashboard provides both MTD and YTD Actual, Target, and comparison metrics.
Can I add new KPIs to the dashboard?
Yes. You can add new KPIs by updating the KPI Definition, Actual, and Target sheets.
Is this dashboard suitable for large portfolios?
Yes. Power BI handles large datasets efficiently when the Excel structure remains clean.
Does the dashboard require advanced technical skills?
No. Basic Excel knowledge and Power BI navigation skills are sufficient.
Click to Purchases Real Estate Valuation KPI Dashboard in Power BI
Visit our YouTube channel to learn step-by-step video tutorials