Effective waste management and recycling are essential for creating a sustainable future. However, without proper performance tracking, organizations often fail to measure the true impact of their recycling programs. The Recycling KPI Scorecard in Excel solves that problem by providing an easy-to-use, data-driven tool to monitor, analyze, and improve recycling performance.
In this detailed guide, we’ll explore what the scorecard is, its structure, how it works, and how it helps organizations enhance environmental performance through smart data visualization and decision-making.
Click to Purchases Recycling KPI Scorecard in Excel
What Is a Recycling KPI Scorecard in Excel?
A Recycling KPI Scorecard is a structured Excel-based performance monitoring tool that tracks the key performance indicators (KPIs) of recycling and waste management operations.
It allows sustainability managers, environmental teams, and facility administrators to:
-
Monitor waste collection and recycling progress.
-
Compare actual results with targets.
-
Identify inefficiencies in the recycling process.
-
Report sustainability metrics to stakeholders.
This scorecard converts raw data into meaningful insights, enabling teams to make informed decisions that improve environmental outcomes and cost efficiency.
Why Use Excel for Recycling KPI Tracking?
Excel is widely accessible and powerful enough to handle complex data analysis. It provides:
-
Flexibility: Customize the layout and formulas as needed.
-
Affordability: No need for additional software licenses.
-
Automation: Use formulas and conditional formatting to update KPIs instantly.
-
Visualization: Create charts and dashboards to represent trends visually.
-
Collaboration: Share and update reports easily across teams.
By using Excel, even small organizations can build a professional-grade sustainability scorecard without expensive tools.
Click to Purchases Recycling KPI Scorecard in Excel
Key Features of the Recycling KPI Scorecard
The Recycling KPI Scorecard in Excel includes four powerful worksheet tabs, each serving a specific purpose in data entry, tracking, and visualization.
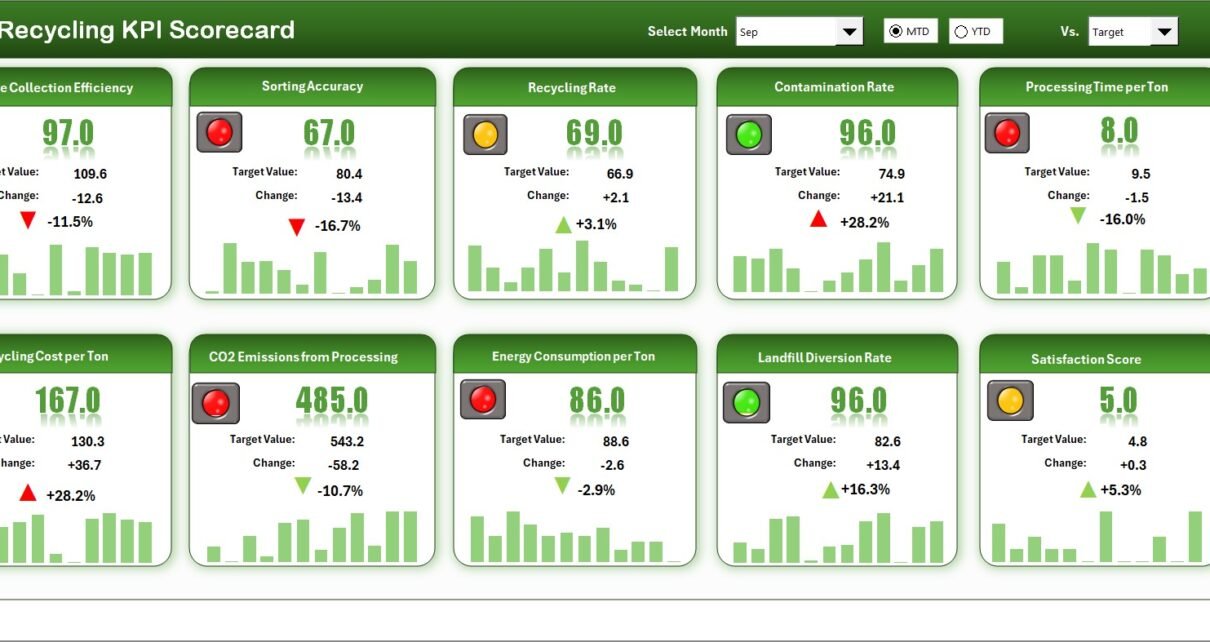
1. Scorecard Sheet – The Performance Dashboard
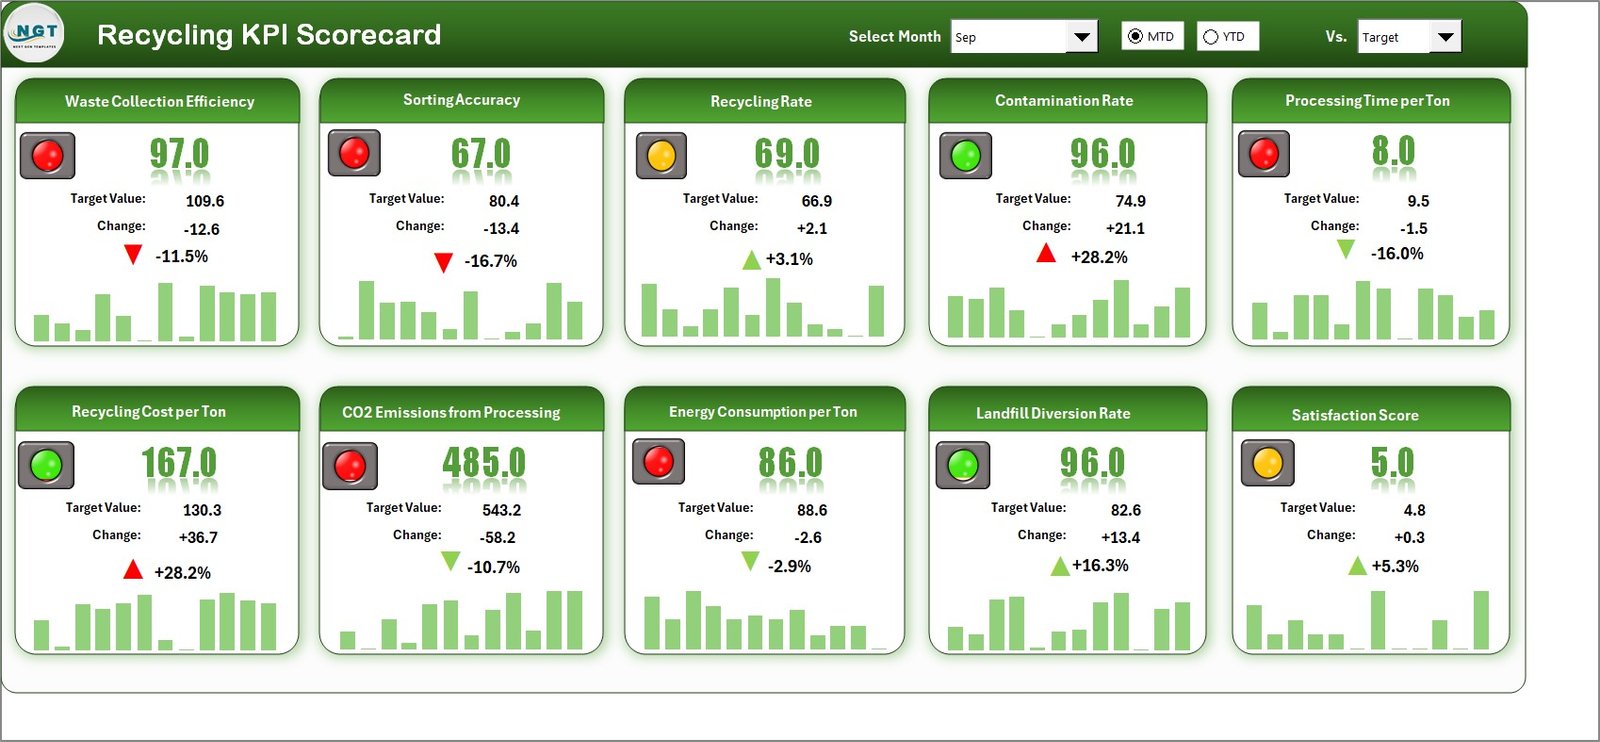
The Scorecard Sheet is the primary dashboard where users can review performance metrics at a glance.
Key Highlights:
-
Dropdown Menus: Select the Month and choose between MTD (Month-to-Date) or YTD (Year-to-Date) views.
-
Actual vs Target Comparison: See how the current recycling performance stacks up against planned goals.
-
Color Indicators: Conditional formatting instantly highlights under- or over-performance using green, yellow, or red colors.
-
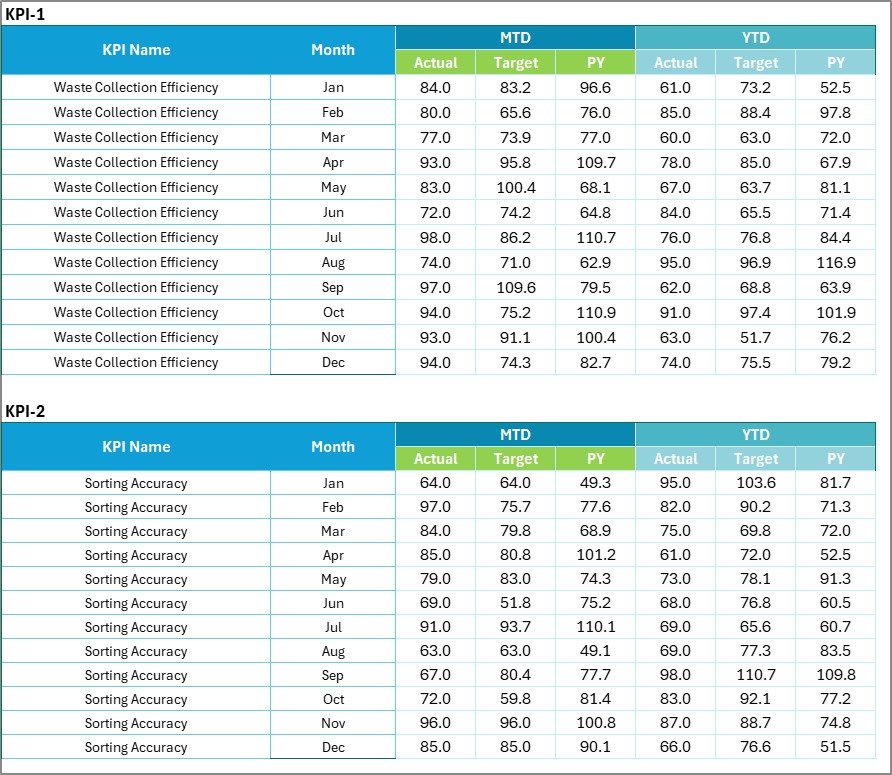
Comprehensive KPI Display: Each KPI shows actual, target, and previous year values for both MTD and YTD analysis.
This sheet acts as a control center — a quick view for sustainability teams to track performance at any given time.
2. KPI Trend Sheet – Monitoring Progress Over Time
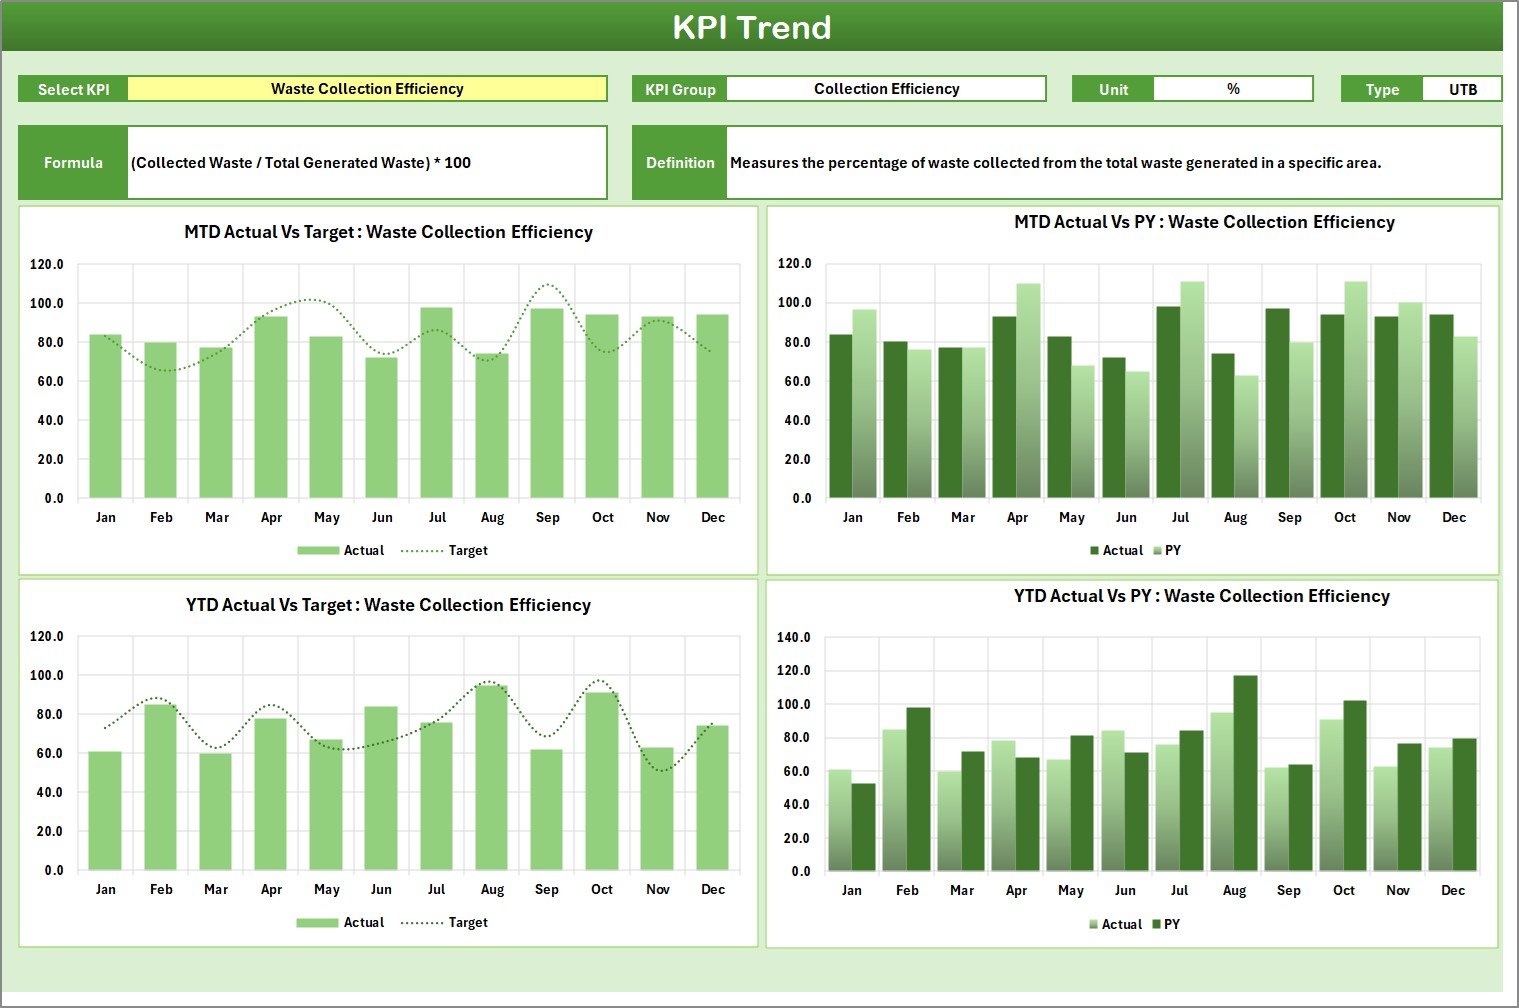
The KPI Trend Sheet allows detailed tracking of individual KPI trends throughout the year. It gives a deeper understanding of progress and changes.
Core Components:
-
Dropdown Menu (Cell C3): Select a KPI to visualize.
-
KPI Metadata: Displays KPI Group, Unit, Formula, and Type — UTB (Upper the Better) or LTB (Lower the Better).
-
Dynamic Trend Charts: View MTD and YTD performance through line and bar charts comparing Actual, Target, and Previous Year results.
This helps identify long-term improvements, seasonal variations, or areas that need attention.
3. Input Data Sheet – Data Entry and Management
The Input Data Sheet stores the actual KPI data that powers the scorecard and charts.
How It Works:
-
Enter the Actual, Target, and Previous Year values for each KPI every month.
-
The data automatically updates other sheets, maintaining real-time accuracy.
-
You can easily add or remove KPIs without breaking formulas.
This sheet keeps your performance database clean, consistent, and ready for analysis.
4. KPI Definition Sheet – The Reference Hub
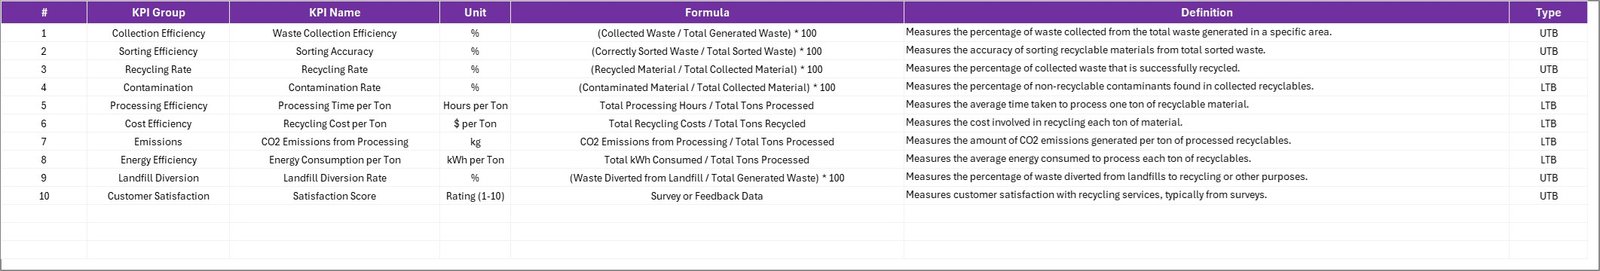
The KPI Definition Sheet provides clear definitions and calculation logic for every KPI.
Key Columns:
-
KPI Name – The indicator being measured.
-
KPI Group – The broader category (e.g., Waste Collection, Energy Usage).
-
Unit – Measurement unit such as %, Kg, or Ton.
-
Formula – Calculation logic for the KPI.
-
Definition – Brief explanation of the metric.
This sheet ensures every team member interprets each KPI correctly and maintains standardization.
Click to Purchases Recycling KPI Scorecard in Excel
How to Use the Recycling KPI Scorecard in Excel
Here’s how to set up and use this powerful template effectively:
-
Open the Excel Template.
Start with the pre-designed scorecard file. -
Customize the KPI Definition Sheet.
Enter your organization’s KPIs, units, and formulas. -
Enter Data in the Input Sheet.
Fill monthly Actual, Target, and Previous Year data. -
Navigate to the Scorecard Sheet.
Choose the Month and Period (MTD / YTD) to analyze. -
Use the KPI Trend Sheet.
Select a KPI to view trend charts and patterns. -
Interpret the Results.
Identify which areas perform well and which need improvement. -
Update Regularly.
Add fresh data monthly to keep the analysis current.
Advantages of Using the Recycling KPI Scorecard
Implementing this Excel-based scorecard brings numerous benefits to sustainability teams and recycling managers:
♻️ 1. Centralized Data Management
All performance data is stored in one structured workbook, making it easy to review and update.
♻️ 2. Real-Time Performance Tracking
Dropdown filters and automatic formulas instantly display up-to-date progress.
♻️ 3. Visual Insights
Color coding and trend charts make performance easy to interpret at a glance.
♻️ 4. Accountability and Transparency
Each KPI can be assigned to responsible departments or individuals.
♻️ 5. Cost Efficiency
No need for expensive BI tools — Excel provides everything needed for analysis.
♻️ 6. Environmental Impact Reporting
Quickly demonstrate measurable sustainability outcomes to management and stakeholders.
How the Scorecard Supports Sustainability Goals
Recycling efforts contribute to multiple environmental objectives such as waste reduction, emission control, and energy conservation.
The KPI scorecard helps organizations:
-
Measure progress toward sustainability goals.
-
Report environmental impact in numerical terms.
-
Motivate teams through transparent performance tracking.
-
Make continuous improvements to recycling operations.
By using this tool, recycling performance becomes measurable, actionable, and transparent.
Best Practices for the Recycling KPI Scorecard in Excel
To ensure your scorecard delivers accurate and insightful results, follow these best practices:
✅ 1. Define Clear and Actionable KPIs
Choose indicators that are specific, measurable, and directly influence operational efficiency.
✅ 2. Maintain Data Consistency
Use consistent units and formats to avoid discrepancies in charts and calculations.
✅ 3. Set Realistic Targets
Base targets on historical data and achievable performance benchmarks.
✅ 4. Update Monthly
Regular updates ensure accuracy and allow early detection of performance gaps.
✅ 5. Protect Formulas
Lock formulas and sensitive cells to prevent accidental overwriting.
✅ 6. Visualize Data Clearly
Use Excel’s conditional formatting, sparklines, and charts for better readability.
✅ 7. Review Trends Quarterly
Analyze YTD charts every quarter to identify progress and seasonal patterns.
✅ 8. Backup Files
Maintain monthly backups to preserve historical data for long-term analysis.
Customization Ideas for Advanced Users
You can enhance the template further by:
-
Adding department-wise filters for comparison.
-
Using icons (✔ / ✘) for quick visual cues.
-
Inserting progress bars using conditional formatting.
-
Building pivot tables for multi-year comparisons.
-
Integrating the scorecard with Power BI for advanced visualization.
These upgrades make the scorecard suitable for organizations of any size or complexity.
Common Mistakes to Avoid
Be cautious of these frequent errors:
-
Using inconsistent date formats across sheets.
-
Forgetting to update target data monthly.
-
Omitting definitions for new KPIs.
-
Ignoring the trend data while assessing results.
-
Modifying formulas without documentation.
Avoiding these mistakes ensures the integrity and reliability of your analysis.
Conclusion
The Recycling KPI Scorecard in Excel is a comprehensive, practical, and accessible tool for organizations that want to measure their sustainability performance effectively.
It transforms complex recycling data into easy-to-understand visuals and metrics that help teams reduce waste, save costs, and boost environmental responsibility.
Whether you’re managing a municipal recycling program or an in-house corporate sustainability initiative, this Excel scorecard provides everything you need for real-time performance tracking and continuous improvement.
Start using the Recycling KPI Scorecard in Excel today and make your recycling efforts measurable, impactful, and results-driven.
Click to Purchases Recycling KPI Scorecard in Excel
Frequently Asked Questions (FAQs)
1. What is a Recycling KPI Scorecard?
It’s an Excel-based tool that tracks and analyzes key metrics related to recycling operations, helping organizations monitor efficiency and environmental impact.
2. Who can use this scorecard?
Environmental managers, sustainability officers, facility teams, and municipal authorities can use it to manage and evaluate recycling performance.
3. What type of KPIs can be tracked?
KPIs such as recycling rate, waste diverted from landfill, cost per ton, and CO₂ emissions saved can be tracked effectively.
4. Can I customize the KPIs?
Yes, the template is fully customizable — you can add new KPIs or modify existing ones to fit your operations.
5. How often should I update the scorecard?
It’s best to update it monthly to keep your MTD and YTD trends accurate.
6. Is any advanced Excel knowledge required?
No, the template is beginner-friendly. Basic Excel skills are enough to use it efficiently.
7. Can this be linked with Power BI?
Yes, you can connect it to Power BI to create interactive dashboards for advanced data visualization.
Click to Purchases Recycling KPI Scorecard in Excel
Visit our YouTube channel to learn step-by-step video tutorials