Managing contracts in the refinery industry demands accuracy, consistency, and continuous monitoring. Because refinery contracts involve high values, long durations, strict compliance requirements, and multiple stakeholders, even a small deviation can create financial and operational risks. Therefore, refinery teams need a structured system that tracks performance, compares targets, and highlights risks in real time.
That is exactly why a Refinery Contract KPI Dashboard in Excel becomes a powerful and practical solution.
In this detailed and SEO-friendly article, you will learn what a Refinery Contract KPI Dashboard in Excel is, why refineries need it, how it works, its worksheet structure, key features, advantages, best practices, and frequently asked questions. By the end, you will clearly understand how this Excel dashboard helps refinery contract, finance, and management teams gain control, visibility, and confidence in contract decisions.
Click to buy Refinery Contract KPI Dashboard in Excel
What Is a Refinery Contract KPI Dashboard in Excel?
A Refinery Contract KPI Dashboard in Excel is a structured and interactive Excel-based reporting tool designed to track, analyze, and monitor key performance indicators related to refinery contracts.
Instead of working with scattered spreadsheets and manual reports, this dashboard consolidates all contract KPIs into one centralized Excel file. As a result, refinery contract managers, finance teams, procurement teams, and leadership gain real-time visibility into contract performance.
Moreover, because the dashboard runs on Microsoft Excel, teams do not need expensive BI tools or complex software. They can simply enter data, select a month, and instantly see updated insights.
Why Do Refineries Need a Contract KPI Dashboard?
Refinery contracts cover areas such as maintenance services, logistics, supply agreements, EPC contracts, and vendor services. Therefore, tracking contract performance manually becomes time-consuming and risky.
A Refinery Contract KPI Dashboard in Excel helps because:
- It centralizes all contract KPIs in one place
- It reduces manual reporting errors
- It improves performance monitoring and accountability
- It highlights risks before they escalate
- It supports data-driven decisions
As a result, refineries move from reactive contract management to proactive performance control.
How Does a Refinery Contract KPI Dashboard in Excel Work?
The dashboard works through a simple input-process-output structure.
First, users enter actual numbers, target values, and previous year data into dedicated input sheets.
Next, Excel formulas process the data automatically.
Finally, the dashboard displays KPIs, comparisons, and trends visually.
Because everything connects through formulas and dropdowns, users can analyze both monthly (MTD) and year-to-date (YTD) performance instantly.
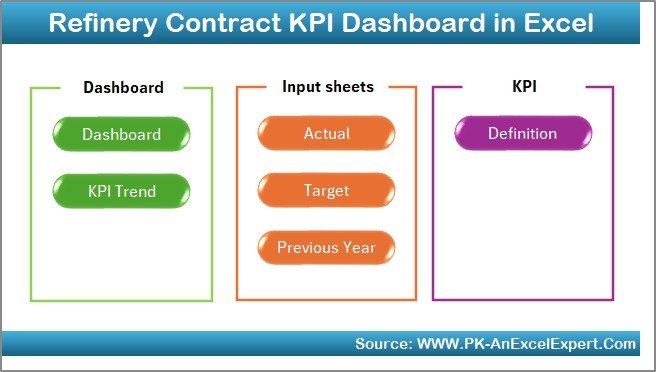
What Are the Key Features of a Refinery Contract KPI Dashboard in Excel?
This dashboard includes seven well-structured worksheets, each designed for a specific purpose. Together, they form a complete KPI tracking system.
the Summary Page
The Summary Page acts as the index of the dashboard.
Key Highlights of the Summary Page
- It provides navigation buttons for easy movement
- It includes six buttons that jump directly to relevant sheets
- It saves time by eliminating manual scrolling
- It improves usability for all users
Because of this structure, even non-technical users can navigate the dashboard confidently.
Click to buy Refinery Contract KPI Dashboard in Excel
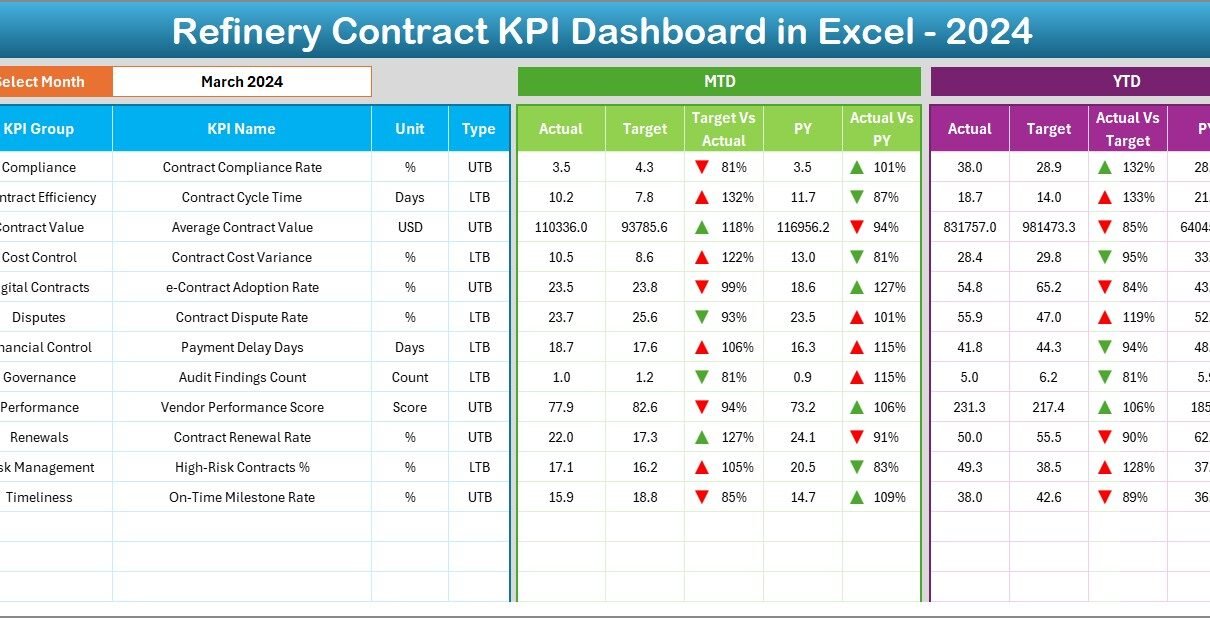
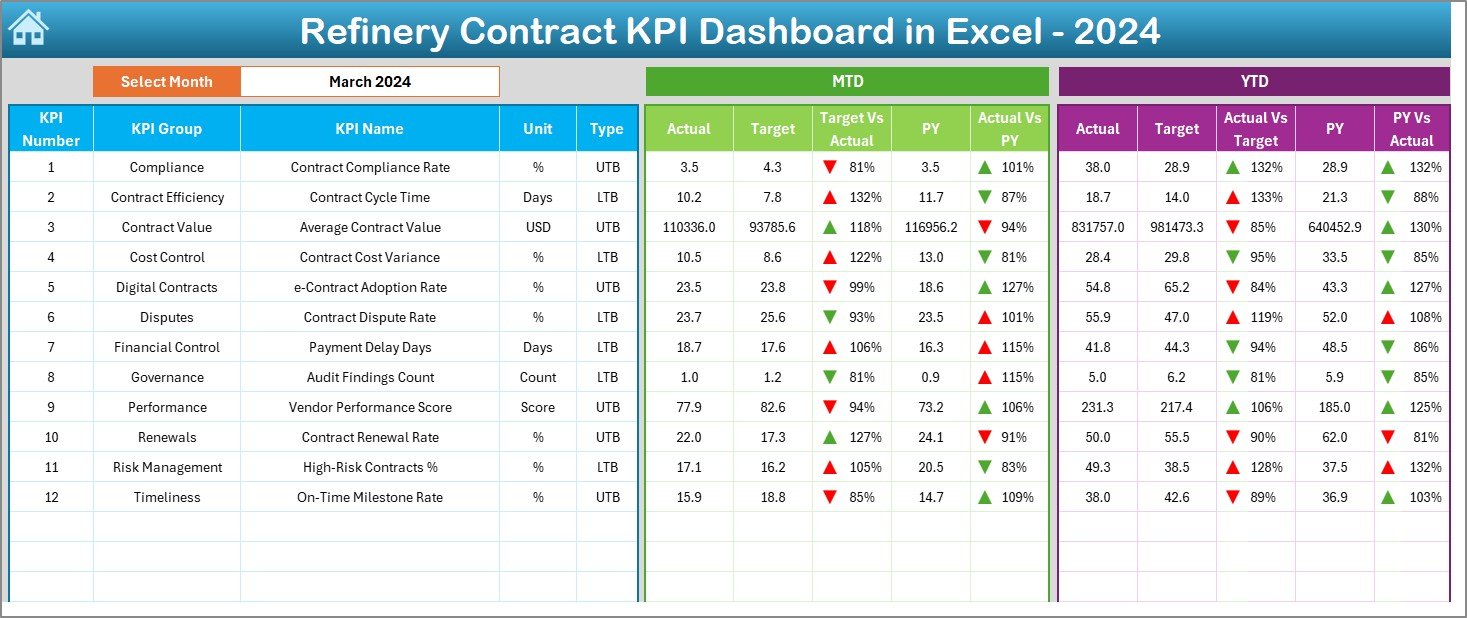
Dashboard Sheet
The Dashboard Sheet is the core analytical page.
Main Features of the Dashboard Sheet
- It displays all contract KPIs in one view
- A month selector at cell D3 controls the entire dashboard
- All KPI values update automatically when the month changes
Click to buy Refinery Contract KPI Dashboard in Excel
KPI Metrics Displayed on the Dashboard
The dashboard shows both MTD (Month-to-Date) and YTD (Year-to-Date) values, including:
- Actual
- Target
- Previous Year
In addition, it calculates:
- Target vs Actual variance
- Previous Year vs Actual variance
These variances use conditional formatting with up and down arrows, which helps users quickly identify performance gaps.
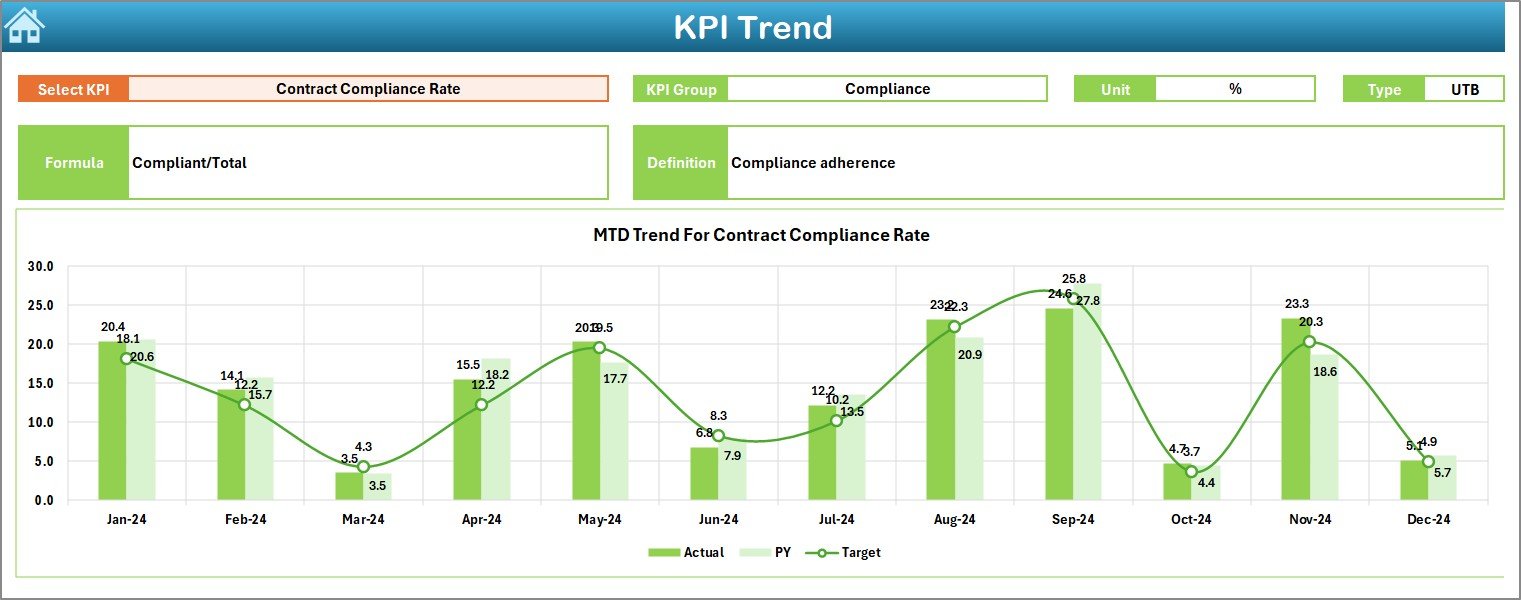
Trend Sheet
What Can You Do on the Trend Sheet?
- Select a KPI from the dropdown at cell C3
- View KPI Group, Unit, Type, Formula, and Definition
- Analyze MTD and YTD trends visually
Charts Available on the Trend Sheet
- Actual vs Target trend
- Actual vs Previous Year trend
- MTD trend comparison
- YTD trend comparison
Because trends reveal patterns over time, this sheet supports strategic decision-making.
Click to buy Refinery Contract KPI Dashboard in Excel
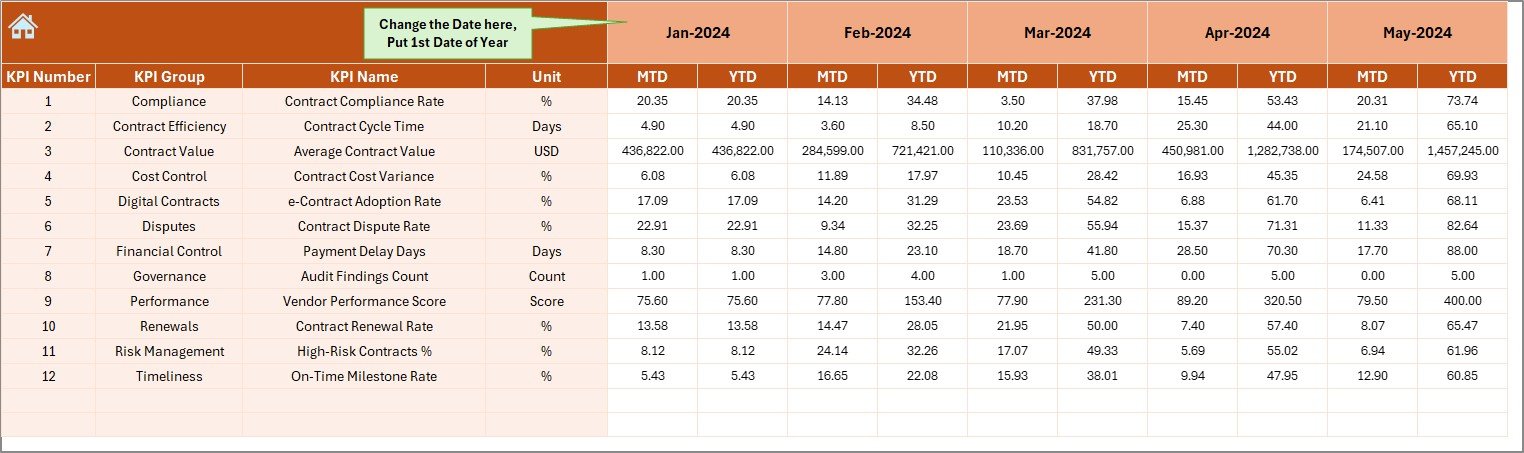
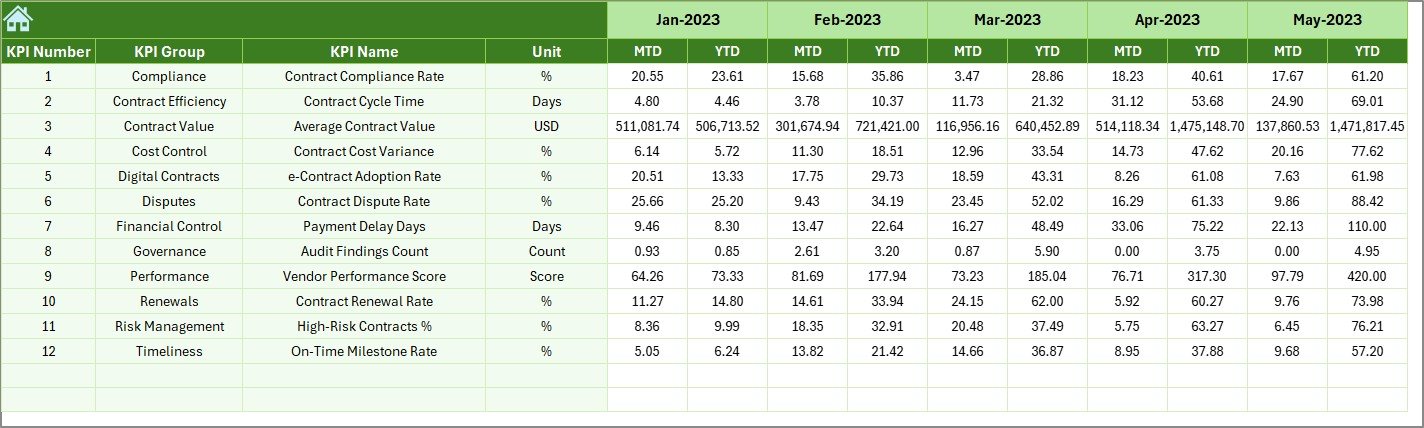
Actual Numbers Input Sheet
The Actual Numbers Input Sheet serves as the main data entry area.
How This Sheet Works
- Enter MTD and YTD actual values for each KPI
- Change the month from cell E1
- Set the first month of the year once
- Maintain clean and structured data
Because the dashboard connects directly to this sheet, every update reflects instantly across all reports.
Click to buy Refinery Contract KPI Dashboard in Excel
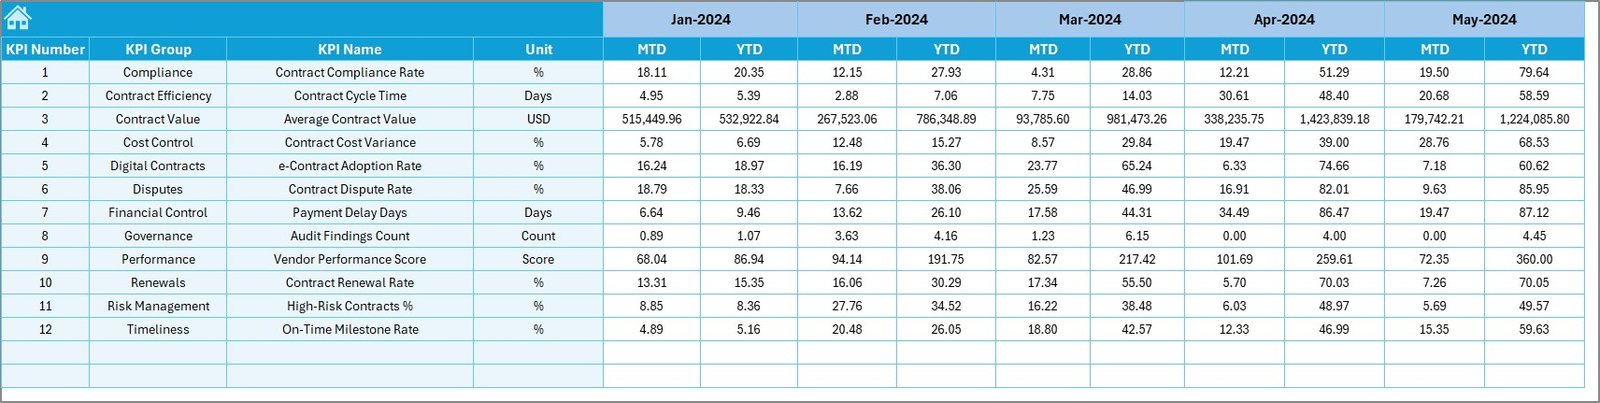
the Target Sheet
The Target Sheet defines performance expectations.
Key Functions of the Target Sheet
- Enter monthly MTD targets
- Enter YTD targets
- Align contract goals with organizational objectives
- Enable variance analysis
Since targets drive accountability, this sheet plays a critical role in performance evaluation.
Click to buy Refinery Contract KPI Dashboard in Excel
Previous Year Number Sheet
The Previous Year Number Sheet supports historical comparison.
Benefits of This Sheet
- Enter last year’s MTD and YTD values
- Compare current performance with historical benchmarks
- Identify growth, decline, or stagnation
This comparison helps refineries understand whether contract performance improves over time.
Click to buy Refinery Contract KPI Dashboard in Excel
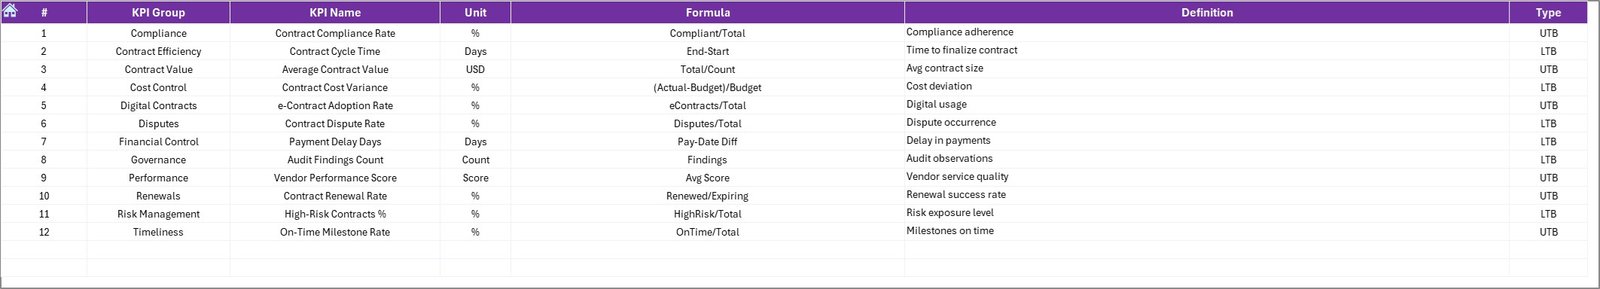
KPI Definition Sheet
The KPI Definition Sheet acts as a KPI dictionary.
Information Captured in This Sheet
- KPI Name
- KPI Group
- Unit of Measurement
- KPI Formula
- KPI Definition
Because everyone refers to the same definitions, misunderstandings reduce and reporting consistency improves.
Click to buy Refinery Contract KPI Dashboard in Excel
What Types of KPIs Can You Track in a Refinery Contract KPI Dashboard?
You can track a wide range of contract-related KPIs, such as:
- Contract Value Utilization %
- Cost Variance %
- Payment Compliance Rate
- Contract Completion Rate
- Vendor Performance Score
- Change Order Frequency
- Contract Delay Days
- Savings Achieved vs Contract Value
Therefore, the dashboard remains flexible and scalable.
Advantages of a Refinery Contract KPI Dashboard in Excel
Using this dashboard offers multiple advantages for refinery organizations.
Key Advantages
- Centralized contract performance tracking
- Real-time KPI visibility
- Easy month-wise and year-wise comparison
- No dependency on complex BI tools
- Improved decision-making speed
- Reduced reporting effort
- Clear accountability across teams
As a result, refinery contract management becomes structured, transparent, and efficient.
Who Can Benefit from a Refinery Contract KPI Dashboard in Excel?
This dashboard benefits multiple roles within a refinery.
Key Users
- Contract Managers
- Procurement Teams
- Finance Teams
- Project Managers
- Operations Managers
- Senior Leadership
Because the dashboard stays simple yet powerful, it suits both operational and strategic users.
Best Practices for the Refinery Contract KPI Dashboard in Excel
To maximize value, teams should follow proven best practices.
Best Practices You Should Follow
- Update actual data regularly
- Set realistic and measurable targets
- Maintain clear KPI definitions
- Review trends monthly, not yearly
- Use variance indicators for quick decisions
- Limit KPIs to what truly matters
- Train users on dashboard navigation
When teams follow these practices, the dashboard delivers consistent insights.
How Does This Dashboard Improve Contract Governance?
Strong contract governance depends on visibility, control, and accountability.
This dashboard improves governance by:
- Tracking performance against targets
- Highlighting risks early
- Supporting audits with structured data
- Aligning contract goals with business strategy
Therefore, management gains confidence in contract oversight.
How Does the Dashboard Support Data-Driven Decisions?
Because the dashboard combines actuals, targets, and historical data, it enables informed decisions.
For example:
- Managers can identify underperforming contracts
- Finance teams can control cost overruns
- Leadership can prioritize corrective actions
As a result, decisions rely on facts, not assumptions.
Conclusion: Why Is a Refinery Contract KPI Dashboard in Excel Essential?
A Refinery Contract KPI Dashboard in Excel transforms complex contract data into clear, actionable insights. Instead of struggling with disconnected spreadsheets, refinery teams gain a centralized, structured, and visual reporting system.
Because the dashboard tracks MTD, YTD, targets, and historical performance, it supports better planning, stronger control, and improved contract outcomes. Moreover, its Excel-based design keeps it affordable, flexible, and easy to use.
In today’s competitive refinery environment, this dashboard is not just helpful—it is essential.
Frequently Asked Questions (FAQs)
What is a Refinery Contract KPI Dashboard in Excel?
A Refinery Contract KPI Dashboard in Excel is an interactive reporting tool that tracks and analyzes refinery contract performance using KPIs, targets, and trends.
Can I customize KPIs in this dashboard?
Yes, you can easily add, remove, or modify KPIs through the KPI Definition Sheet without changing the dashboard structure.
Do I need advanced Excel skills to use this dashboard?
No, basic Excel knowledge is enough. The dashboard uses dropdowns, formulas, and simple navigation buttons.
How often should I update the data?
You should update actual and target data monthly to keep insights accurate and relevant.
Can this dashboard handle multiple years?
Yes, you can extend the data structure to track multiple years by duplicating input sheets or adding year filters.
Is this dashboard suitable for audits?
Yes, because it maintains structured historical data, it supports internal reviews and audits effectively.
Visit our YouTube channel to learn step-by-step video tutorials
Watch the step-by-step video tutorial: