Humanitarian organizations work under pressure. They manage limited funds. They handle urgent needs. Moreover, they must report progress to donors, partners, and governments. However, without proper tracking, teams struggle to measure real impact.
So, how do you track refugee assistance programs clearly and confidently?
The answer is simple.
You need a Refugee Support KPI Dashboard in Excel.
In this detailed guide, you will learn:
-
What a Refugee Support KPI Dashboard in Excel is
-
Why NGOs and agencies need it
-
Complete explanation of all 7 worksheets
-
Key KPIs you should track
-
Advantages of Refugee Support KPI Dashboard in Excel
-
Best Practices for the Refugee Support KPI Dashboard
-
Frequently Asked Questions with Answers
Let us explore everything step by step.
Click to Purchases Refugee Support KPI Dashboard in Excel
What Is a Refugee Support KPI Dashboard in Excel?
A Refugee Support KPI Dashboard in Excel is a ready-to-use performance tracking tool designed for humanitarian organizations, NGOs, and relief agencies. It helps teams monitor refugee assistance programs using clear Key Performance Indicators (KPIs).
Instead of using scattered sheets and manual reports, this dashboard centralizes:
-
Monthly program data
-
Target vs actual comparison
-
Previous year comparisons
-
Year-to-date progress
-
Trend analysis
As a result, teams make faster decisions. Moreover, they improve accountability. Most importantly, they measure real impact.
Why Do Organizations Need a Refugee Support KPI Dashboard?
Refugee support programs include multiple activities. For example:
-
Food distribution
-
Shelter assistance
-
Healthcare services
-
Education programs
-
Employment support
-
Legal assistance
Therefore, teams must track performance across different categories. However, manual tracking creates confusion.
Here is why organizations need this dashboard:
-
They can monitor monthly performance instantly
-
They can compare targets with actual numbers
-
They can analyze year-to-date progress
-
They can present structured reports to donors
-
They can identify underperforming programs early
Consequently, leadership makes data-driven decisions instead of relying on assumptions.
What Are the Key Features of the Refugee Support KPI Dashboard in Excel?
This ready-to-use template includes 7 structured worksheets. Each sheet plays an important role. Let us explore them in detail.
1️⃣ What Is the Purpose of the Home Sheet?
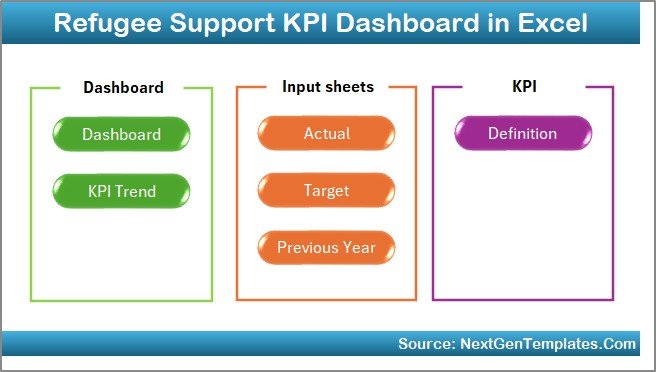
The Home Sheet acts as an index page.
Here, you will find:
-
6 navigation buttons
-
Easy jump links to respective sheets
-
Clean layout for smooth navigation
Because of this structure, users move between sheets quickly. Moreover, new team members understand the flow easily.
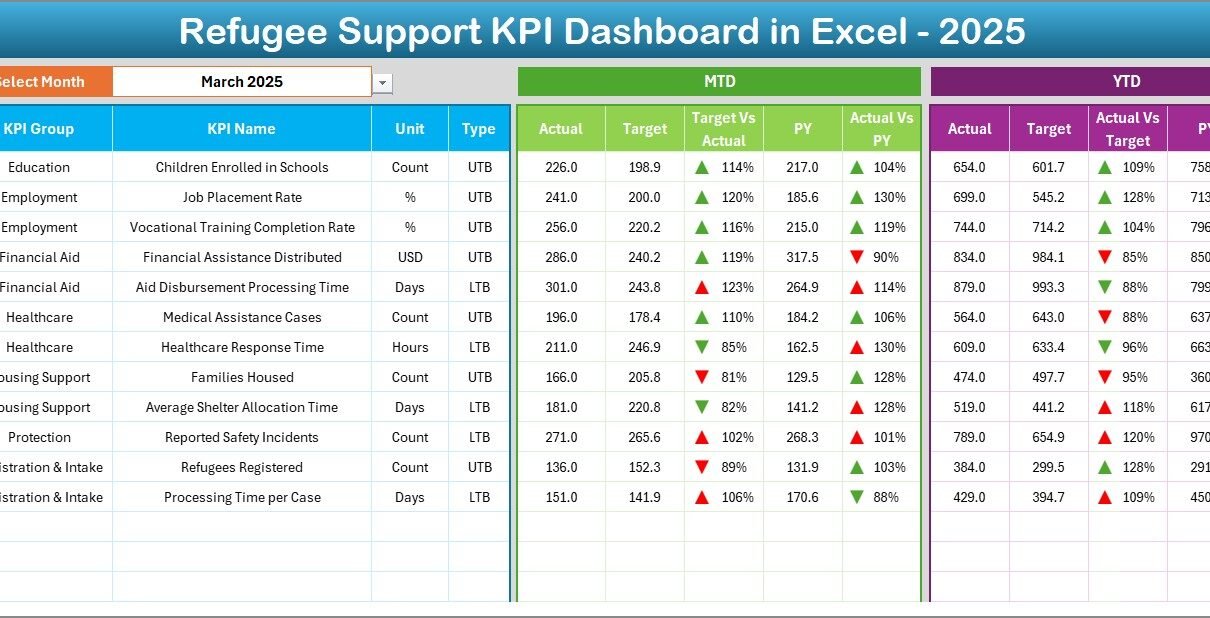
2️⃣ How Does the Dashboard Sheet Work?
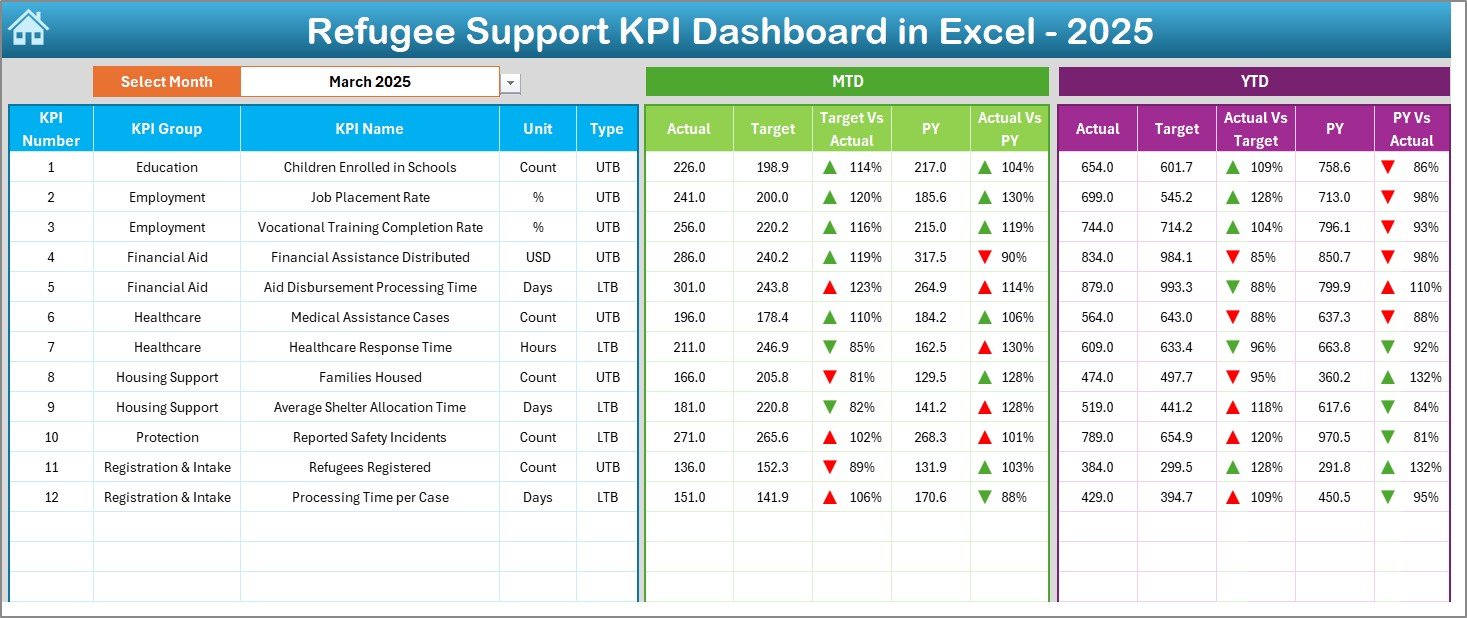
The Dashboard Sheet is the main reporting page.
Here, you can select the month from the drop-down in cell D3. Once you choose the month, the entire dashboard updates automatically.
This sheet displays:
📊 Monthly (MTD) Information:
-
MTD Actual
-
MTD Target
-
Previous Year (MTD)
-
Target vs Actual comparison
-
Previous Year vs Actual comparison
-
Conditional formatting arrows (Up/Down)
📈 Year-to-Date (YTD) Information:
-
YTD Actual
-
YTD Target
-
YTD Previous Year
-
Target vs Actual comparison
-
Previous Year vs Actual comparison
-
Conditional formatting arrows
Because of this layout, users immediately see performance gaps. Furthermore, visual arrows help managers identify positive or negative trends quickly.
3️⃣ What Does the KPI Trend Sheet Show?
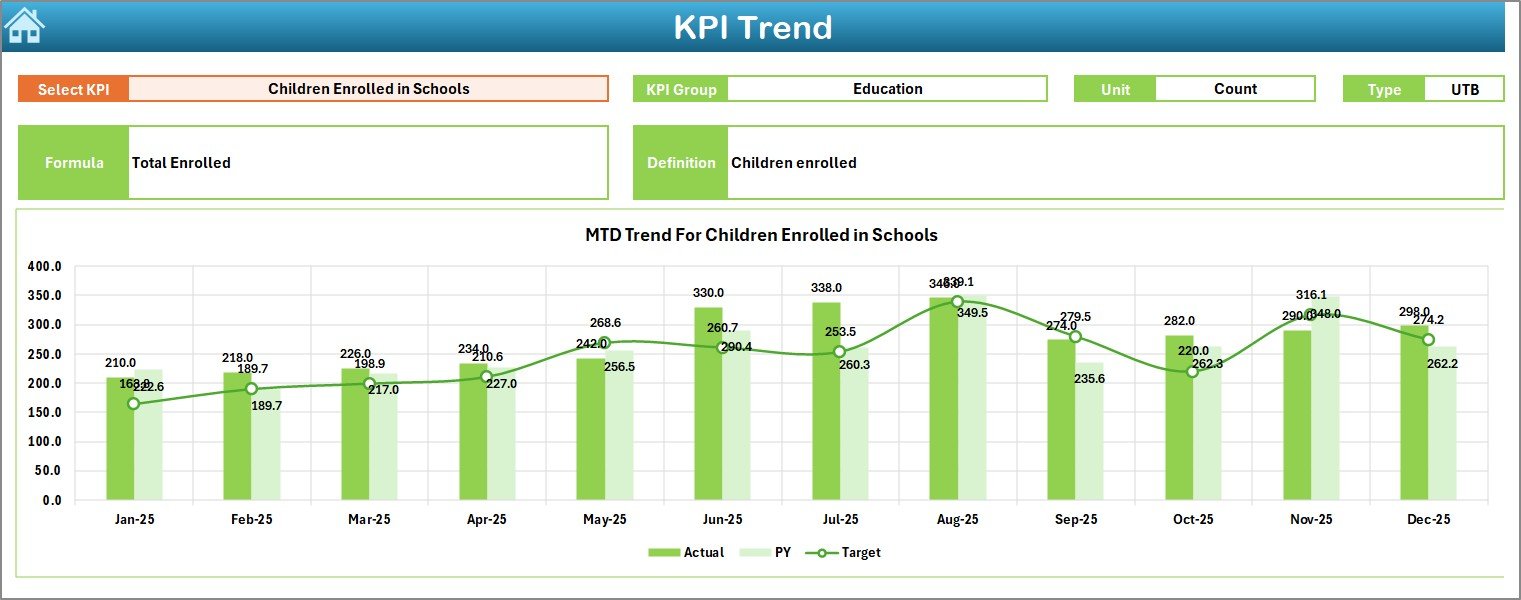
The KPI Trend Sheet provides deeper analysis.
Here, you select the KPI name from the drop-down in cell C3.
Click to Purchases Refugee Support KPI Dashboard in Excel
Once selected, the sheet displays:
-
KPI Group
-
Unit of KPI
-
Type of KPI (Lower the Better / Upper the Better)
-
KPI Formula
-
KPI Definition
Additionally, it shows:
-
MTD Trend Chart (Actual vs Target vs Previous Year)
-
YTD Trend Chart (Actual vs Target vs Previous Year)
Therefore, organizations understand historical movement. Moreover, they analyze whether improvement remains consistent.
4️⃣ How Do You Enter Actual Numbers?
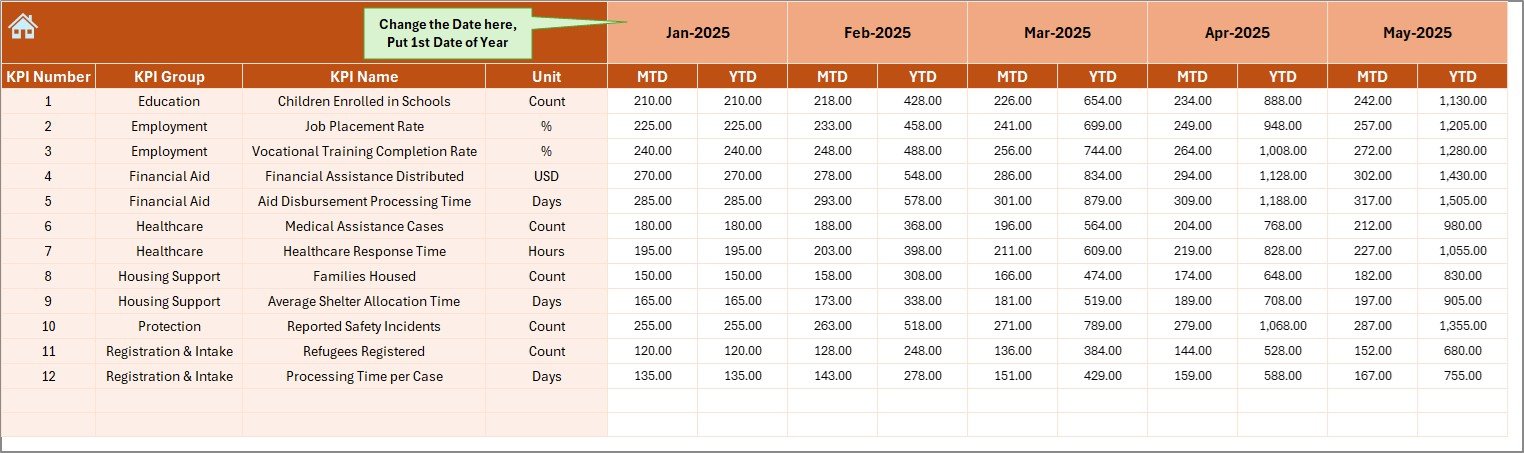
The Actual Numbers Input Sheet collects real data.
Here:
-
You change the first month of the year in cell E1
-
You enter MTD and YTD actual numbers
Because this sheet separates raw data from reports, users maintain clean data flow. Furthermore, this structure reduces errors.
5️⃣ How Does the Target Sheet Function?
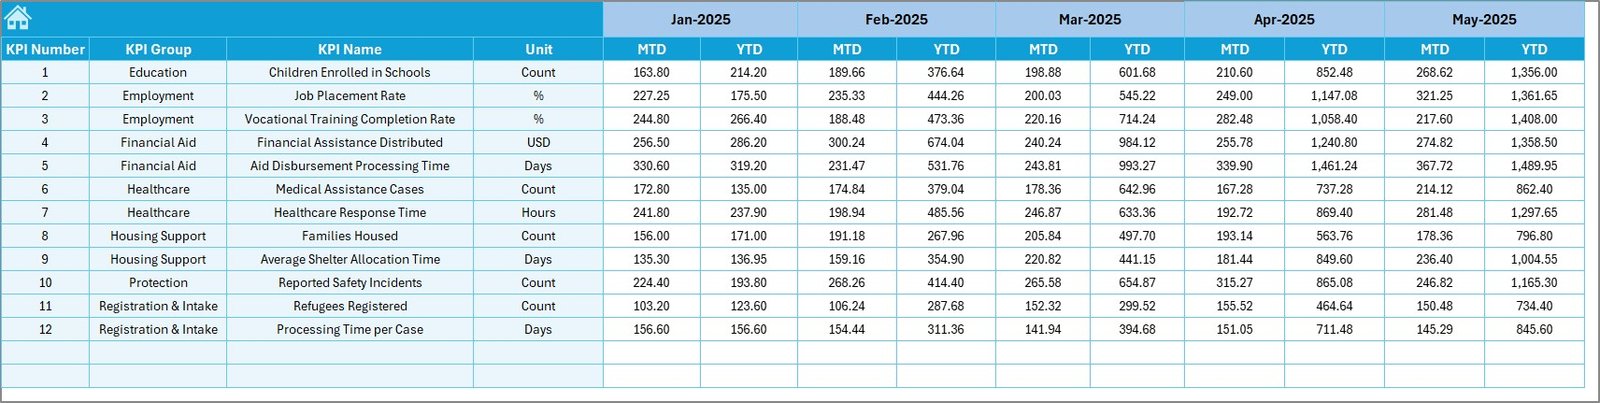
The Target Sheet stores monthly performance goals.
Here, you enter:
-
MTD Target numbers
-
YTD Target numbers
Since targets drive performance measurement, this sheet ensures accurate comparison.
6️⃣ Where Do You Enter Previous Year Numbers?
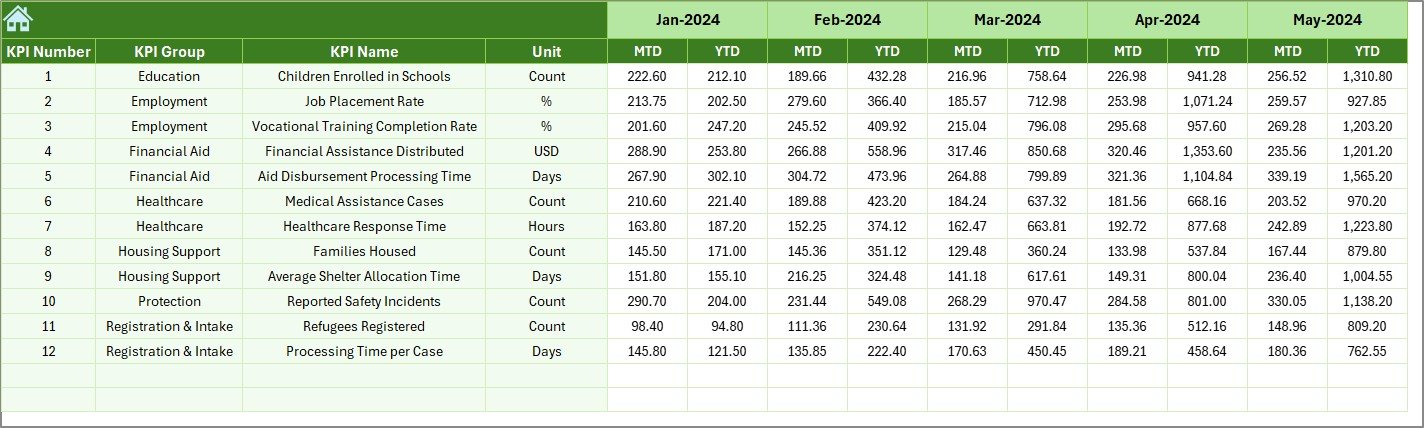
The Previous Year Number Sheet stores last year’s performance.
You enter numbers exactly as you entered for the current year.
As a result, the dashboard calculates:
-
Growth rate
-
Improvement trends
-
Decline patterns
Comparing with the previous year helps organizations justify funding and show long-term impact.
7️⃣ What Is the Role of the KPI Definition Sheet?
Click to Purchases Refugee Support KPI Dashboard in Excel
The KPI Definition Sheet creates structure and clarity.
Here, you enter:
-
KPI Name
-
KPI Group
-
Unit
-
Formula
-
KPI Definition
This sheet ensures consistency. Moreover, it prevents confusion between departments.
What KPIs Should You Track in a Refugee Support Program?
You can customize KPIs based on your mission. However, here are important categories:
👥 Beneficiary KPIs
-
Total refugees served
-
New registrations
-
Active beneficiaries
-
Women and children supported
🍲 Food Assistance KPIs
-
Meals distributed
-
Food packages delivered
-
Cost per meal
🏠 Shelter KPIs
-
Temporary shelters provided
-
Housing upgrades completed
-
Occupancy rate
🏥 Healthcare KPIs
-
Medical consultations
-
Vaccinations provided
-
Emergency cases handled
📚 Education KPIs
-
School enrollments
-
Attendance rate
-
Training programs conducted
💼 Employment KPIs
-
Job placements
-
Skill training sessions
-
Employment rate improvement
When you track these KPIs monthly and yearly, you clearly measure impact.
Advantages of Refugee Support KPI Dashboard in Excel
This dashboard offers powerful benefits.
✅ 1. Centralized Performance Tracking
Instead of using multiple spreadsheets, you manage everything in one file.
✅ 2. Real-Time Monthly Monitoring
You simply change the month in D3. Immediately, the dashboard updates.
✅ 3. Clear Target vs Actual Comparison
Conditional formatting arrows highlight performance gaps instantly.
✅ 4. Strong Donor Reporting
You present structured visual reports to donors confidently.
✅ 5. Historical Trend Analysis
Because the dashboard includes previous year data, you analyze long-term performance.
✅ 6. Easy Customization
You modify KPI definitions, targets, and numbers based on project needs.
✅ 7. No Complex Software Required
You only need Microsoft Excel. Therefore, even small NGOs can use it easily.
How Does This Dashboard Improve Decision Making?
Data drives action. Therefore, this dashboard helps leadership:
-
Identify underperforming programs
-
Allocate funds strategically
-
Adjust operational plans
-
Improve resource distribution
-
Increase transparency
Moreover, managers respond faster because they see monthly and yearly progress clearly.
Best Practices for the Refugee Support KPI Dashboard
To get maximum value, follow these best practices:
📌 1. Define Clear KPIs First
Before entering data, define measurable and meaningful KPIs.
📌 2. Update Data Monthly
Consistent updates ensure accurate reports.
📌 3. Validate Data Entries
Always check actual numbers before finalizing reports.
📌 4. Review Trends Quarterly
Monthly data shows short-term progress. However, quarterly review shows bigger patterns.
📌 5. Align KPIs with Donor Goals
If donors focus on education, prioritize education KPIs.
📌 6. Keep Definitions Clear
Always update the KPI Definition sheet when you add new metrics.
How Can NGOs Customize This Dashboard?
Organizations can:
-
Add new KPI groups
-
Modify units (Number, Percentage, Currency)
-
Insert additional trend charts
-
Add department-level breakdown
-
Include region-wise filtering
Because Excel allows flexibility, customization remains simple.
How Does This Dashboard Support Transparency?
Transparency builds trust. Therefore:
-
You show exact numbers
-
You compare targets clearly
-
You display historical growth
-
You present visual evidence
As a result, stakeholders trust your reports.
Conclusion: Why Should You Use a Refugee Support KPI Dashboard in Excel?
Refugee support programs demand accountability. Moreover, they require clarity and structure. Without proper tracking, organizations struggle to measure real impact.
However, the Refugee Support KPI Dashboard in Excel changes everything.
It centralizes data.
It simplifies reporting.
It highlights performance gaps.
It supports donor communication.
It improves decision-making.
Therefore, every humanitarian organization should use structured KPI tracking.
When you measure impact clearly, you improve impact consistently.
Click to Purchases Refugee Support KPI Dashboard in Excel
Frequently Asked Questions with Answers
❓1. Can small NGOs use this dashboard?
Yes. Small NGOs can use it easily because it works in Microsoft Excel and requires no advanced software.
❓2. Do I need advanced Excel skills to operate it?
No. You only need basic Excel knowledge. You simply enter numbers and select months from drop-down lists.
❓3. Can I add new KPIs?
Yes. You can add new KPIs in the KPI Definition sheet and update targets and actual numbers accordingly.
❓4. How often should I update the dashboard?
You should update it monthly. However, some organizations update weekly for closer monitoring.
❓5. Can I use this dashboard for donor presentations?
Yes. The dashboard structure supports clean and professional reporting for donor meetings.
❓6. Does it support year-over-year comparison?
Yes. The Previous Year sheet allows direct comparison with current performance.
❓7. Can I track multiple programs in one file?
Yes. You can create KPI groups for different programs and manage them within one dashboard.
Visit our YouTube channel to learn step-by-step video tutorials