Running a restaurant or food service business is more than preparing delicious meals. Restaurants & Food Services KPI Dashboard in ExcelIt involves managing operations, monitoring finances, ensuring customer satisfaction, and keeping employees motivated. Without a clear performance tracking system, managers often make decisions based on guesswork. This is where a Restaurants & Food Services KPI Dashboard in Excel comes in.
A well-designed dashboard allows restaurant owners, managers, and teams to track key performance indicators (KPIs) in one place. By using this Excel-based tool, you can measure results against targets, compare performance with the previous year, and identify areas for improvement.
Click to Purchase Restaurants & Food Services KPI Dashboard in Excel
In this guide, we will explore the structure, features, benefits, best practices, and real-world applications of a Restaurants & Food Services KPI Dashboard in Excel.
What Is a Restaurants & Food Services KPI Dashboard?
A KPI Dashboard is a centralized reporting tool that tracks performance metrics in real time. In restaurants and food services, KPIs cover a wide range of areas such as sales, customer experience, operational efficiency, and employee productivity.
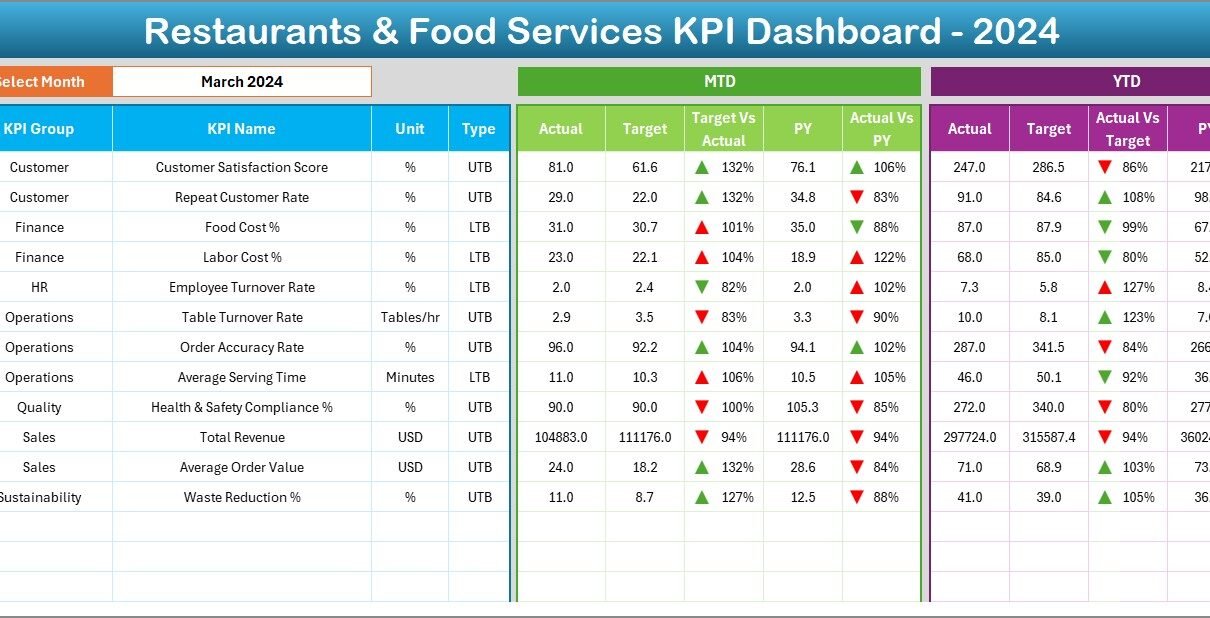
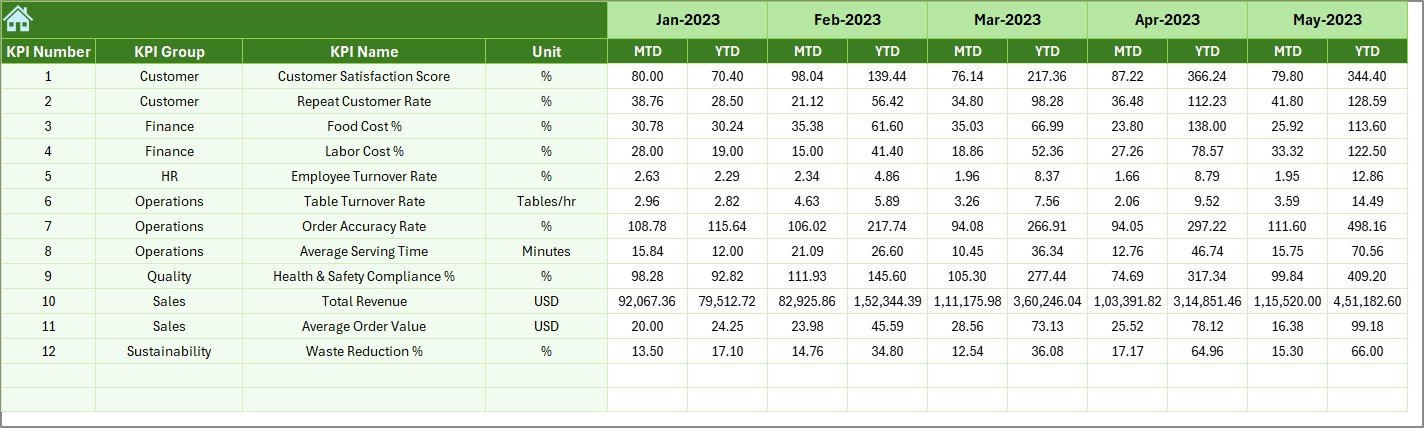
The Excel-based dashboard is designed to display Month-to-Date (MTD) and Year-to-Date (YTD) values, compare them with targets, and visualize trends through charts. It becomes a powerful decision-making system where you can view performance at a glance.
Key Features of the Restaurants & Food Services KPI Dashboard in Excel
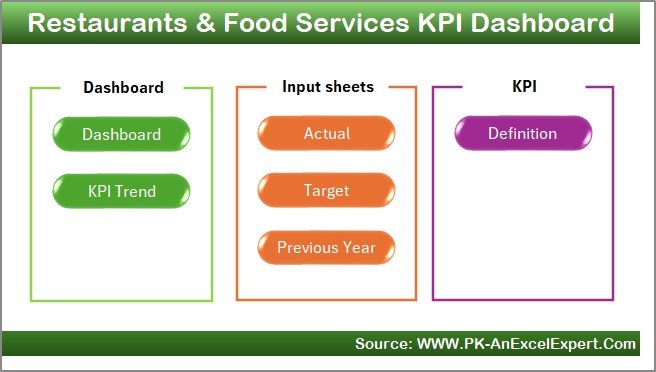
The dashboard comes with seven interactive worksheet tabs, each serving a unique purpose. Let’s explore them one by one.
1. Home Sheet
-
Acts as the index page for the dashboard.
-
Provides six navigation buttons to jump to other sheets.
-
Ensures a smooth user experience and easy navigation.
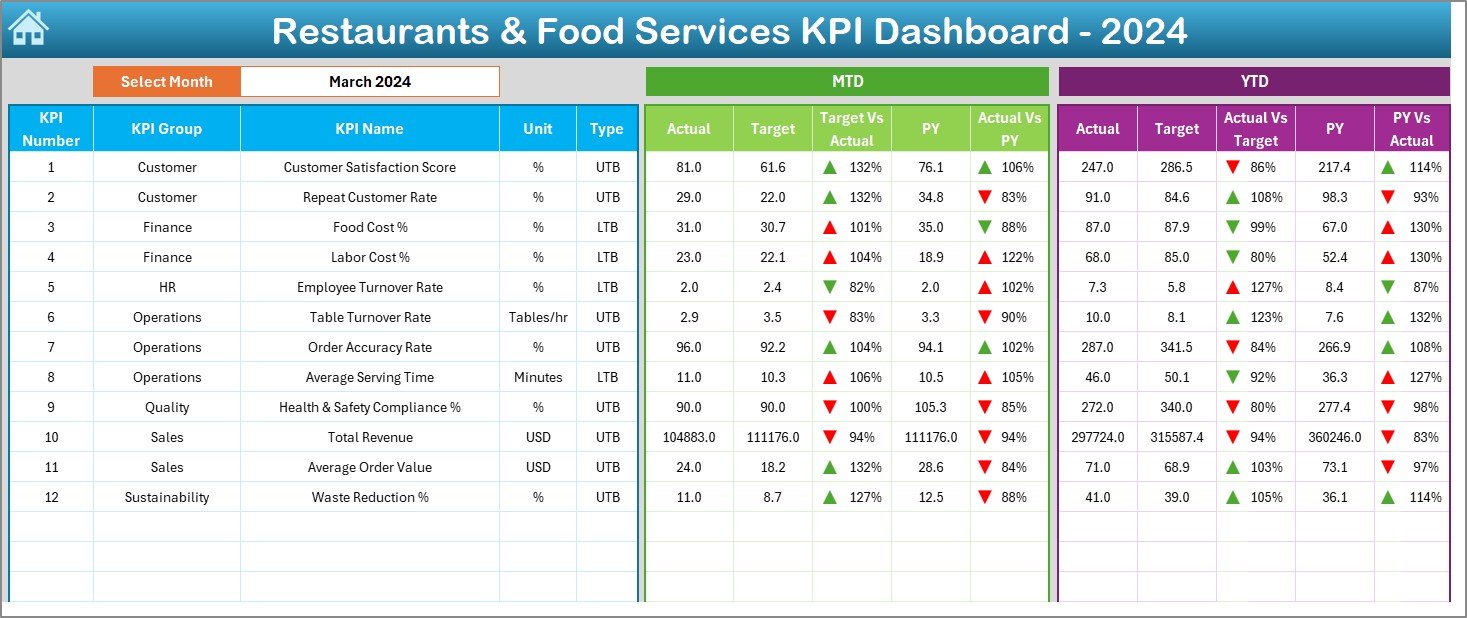
2. Dashboard Sheet
-
Displays all KPIs in one place with drop-down filters.
-
Month selection in cell D3 updates the entire dashboard.
-
Shows MTD Actual, Target, and Previous Year data.
-
Includes conditional formatting with up/down arrows to show performance status.
-
Provides YTD comparisons with targets and previous year figures.
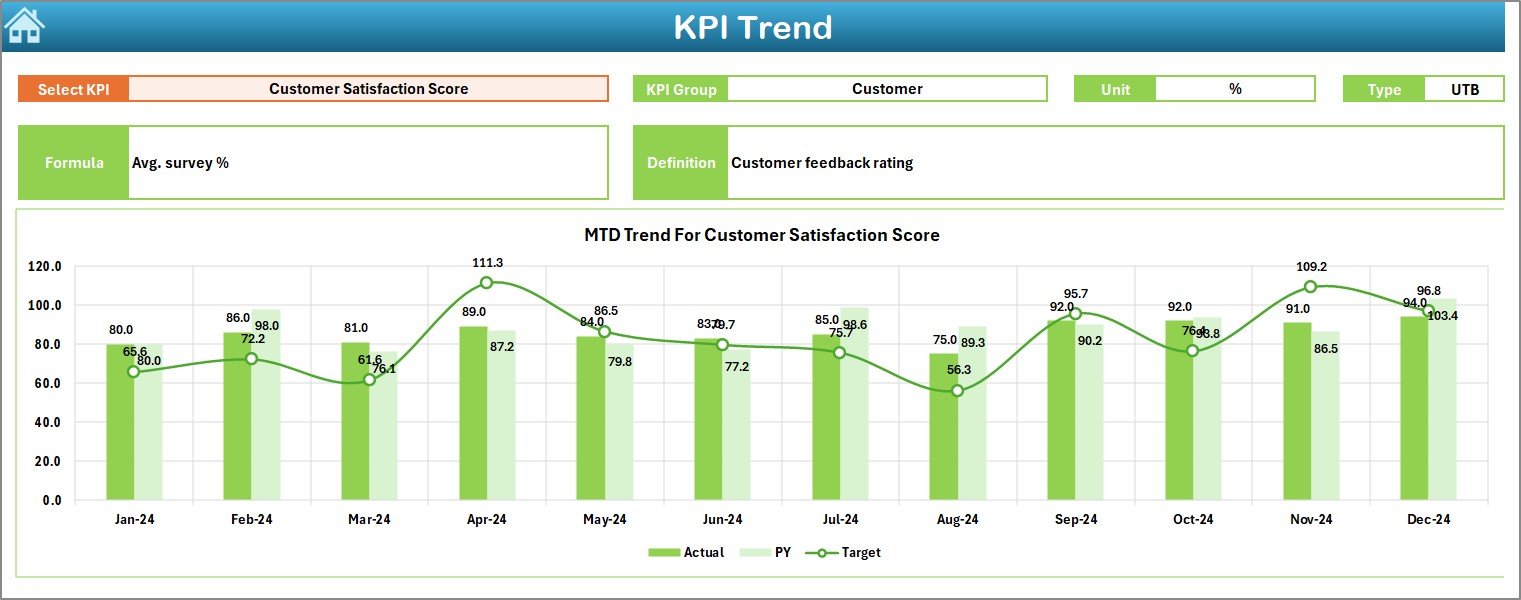
3. KPI Trend Sheet
-
Allows KPI selection from a drop-down menu (cell C3).
-
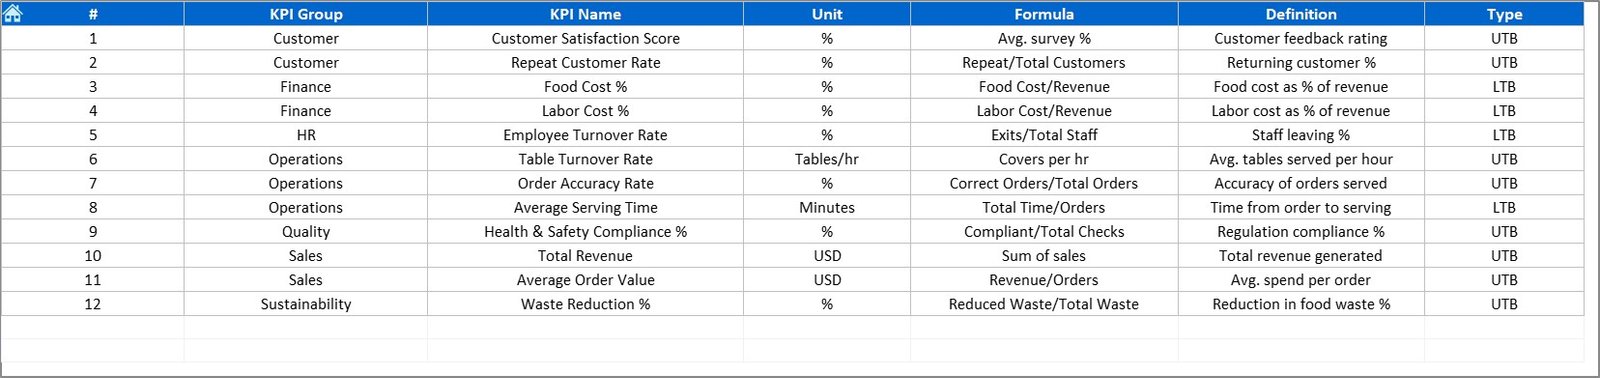
Displays KPI Group, Unit, Type (UTB or LTB), Formula, and Definition.
-
Visualizes MTD and YTD trends through charts for Actual, Target, and Previous Year numbers.
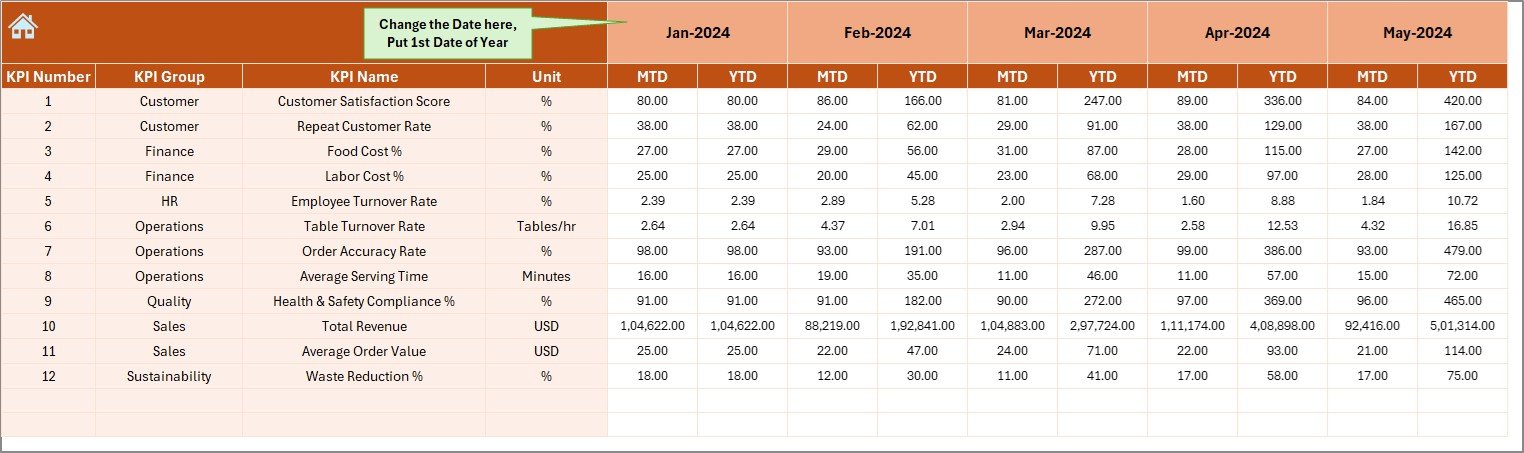
4. Actual Numbers Input Sheet
-
Designed to enter real performance data.
-
Users can update MTD and YTD actual values.
-
Month selection is available in cell E1 for quick updates.
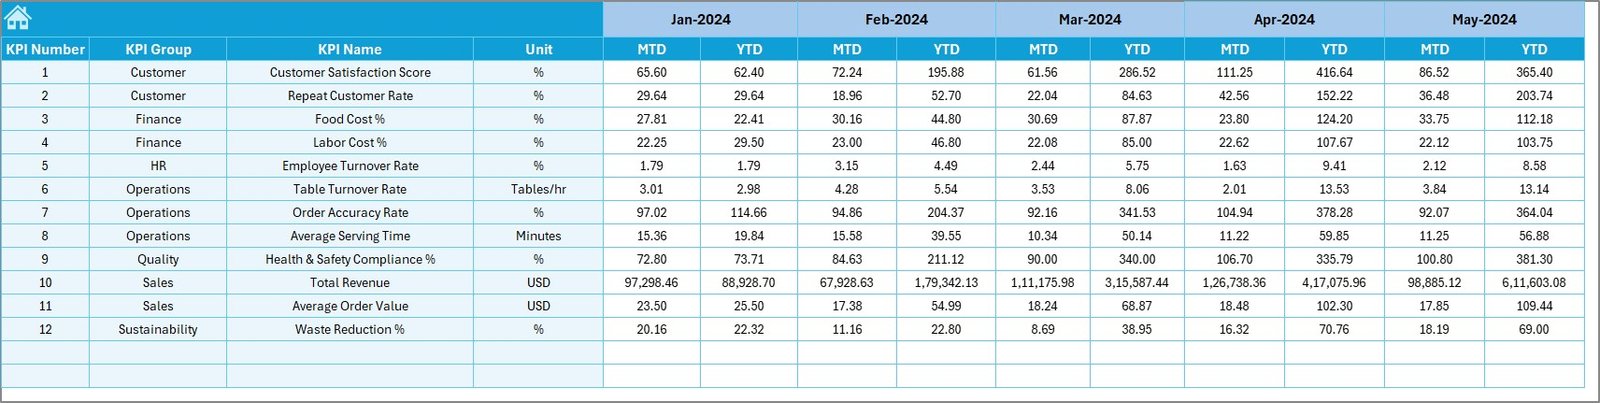
5. Target Sheet
-
Used for entering monthly and yearly target values.
-
Covers all KPIs to track business goals.
6. Previous Year Number Sheet
-
Stores historical performance data.
-
Makes year-over-year (YOY) analysis possible.
7. KPI Definition Sheet
-
Contains details of each KPI: Name, Group, Unit, Formula, and Definition.
-
Acts as a reference sheet for managers and employees.
Why Do Restaurants Need a KPI Dashboard?
Restaurants face unique challenges: fluctuating demand, high operational costs, staff turnover, and customer expectations. A KPI dashboard ensures:
Click to Purchase Restaurants & Food Services KPI Dashboard in Excel
-
Clarity: Managers can see how the restaurant is performing in real time.
-
Data-Driven Decisions: Instead of relying on assumptions, decisions are based on numbers.
-
Goal Tracking: It becomes easy to track if the restaurant is meeting sales and service targets.
-
Continuous Improvement: Trends highlight areas needing improvement.
Common KPIs for Restaurants & Food Services
A restaurant KPI dashboard typically covers the following areas:
Financial KPIs
-
Revenue per Customer
-
Gross Profit Margin
-
Food Cost Percentage
-
Labor Cost Percentage
Customer Experience KPIs
-
Customer Satisfaction Score (CSAT)
-
Average Wait Time
-
Order Accuracy Rate
-
Repeat Customer Rate
Operational KPIs
-
Table Turnover Rate
-
Inventory Turnover Ratio
-
Waste Percentage
Employee Performance KPIs
-
Training Hours per Employee
-
Employee Turnover Rate
-
Staff Productivity Ratio
Advantages of a Restaurants & Food Services KPI Dashboard
Using an Excel-based dashboard brings several benefits:
✅ Affordable & Accessible: Excel is widely available and does not require expensive software.
✅ Customization: You can add, modify, or remove KPIs to fit your business.
✅ Visual Insights: Charts and graphs make data easy to understand.
✅ Performance Tracking: Real-time MTD and YTD tracking improves accountability.
✅ Data Comparisons: Historical and target comparisons highlight strengths and weaknesses.
✅ Ease of Use: Simple design allows even non-technical staff to use it effectively.
Opportunities for Improvement
Even though Excel-based dashboards are powerful, restaurants can enhance their usefulness by:
📌 Automating Data Entry: Linking the dashboard to POS systems to reduce manual updates.
📌 Integrating Customer Feedback: Adding survey results to measure service quality.
📌 Expanding KPI Categories: Including environmental sustainability and food safety KPIs.
📌 Mobile Accessibility: Designing the dashboard to work smoothly on tablets for managers on the move.
📌 Regular Updates: Reviewing and updating KPIs every quarter to align with new business goals.
Best Practices for Using a KPI Dashboard in Restaurants
To get the most out of your KPI dashboard, follow these practices:
-
Define Clear KPIs
-
Choose KPIs that align with your restaurant’s goals.
-
Avoid adding too many irrelevant metrics.
-
-
Update Data Consistently
-
Enter actuals, targets, and historical data regularly.
-
Keep inputs accurate for reliable results.
-
-
Use Conditional Formatting
-
Highlight underperforming areas with red arrows or alerts.
-
Celebrate achievements with green indicators.
-
-
Review Trends Monthly
-
Analyze both MTD and YTD performance.
-
Compare with previous year data to spot seasonal patterns.
-
-
Share Insights with Teams
-
Conduct weekly or monthly meetings using the dashboard.
-
Encourage employees to take ownership of KPIs related to their roles.
-
Real-World Applications of Restaurant KPI Dashboards
Restaurants and food service businesses can apply KPI dashboards in many scenarios:
-
Small Cafés: Track daily sales, customer footfall, and average order value.
-
Fast Food Chains: Monitor drive-thru times, order accuracy, and repeat customers.
-
Fine Dining Restaurants: Measure table occupancy rates, customer satisfaction, and menu performance.
-
Catering Services: Track event-based revenue, food cost percentage, and client satisfaction.
-
Food Trucks: Analyze sales by location, popular menu items, and profit margins.
How to Build and Use the Dashboard
-
Step 1: Collect Data
Gather actual sales, costs, customer, and employee data. -
Step 2: Enter Inputs
Fill the Actual Numbers, Target, and Previous Year sheets. -
Step 3: Define KPIs
Ensure all KPIs are listed with formulas and units in the KPI Definition sheet. -
Step 4: Review Dashboard
Use the Dashboard and KPI Trend tabs to view performance. -
Step 5: Take Action
Use insights to adjust pricing, promotions, staffing, or inventory.
Conclusion
The Restaurants & Food Services KPI Dashboard in Excel is a powerful, easy-to-use tool that helps managers, owners, and employees track performance, control costs, and improve customer satisfaction. By consolidating all KPIs in one dashboard, restaurants can make better decisions, increase efficiency, and achieve long-term growth.
Click to Purchase Restaurants & Food Services KPI Dashboard in Excel
Frequently Asked Questions (FAQs)
1. What are the most important KPIs for restaurants?
The most important KPIs include revenue per customer, food cost percentage, labor cost percentage, customer satisfaction score, and table turnover rate.
2. Can small restaurants use this dashboard?
Yes. Even small cafés or food trucks can use the dashboard to monitor sales, costs, and customer metrics.
3. How often should I update the KPI dashboard?
You should update the dashboard monthly with actual, target, and historical data. For fast-paced restaurants, weekly updates are also helpful.
4. Is Excel enough for tracking restaurant KPIs?
Excel works well for most restaurants. However, large chains may integrate the dashboard with advanced POS or BI tools for automation.
5. Can I customize the KPIs in this dashboard?
Yes. The KPI Definition sheet allows full customization. You can add or remove KPIs based on your restaurant’s needs.
Visit our YouTube channel to learn step-by-step video tutorials
Click to Purchase Restaurants & Food Services KPI Dashboard in Excel