In today’s highly competitive retail and e-commerce landscape, businesses must track customer engagement metrics closely to stay ahead. Consequently, a well-designed Customer Engagement KPI Dashboard in Excel empowers decision-makers to monitor performance, spot trends, and act swiftly. This article walks you through everything you need to know—step by step—to create, configure, and optimize your own Retail and E-commerce Customer Engagement KPI Dashboard. You’ll learn the key features, best practices, and advantages of this dashboard, along with answers to frequently asked questions.
Click to Purchases Retail and E-commerce Customer Engagement KPI Dashboard in Excel
What Is a Customer Engagement KPI Dashboard?
A Customer Engagement KPI Dashboard is a centralized Excel template that consolidates your most important metrics—such as click-through rates, repeat purchase rates, and social engagement—into interactive visuals. Rather than juggling multiple spreadsheets, you get a single interface where:
-
You select the reporting period (monthly or year-to-date)
-
You compare Actual vs. Target vs. Prior Year figures
-
You drill down into individual KPIs via trend charts
-
You update inputs easily on designated sheets
By pulling all data into one cohesive place, stakeholders instantly see where engagement excels or lags, enabling data-driven decisions.
Why Use Excel for Your KPI Dashboard?
Even in the age of cloud-based BI tools, Excel remains a top choice because it:
-
Offers Universal Access. Almost every organization already uses Excel, so you avoid licensing hurdles.
-
Provides Familiar Functionality. Teams know PivotTables, formulas, and conditional formatting—no steep learning curve required.
-
Ensures Full Customization. You control every aspect of layout, color, and calculation without restrictions.
-
Enables Rapid Prototyping. You can build a working dashboard in a few hours, then refine it iteratively.
Moreover, Excel’s combination of data-modeling capabilities and visualization tools makes it ideal for most retail and e-commerce use cases.
What Are the Key Features of This KPI Dashboard?
This dashboard template consists of seven worksheets, each serving a clear purpose:
Home Sheet
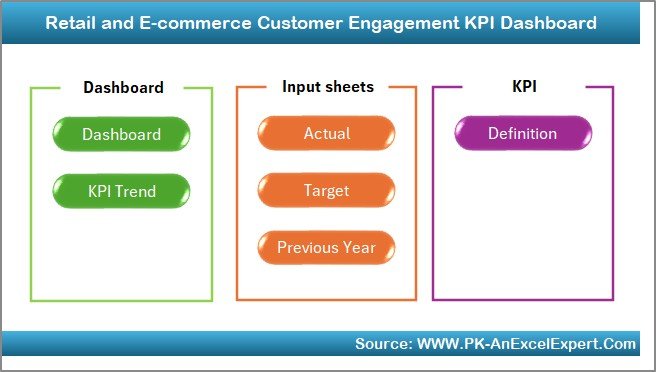
- Acts as an index, with six buttons linking to other sheets.
- Offers intuitive navigation for any user, regardless of Excel experience.
Click to Purchases Retail and E-commerce Customer Engagement KPI Dashboard in Excel
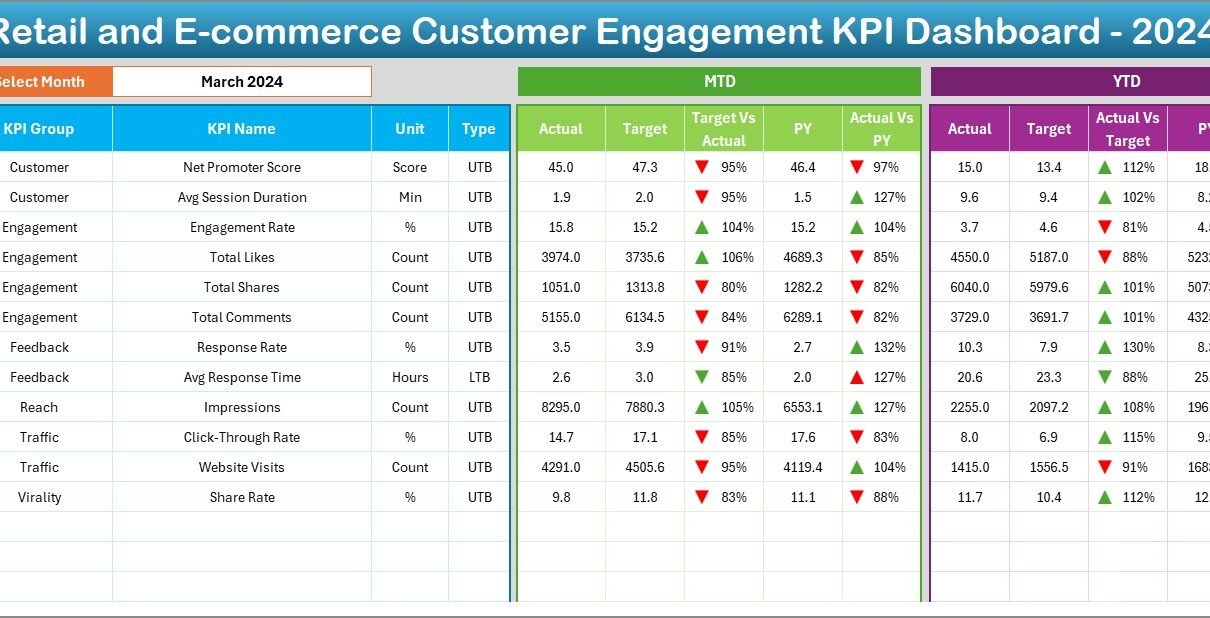
Dashboard Sheet
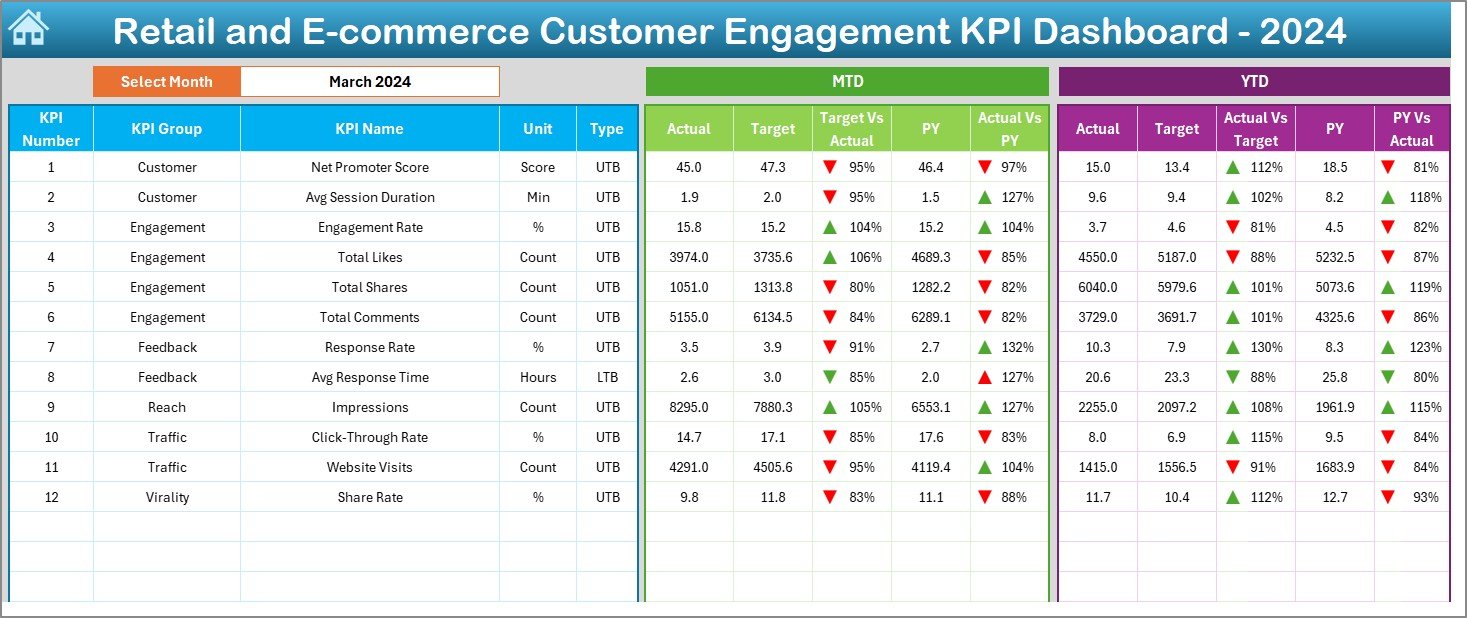
- Main reporting interface.
- Includes a drop-down in cell D3 to select the month. As you change the month, MTD (Month-to-Date) and YTD (Year-to-Date) figures update instantly.
- Displays Actual, Target, and Prior Year data side by side for each KPI.
- Uses conditional formatting arrows to highlight performance gaps.
KPI Trend Sheet
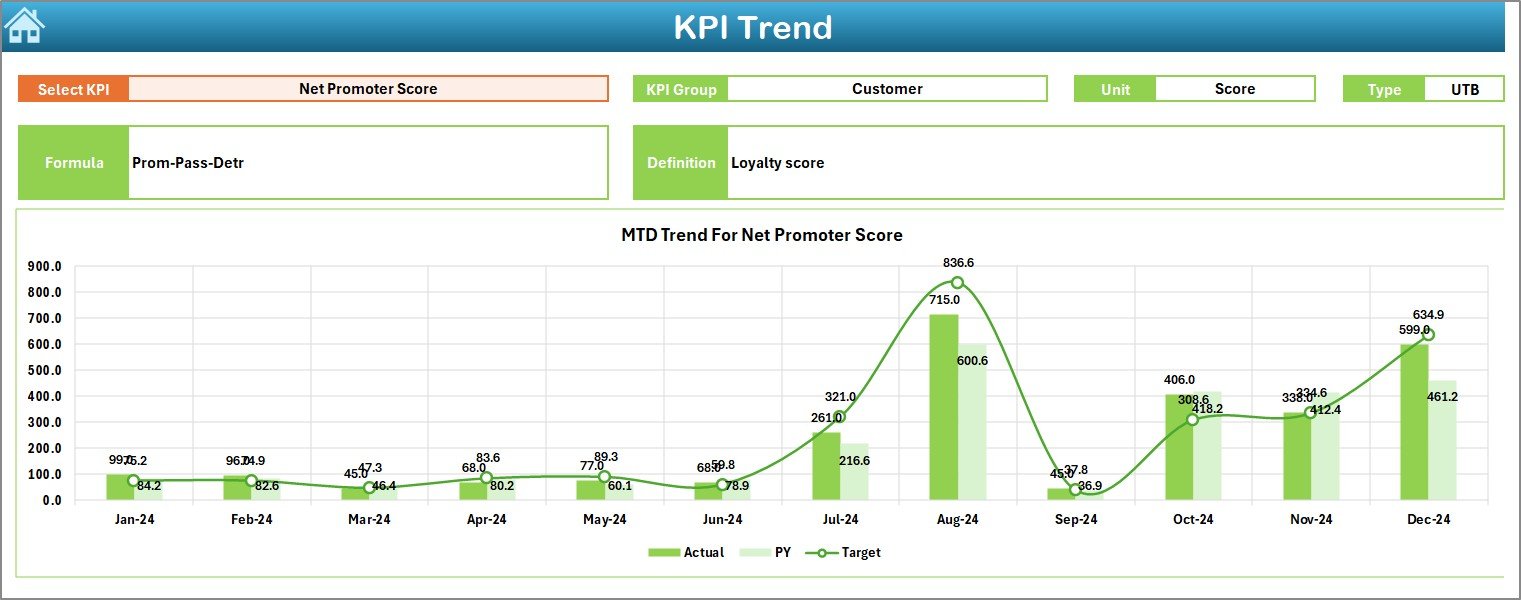
- Drop-down in cell C3 lets you choose any KPI to analyze.
- Shows KPI Group, Unit (e.g., “%” or “Number”), KPI Type (Lower-the-Better or Upper-the-Better), Formula, and Definition.
- Renders MTD and YTD trend charts for Actual, Target, and Prior Year values, so you can spot seasonality or sudden shifts.
Actual Numbers Input Sheet
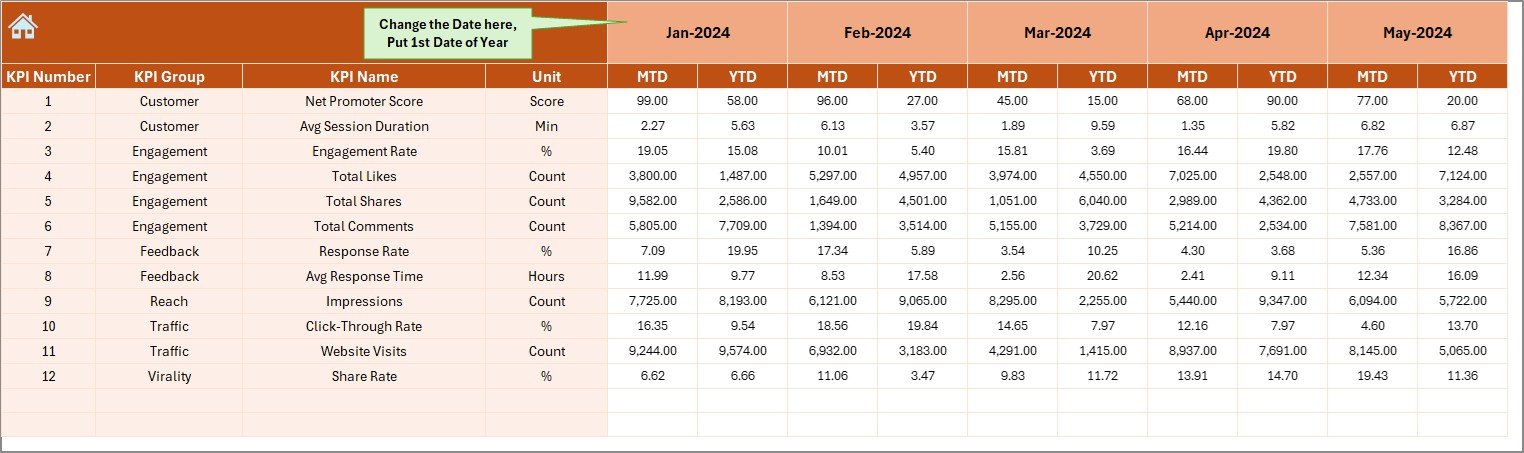
- Dedicated area to key in Actual figures for MTD and YTD.
- Month picker in cell E1 sets the starting month for your reporting year.
Click to Purchases Retail and E-commerce Customer Engagement KPI Dashboard in Excel
Target Sheet
- Enter monthly Target values for each KPI (both MTD and YTD).
- Ensures your dashboard always pulls the latest goals to calculate variances.
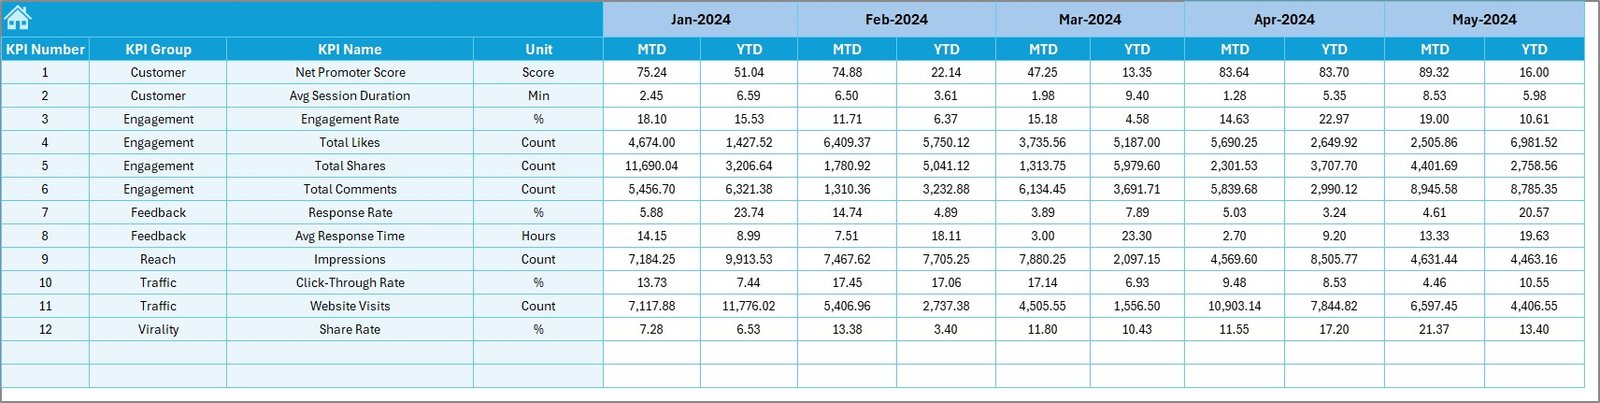
Previous Year Numbers Sheet
- Mirror the Actual sheet, but for the previous calendar year.
- Enables year-over-year comparisons to gauge improvement.
KPI Definition Sheet
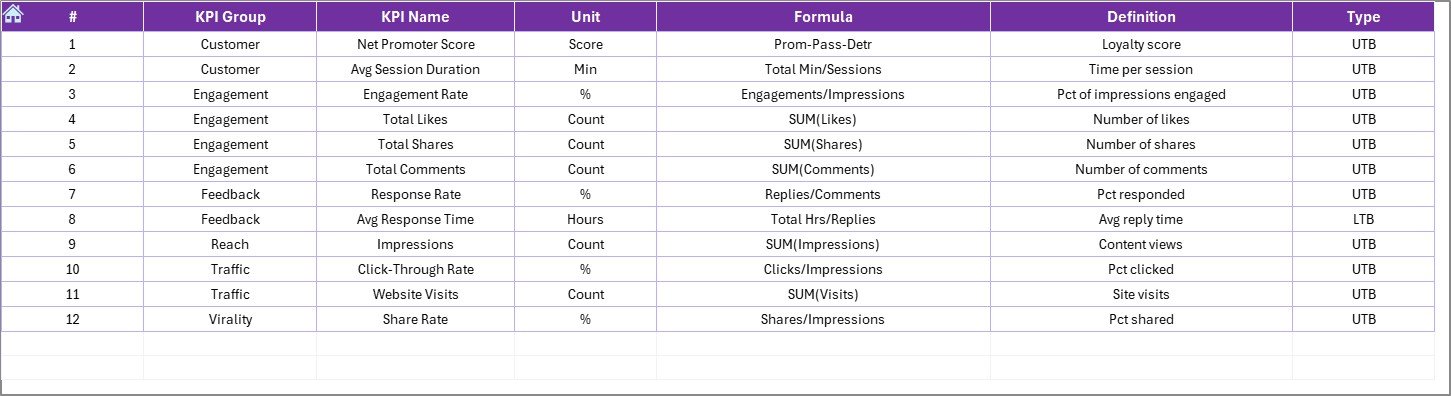
- Central repository for all KPI metadata: KPI Name, KPI Group, Unit, Formula, and concise Definitions.
- Serves as the source for dynamic labels and tooltips throughout the dashboard.
By structuring your workbook in this modular way, you separate data entry from reporting. As a result, your dashboards remain tidy, and you minimize risks of accidental formula edits.
Advantages of a Customer Engagement KPI Dashboard
Creating a dedicated engagement dashboard delivers several benefits:
-
Enhanced Visibility. You and your team can view real-time engagement trends across channels—email, social media, website, and mobile app—at a glance.
-
Faster Decision Making. With consolidated figures and visual cues (e.g., conditional formatting), you identify underperforming areas immediately and take corrective action.
-
Improved Accountability. Clear targets and variance analysis foster ownership. Team members know exactly which KPIs they need to improve.
-
Data Consistency. Centralized data entry sheets eliminate version conflicts common in scattered spreadsheets.
-
Scalability. As your business grows, you can add new KPIs or extend the dashboard to include new segments—without rebuilding from scratch.
Consequently, your organization transitions from reactive firefighting to proactive engagement strategies.
Key KPIs to Track for Customer Engagement
While every business has unique needs, typical retail and e-commerce engagement KPIs include:
Website Conversion Rate (UTB)
- Unit: %
- Formula: (Number of Purchases / Total Website Visitors) × 100
Repeat Purchase Rate (UTB)
- Unit: %
- Formula: (Number of Returning Customers / Total Customers) × 100
Average Order Value (AOV) (UTB)
- Unit: Currency
- Formula: Total Revenue / Number of Orders
Cart Abandonment Rate (LTB)
- Unit: %
- Formula: (Abandoned Carts / Initiated Carts) × 100
Email Open Rate (UTB)
- Unit: %
- Formula: (Opened Emails / Sent Emails) × 100
Email Click-Through Rate (UTB)
- Unit: %
- Formula: (Clicked Links / Delivered Emails) × 100
Social Media Engagement Rate (UTB)
- Unit: %
- Formula: (Likes + Shares + Comments) / Total Followers × 100
Customer Satisfaction Score (CSAT) (UTB)
- Unit: Scale (e.g., 1–5)
- Formula: (Sum of Scores / Number of Responses)
How Do You Set Up the Dashboard Step by Step?
Follow these simple steps to implement your dashboard:
-
Prepare the KPI Definition Sheet
-
List each KPI’s name, group, unit, formula, and a short definition.
-
Keep definitions under 100 characters for clarity.
-
-
Populate Data Input Sheets
-
In the Actual Numbers sheet, fill in MTD and YTD actuals for each KPI.
-
On the Target sheet, set your monthly goals.
-
In the Previous Year sheet, enter last year’s figures in the same format.
-
-
Build the Dashboard Sheet
-
Insert a Data Validation drop-down in cell D3 referencing your month list.
-
Create PivotTables or INDEX/MATCH formulas to pull Actual, Target, and Prior Year values based on the selected month.
-
Apply conditional formatting arrows for quick variance insight.
-
-
Design the KPI Trend Sheet
-
Add a drop-down in C3 linked to KPI names on the Definition sheet.
-
Use dynamic chart ranges (e.g., OFFSET or named ranges) to plot trends for the chosen KPI.
-
Label axes clearly and include legends.
-
-
Implement Navigation Buttons
-
On the Home sheet, insert shapes and assign “Hyperlink” actions to jump to each tab.
-
Format buttons uniformly for a polished look.
-
-
Test and Validate
-
Switch months in D3 and verify all numbers update correctly.
-
Change a value in the Actual sheet and confirm it reflects on the dashboard and trend charts.
-
-
Lock and Protect
-
Protect sheets containing formulas to prevent accidental edits.
-
Leave input sheets unprotected for data entry.
-
By following this process, you ensure a robust, user-friendly dashboard that scales with your business needs.
What Are the Best Practices for Your KPI Dashboard?
To maximize the impact of your engagement dashboard, apply these best practices:
-
Limit KPIs to the Essentials. More than 12 KPIs can overwhelm users. Focus on metrics that drive action.
-
Keep Layout Clean. Group related KPIs together and maintain consistent font sizes.
-
Use Color Sparingly. Highlight only critical variances—avoid rainbow palettes.
-
Document Your Formulas. Include a hidden “Documentation” sheet explaining complex calculations.
-
Automate Data Refresh. If possible, link Excel to your database or use Power Query to import data.
-
Leverage Named Ranges. They simplify formulas and make your model easier to audit.
-
Update Periodically. Schedule weekly or monthly reviews to keep targets aligned with business goals.
-
Gather Feedback. Solicit input from end users to improve usability and relevance.
Following these guidelines guarantees that your dashboard remains a trusted tool for stakeholders.
How Does the Dashboard Improve Customer Engagement?
Tracking these metrics directly influences engagement strategies:
-
Identify High-Value Channels. By comparing actuals to targets, you see which channels—email, social, or organic search—deliver the best engagement.
-
Optimize Campaign Timing. Trend charts reveal peak engagement periods, so you schedule promotions at optimal times.
-
Personalize Communication. Low email open or click rates signal a need for tailored messaging.
-
Reduce Cart Abandonment. Monitoring abandonment over time helps you test checkout improvements to lower dropout rates—therefore boosting conversions.
-
Enhance Customer Loyalty. Tracking repeat purchase rates and NPS guides loyalty initiatives, from rewards programs to personalized offers.
Therefore, your marketing and customer success teams can continuously refine their tactics based on objective data, rather than intuition alone.
What Common Pitfalls Should You Avoid?
Even a well-designed dashboard can fall short if you overlook these mistakes:
-
Overloading with KPIs. Too many metrics dilute focus and slow down analysis.
-
Failing to Update Targets. Static goals quickly become irrelevant in fast-changing markets.
-
Neglecting Data Quality. Garbage in, garbage out—ensure your inputs are accurate and timely.
-
Ignoring Mobile Compatibility. If stakeholders view reports on tablets, ensure charts and fonts scale properly.
-
Skipping Version Control. Maintain a changelog for your dashboard workbook to track updates over time.
By proactively addressing these issues, you maintain the integrity and usefulness of your dashboard.
How Can You Extend the Dashboard Over Time?
Click to Purchases Retail and E-commerce Customer Engagement KPI Dashboard in Excel
As your business evolves, expand the dashboard by:
-
Adding New KPIs. Introduce metrics like Customer Lifetime Value (CLV) or Promotion ROI.
-
Segmenting by Customer Cohorts. Create slicers or drop-downs for customer segments—new vs. returning, geographic regions, or product categories.
-
Integrating External Data. Pull social listening metrics or third-party review scores via Power Query.
-
Incorporating Predictive Analytics. Use Excel’s Forecast Sheet feature to project future KPIs based on historical trends.
-
Automating Alerts. Set conditional formatting or VBA macros to flag metrics that cross critical thresholds.
These enhancements transform your dashboard from a reporting tool into a strategic asset that drives continuous improvement.
Conclusion
An Excel-based Retail and E-commerce Customer Engagement KPI Dashboard provides unmatched clarity, flexibility, and speed. By centralizing your most important metrics—Actual, Target, and Prior Year data—you gain a comprehensive view of performance at a glance. With clear navigation, interactive trend analysis, and best-practice design principles, this dashboard becomes your go-to resource for data-driven engagement strategies.
Implement the steps outlined above, and watch your customer engagement metrics improve month after month.
Frequently Asked Questions
1. What KPIs Should I Include in My Customer Engagement Dashboard?
Focus on metrics that directly correlate with engagement and revenue: Conversion Rate, Repeat Purchase Rate, Cart Abandonment Rate, Email Open and Click-Through Rates, Social Engagement, and Customer Satisfaction scores.
2. How Often Should I Update the Dashboard?
Update Actuals and Targets monthly at a minimum. For fast-moving campaigns, consider weekly refreshes. Automating data imports with Power Query can streamline this process.
3. Can I Share This Dashboard with Non-Excel Users?
Yes. Export the Dashboard sheet as a PDF or use Office 365’s “Share” feature. Alternatively, embed snapshots in PowerPoint for presentations.
4. How Do I Add a New KPI to the Dashboard?
-
Define the KPI in the KPI Definition sheet.
-
Enter its Actual, Target, and Prior Year figures in the respective input sheets.
-
Update the Dashboard and Trend sheet drop-downs to include the new KPI.
5. What If My Business Needs More Than 12 KPIs?
Group related KPIs into logical categories, then build separate dashboards or drill-down sheets for each group. This prevents overcrowding and keeps analysis focused.
6. How Can I Ensure Data Accuracy?
Implement data validation rules on input sheets, protect formula cells, and maintain a changelog or audit trail for any manual edits.
7. Is It Possible to Automate the KPI Inputs?
Absolutely. Use Excel’s Power Query or VBA to pull data from your CRM, e-commerce platform, or email marketing tool, reducing manual effort and errors.
Visit our YouTube channel to learn step-by-step video tutorials