Employee retention plays a pivotal role in the success of any retail or e-commerce business. High turnover rates drain resources, disrupt team dynamics, and harm customer experience. Fortunately, you can use a purpose-built KPI dashboard in Excel to monitor, analyze, and improve retention. In this article, you’ll discover how our Retail and E-commerce Employee Retention KPI Dashboard helps you track key metrics, gain actionable insights, and drive continuous improvement.
Click to Purchases Retail and E-commerce Employee Retention KPI Dashboard in Excel
What Is a Retail and E-commerce Employee Retention KPI Dashboard?
A KPI (Key Performance Indicator) Dashboard compiles multiple indicators on one screen. In Excel, that means interactive charts, slicers, and tables that update at the click of a button. Specifically, our dashboard focuses on employee retention metrics for retail and online stores. You’ll find trends, targets versus actuals, and year-over-year comparisons—all in one template.
Why Monitor Employee Retention?
-
Reduce Recruitment Costs. Hiring new staff often costs more than retaining existing employees.
-
Maintain Service Quality. Experienced workers deliver consistent, high-quality service.
-
Boost Morale and Productivity. Teams that stick together achieve more and stay motivated.
-
Enhance Customer Loyalty. Happy employees create positive customer experiences.
By tracking retention KPIs, you can spot issues early, adjust strategies faster, and protect your bottom line.
Dashboard Structure and Navigation
Our template contains seven worksheets for seamless navigation and data entry. Each sheet serves a clear purpose:
Home Sheet
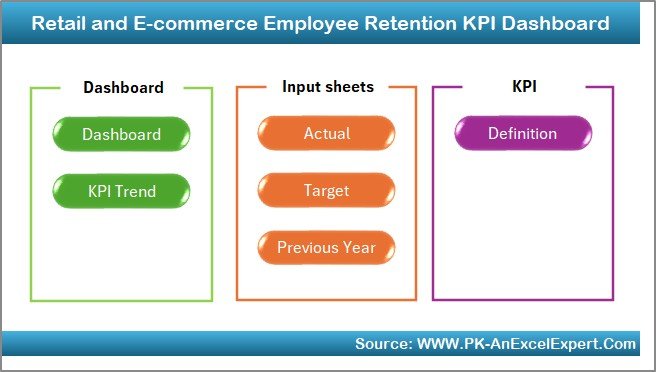
- Index page with six clickable buttons
- Quick jump to each dashboard section
Click to Purchases Retail and E-commerce Employee Retention KPI Dashboard in Excel
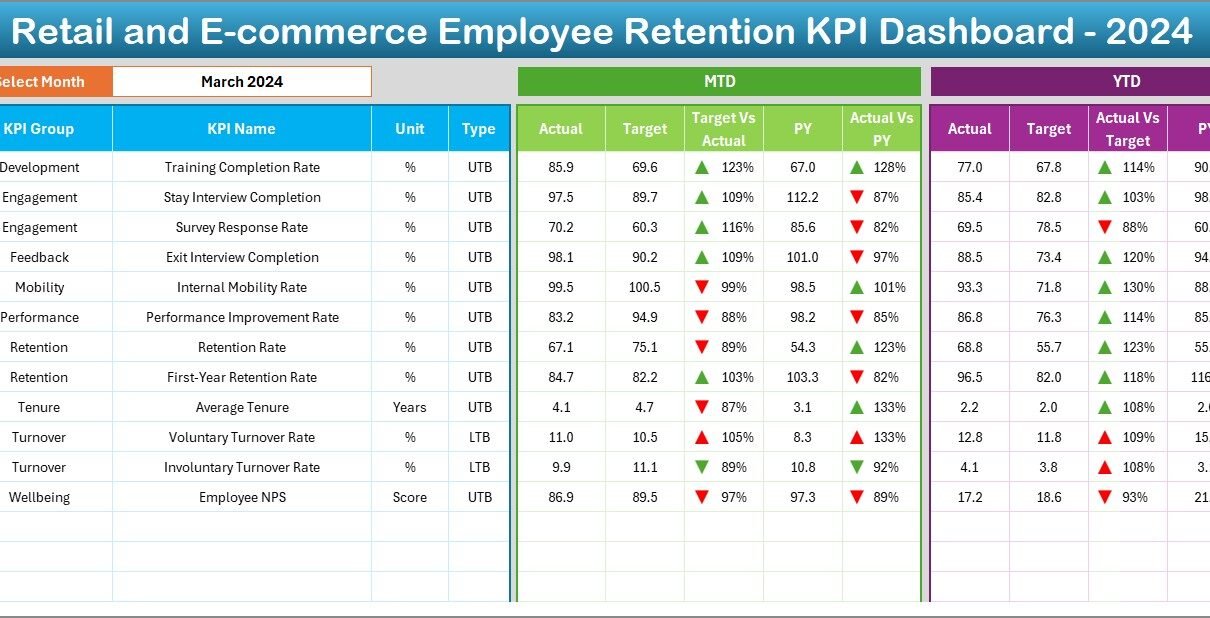
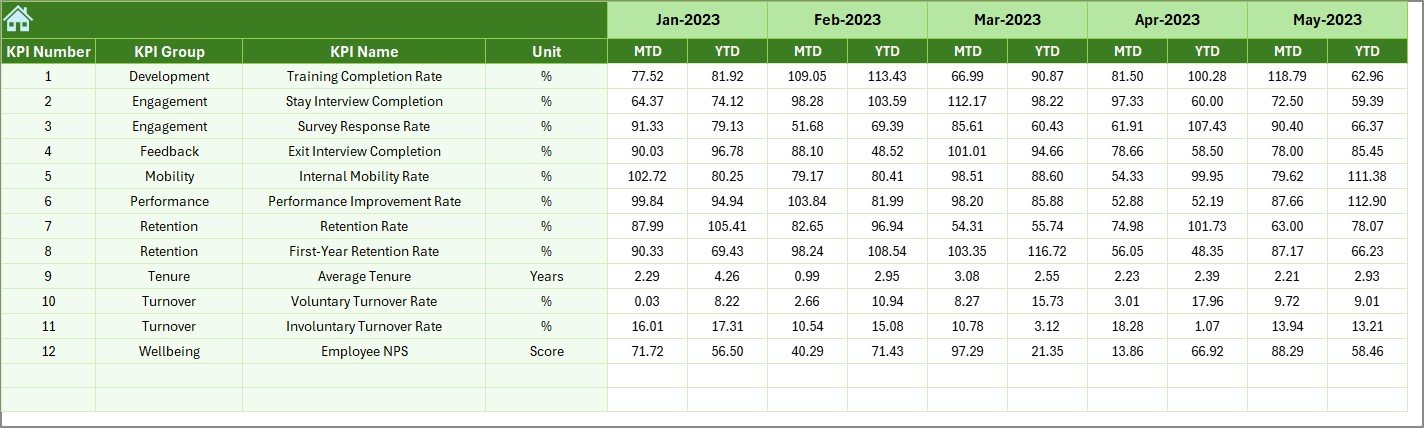
Dashboard Sheet
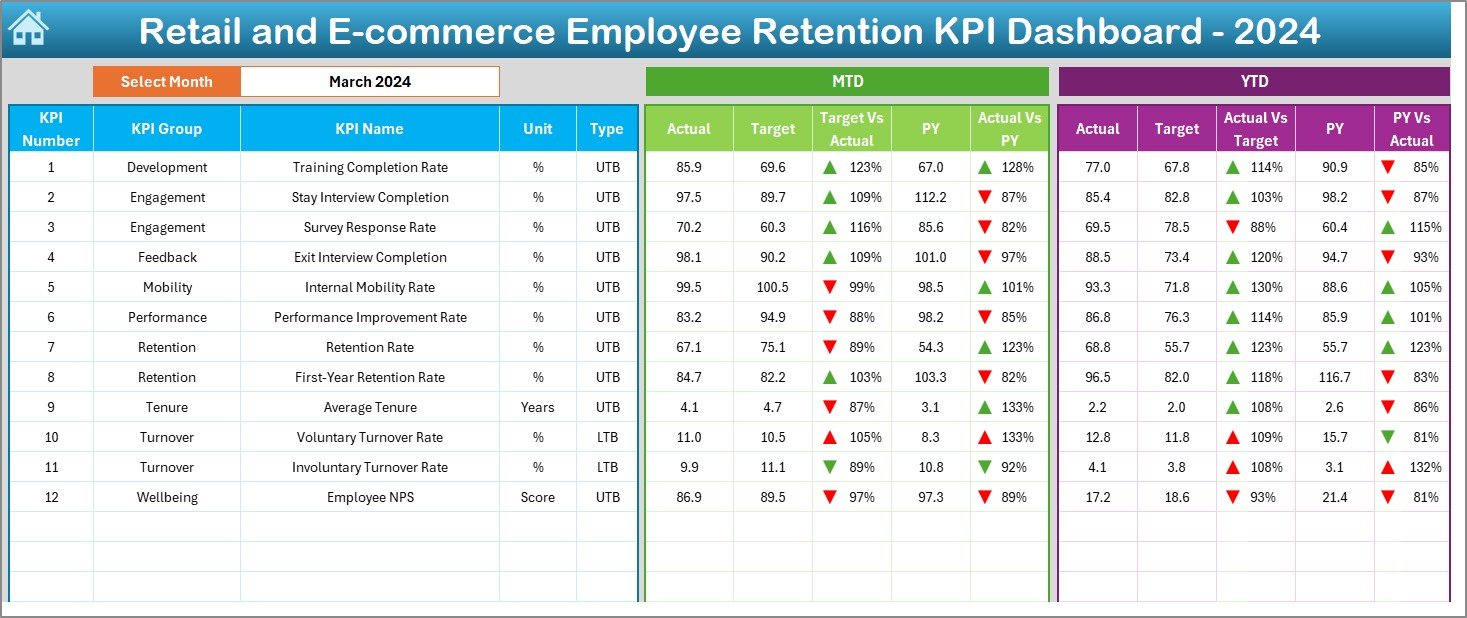
- Main view of all KPIs for selected month
- MTD (Month-to-Date) and YTD (Year-to-Date) Actual, Target, and Previous Year data
- Conditional formatting with up/down arrows for quick trend recognition
KPI Trend Sheet
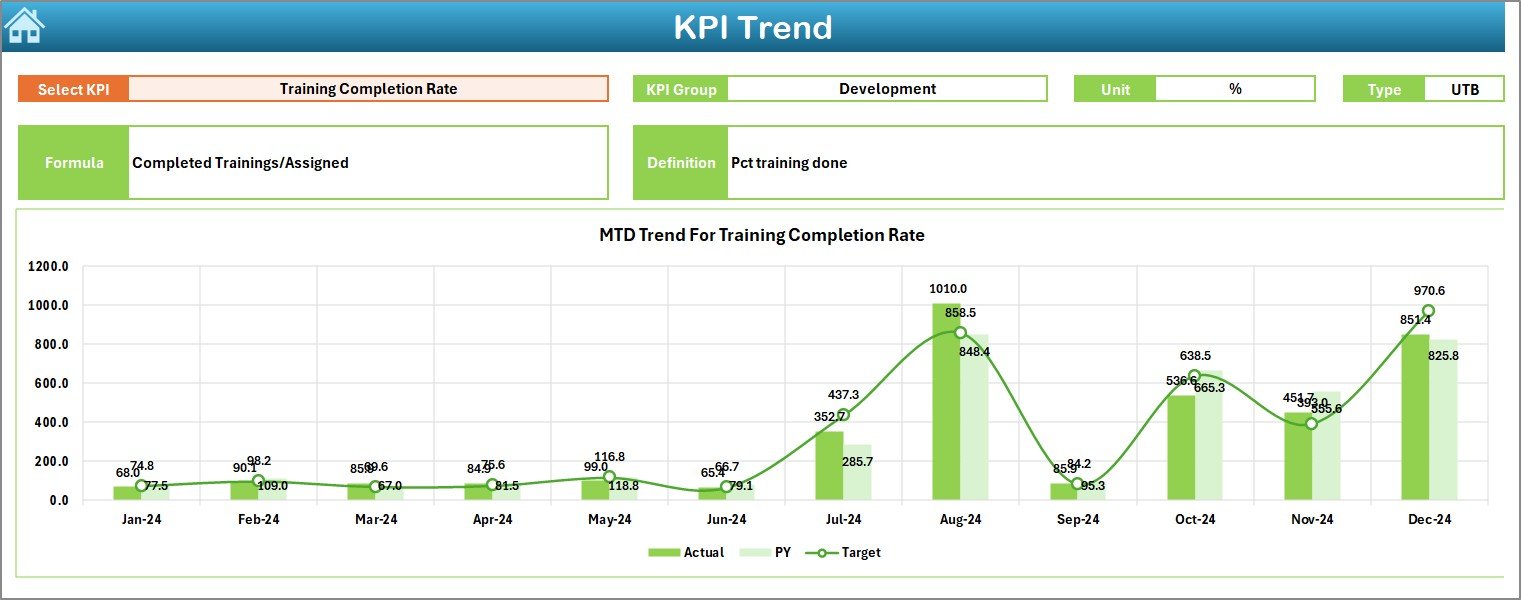
- Choose a KPI by name from a drop-down list
- View detailed group, unit, type, formula, and definition
- MTD and YTD trend charts for Actual, Target, and PY
Actual Numbers Input
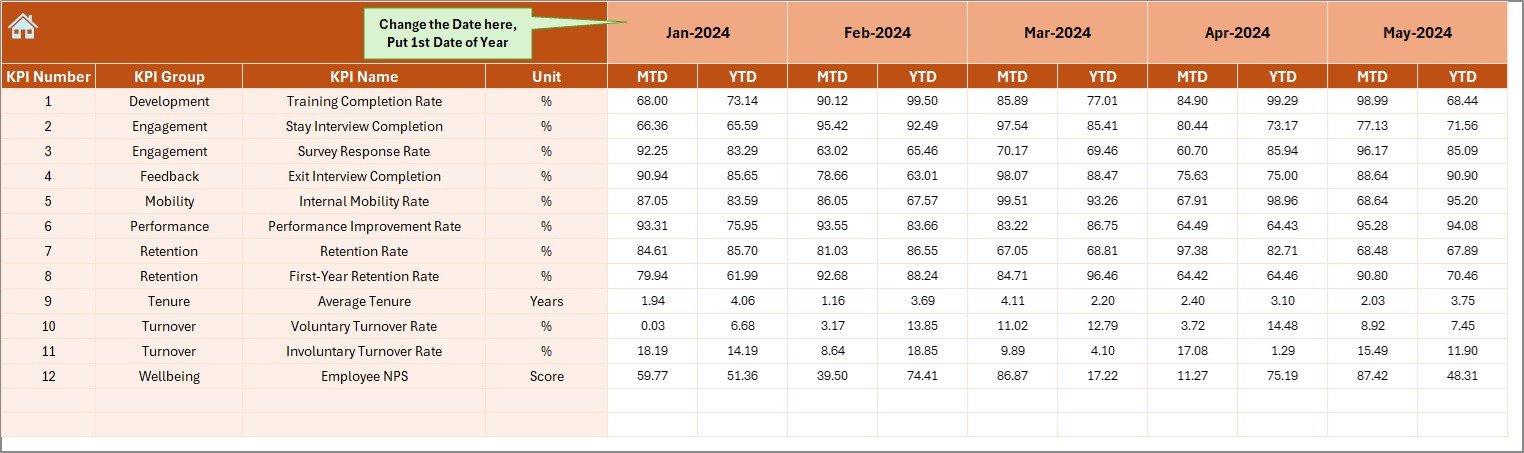
- Enter MTD and YTD actual results per month
- Change reporting start month via cell E1
Click to Purchases Retail and E-commerce Employee Retention KPI Dashboard in Excel
Target Sheet
- Define Target values for each KPI monthly (MTD and YTD)
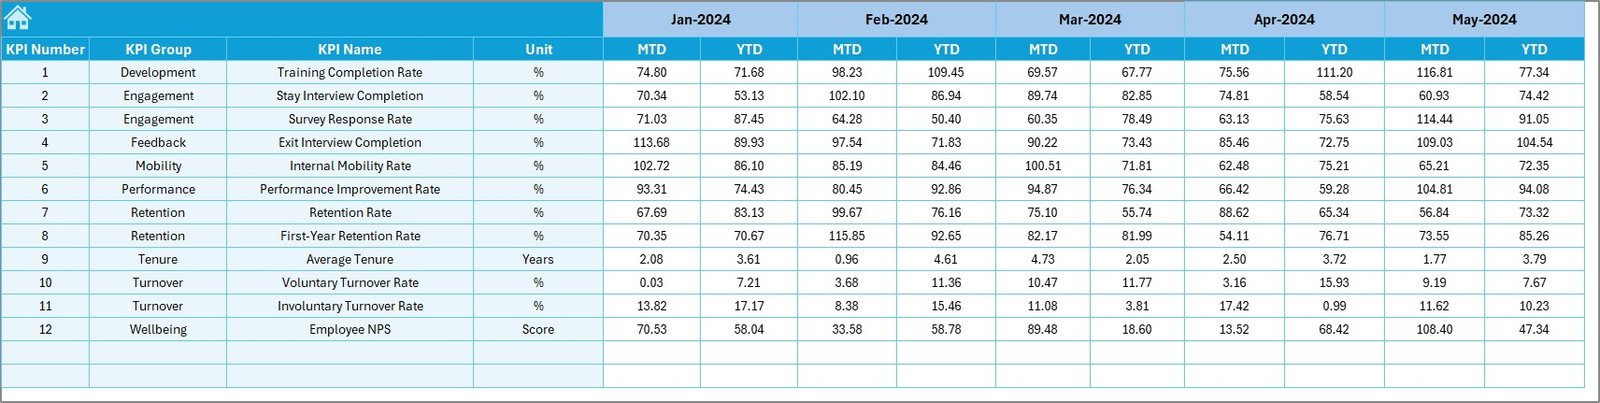
Previous Year Numbers
- Input last year’s figures in the same format as current year
KPI Definition Sheet
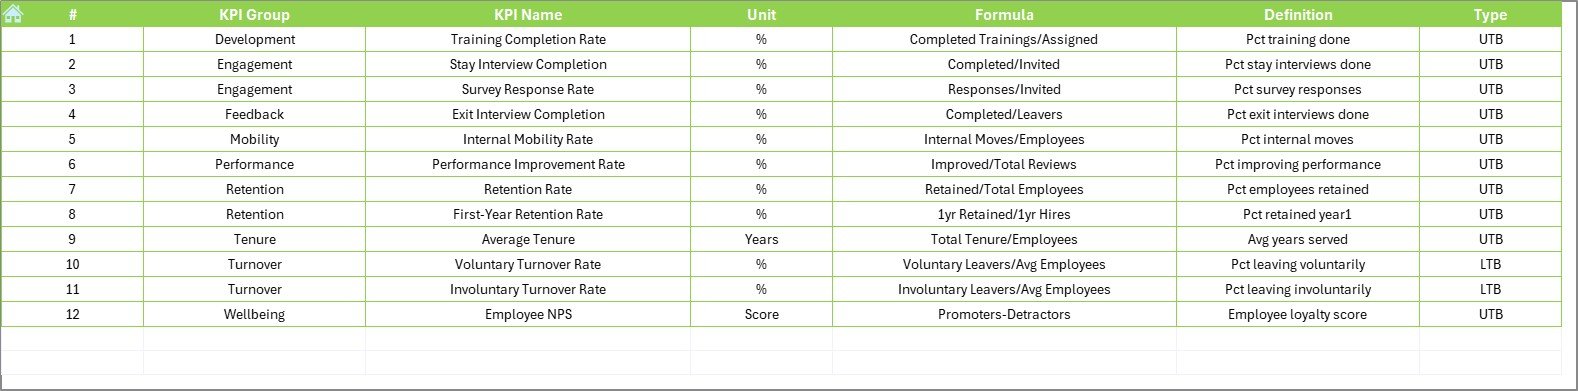
- Maintain a registry of KPI Name, Group, Unit, Formula, and Definition
How to Use the Dashboard Step by Step
Set Start Month
- On Actual Numbers Input, enter the first month of your fiscal year in cell E1.
- Populate Actuals
- Record your month’s MTD and cumulative YTD performance for each KPI.
- Enter Targets
- Switch to Target Sheet and type in MTD and YTD targets for each KPI.
- Log Previous Year Numbers
- Go to Previous Year Numbers and fill last year’s actuals.
- Review Definitions
- On KPI Definition, confirm that formulas and units match your business logic.
- Navigate Home
- Click any button on the Home Sheet to jump to the section you need.
- Analyze Trends
- In Dashboard, select a month from the drop-down at cell D3.
- Watch how charts and conditional formatting update in real time.
- Deep Dive
- Go to KPI Trend. Pick a KPI and view its monthly trajectory.
Advantages of Retail and E-commerce Employee Retention KPI Dashboard
-
Instant Visibility. You grasp performance across all KPIs at a glance.
-
Data-Driven Decisions. You base strategy on hard numbers, not hunches.
-
Customizable. Modify or add KPIs to suit your unique business needs.
-
Time Savings. Automated charts and formulas free you from manual reports.
-
Consistent Reporting. Standardized sheets ensure everyone uses the same metrics.
-
Scalable Design. From small boutiques to large online retailers, the template adapts.
Best Practices for the Retail and E-commerce Employee Retention KPI Dashboard
-
Define Clear Formulas. Make sure each KPI’s formula matches how you calculate metrics in payroll or HRIS systems.
-
Use Consistent Data Sources. Pull actuals, targets, and previous-year data from the same database or master spreadsheet.
-
Refresh Monthly. Set a calendar reminder to update actual and target sheets at month’s end.
-
Validate Inputs. Use data validation on input sheets to reduce manual entry errors.
-
Lock Formulas. Protect formula cells to prevent accidental overwrites.
-
Document Changes. Keep a change log on a hidden sheet whenever you adjust definitions or formulas.
-
Train Stakeholders. Run a quick training session for HR and operations teams so everyone understands how to use the dashboard.
-
Review Trends Regularly. Schedule quarterly review meetings to discuss long-term retention trends.
-
Customize Visuals. Adjust chart types (bar, line, area) to highlight the insights you need.
-
Archive Snapshots. Save a copy of your dashboard each year for historical comparison.
How to Interpret Key Metrics
-
Voluntary Turnover Rate
High voluntary turnover signals low job satisfaction or weak engagement programs. -
Average Employee Tenure
Rising tenure indicates strong retention but may also hide promotion bottlenecks. -
Absentee Rate
Sudden spikes in absenteeism often precede turnover or morale issues. -
Engagement Score
Low engagement correlates with poor customer service and higher churn. -
Cost per Hire
Rising costs suggest that your employer brand or recruiting channels need review.
Conclusion
By implementing our Retail and E-commerce Employee Retention KPI Dashboard in Excel, you gain a powerful tool to track, analyze, and improve your workforce stability. You’ll save time on monthly reporting, gain clear insights into turnover and engagement, and make data-driven decisions that boost morale and profits. Download the template, follow the best practices outlined above, and start driving better retention today!
Click to Purchases Retail and E-commerce Employee Retention KPI Dashboard in Excel
Visit our YouTube channel to learn step-by-step video tutorials