In the fast-paced world of retail, having a clear and real-time view of your inventory metrics is crucial. If you’re tired of juggling spreadsheets and struggling to interpret scattered data, it’s time to embrace the power of Power BI. This article covers everything you need to know about creating, using, and benefiting from a Retail Inventory KPI Dashboard in Power BI.
Let’s dive in and discover how you can stay ahead of inventory issues, track performance over time, and make better decisions, all in one place.
Click to Purchases Retail Inventory KPI Dashboard in Power BI
What Is a Retail Inventory KPI Dashboard in Power BI?
A Retail Inventory KPI Dashboard in Power BI is an interactive, visual reporting solution that allows retail businesses to monitor inventory-related KPIs (Key Performance Indicators) efficiently. It brings your data to life with slicers, charts, and status icons that quickly show where your performance stands.
Instead of manually comparing monthly and yearly numbers, the dashboard automates everything and presents it in a sleek, user-friendly format.
Key Features of the Retail Inventory KPI Dashboard
The dashboard consists of three main pages in the Power BI file. Each page offers unique insights and functionalities:
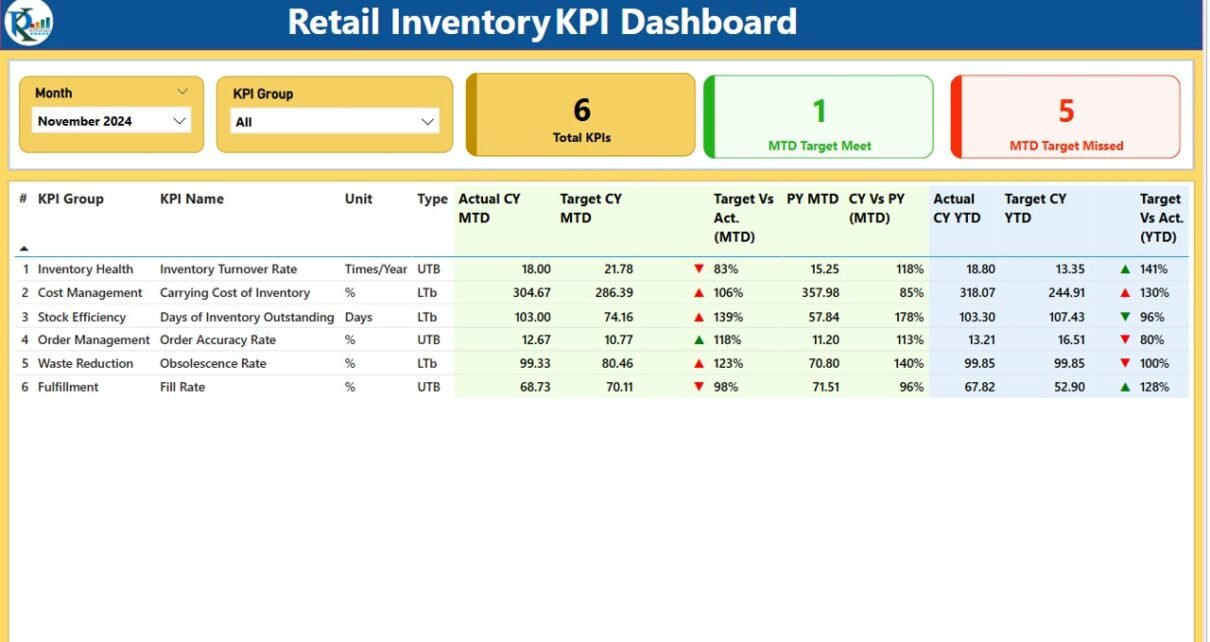
Summary Page
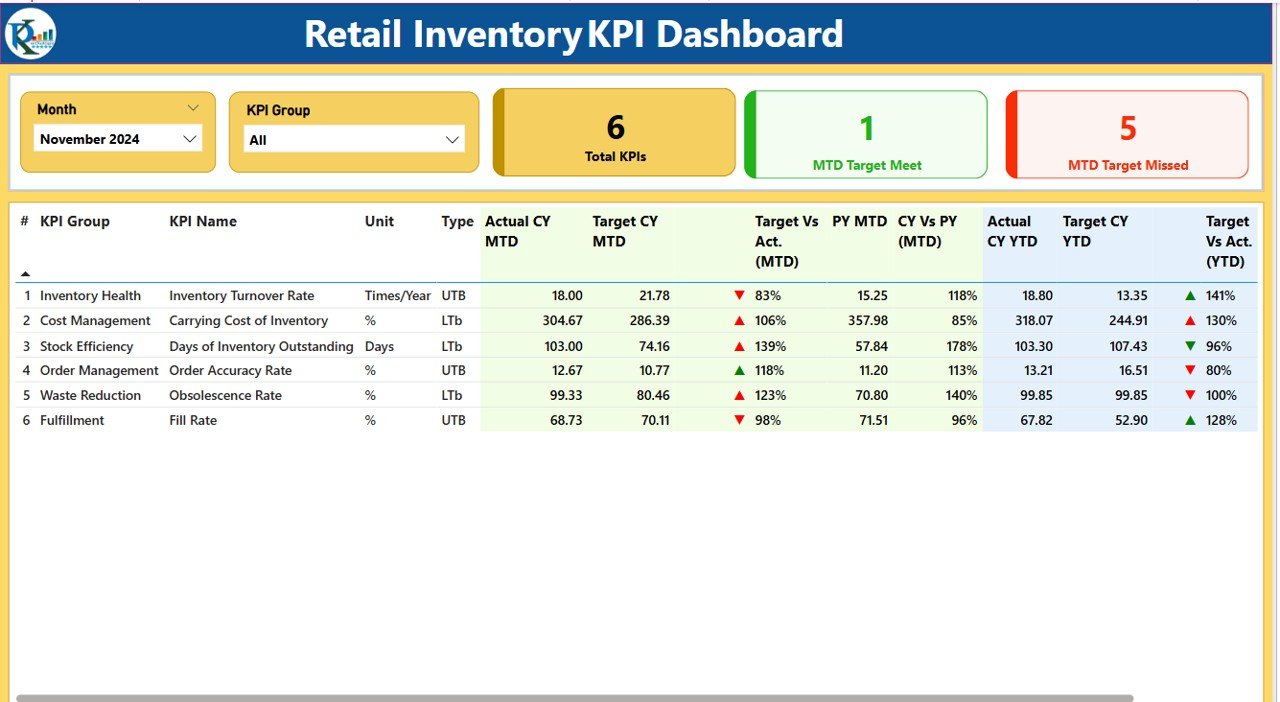
This is the control center of your inventory performance. At a glance, you can:
- Use slicers to filter by Month and KPI Group
Click to Purchases Retail Inventory KPI Dashboard in Power BI
View important summary cards:
- Total KPIs
- MTD Target Met
- MTD Target Missed
- Explore a detailed KPI performance table with the following data:
KPI Trend Page
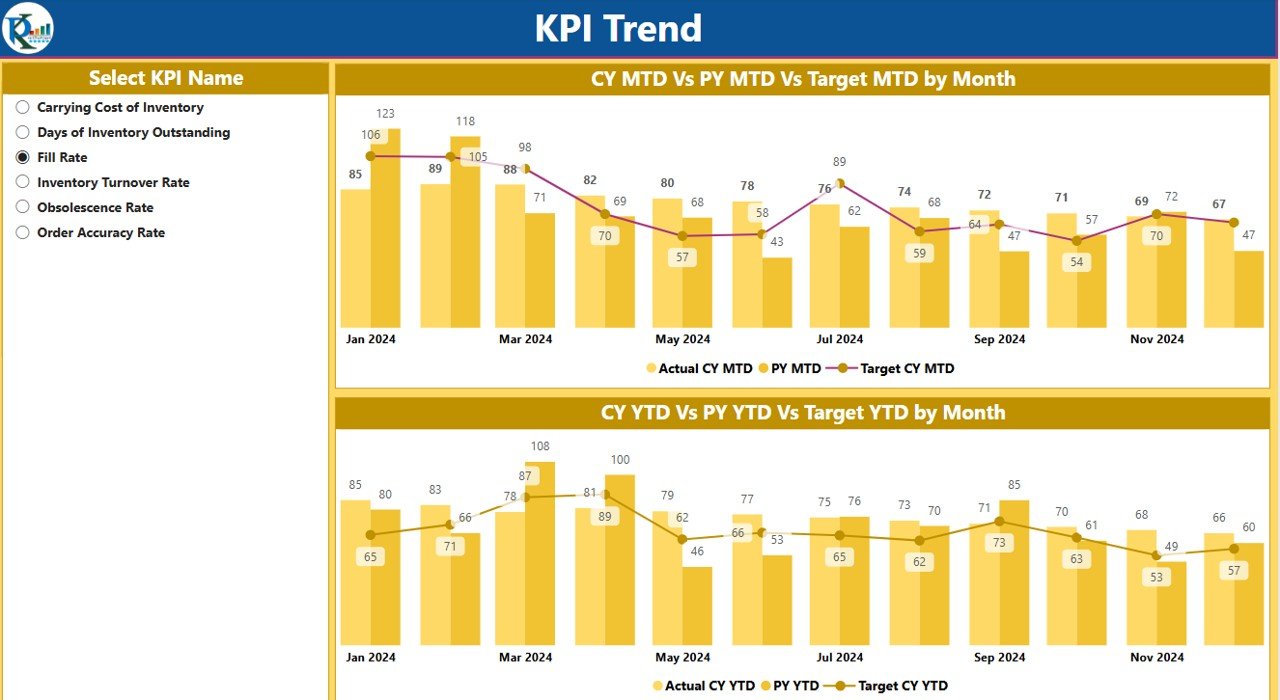
This page provides visual clarity with:
Combo charts that compare:
- MTD actuals, targets, and previous year
- YTD actuals, targets, and previous year
- A KPI selector slicer on the left to drill into specific KPIs
KPI Definition Page (Drillthrough)
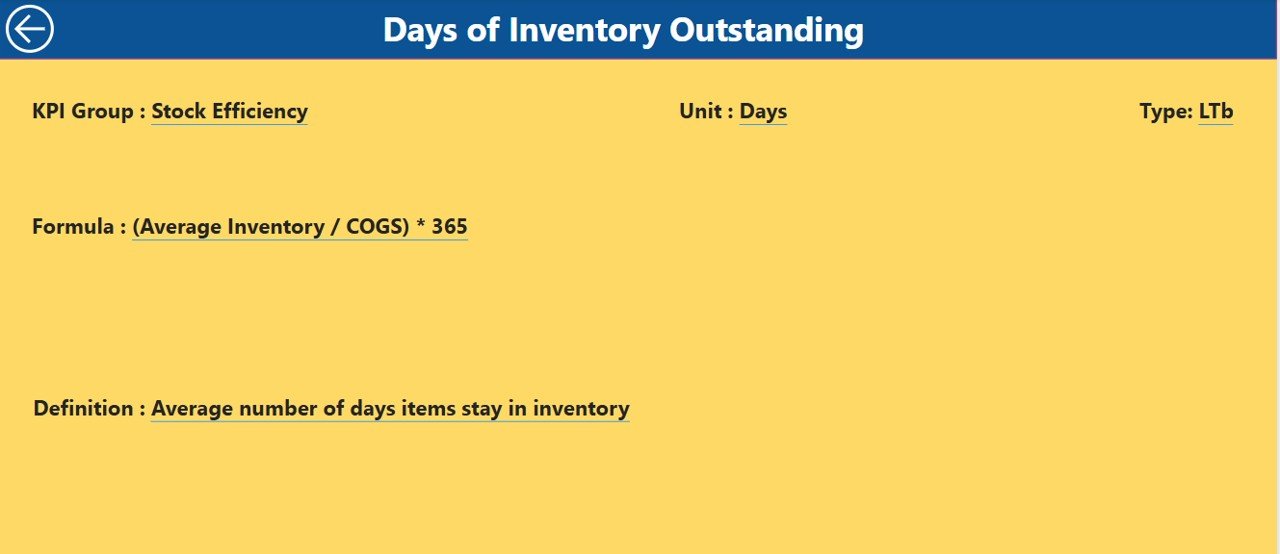
This hidden page allows you to view:
- The Formula used to calculate each KPI
- A clear Definition of each KPI
Access it by right-clicking on any KPI in the summary page and selecting Drillthrough.
How Is the Data Structured?
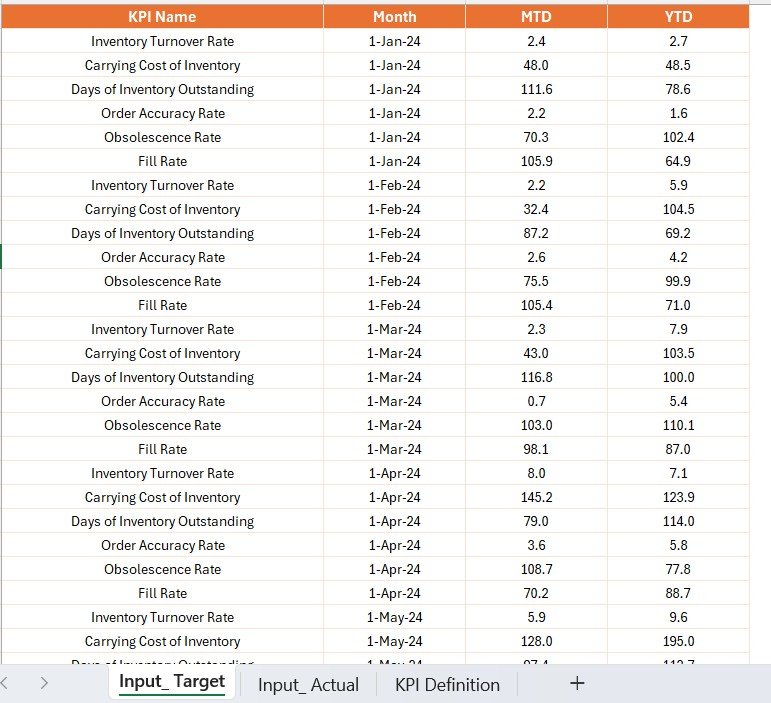
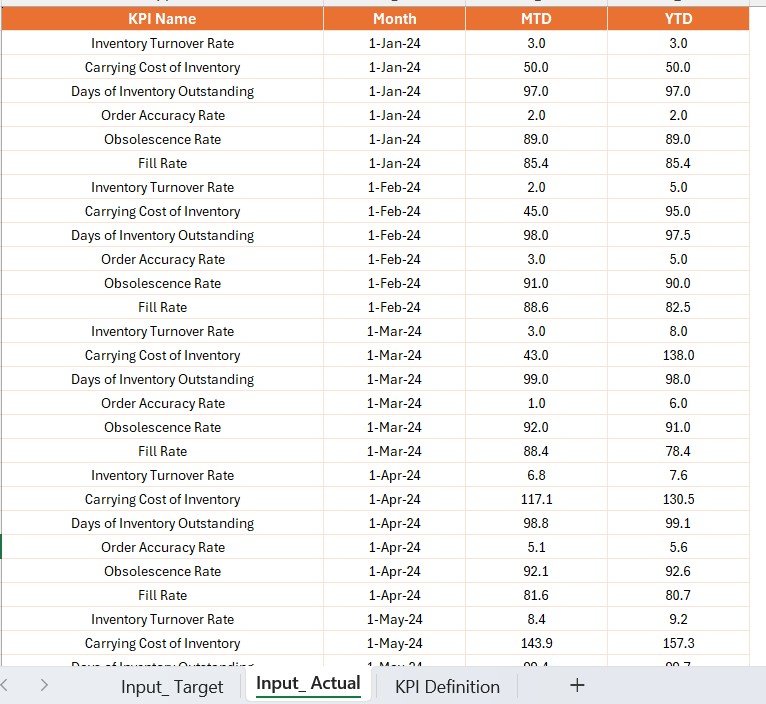
The source of this dashboard is an Excel workbook with three sheets:
1. Input_Actual
- Columns: KPI Name, Month (use the first date), MTD, YTD
- Enter real performance values here
2. Input_Target
- Columns: KPI Name, Month (first date), MTD, YTD
- Enter the target goals here
Click to Purchases Retail Inventory KPI Dashboard in Power BI
3. KPI Definition
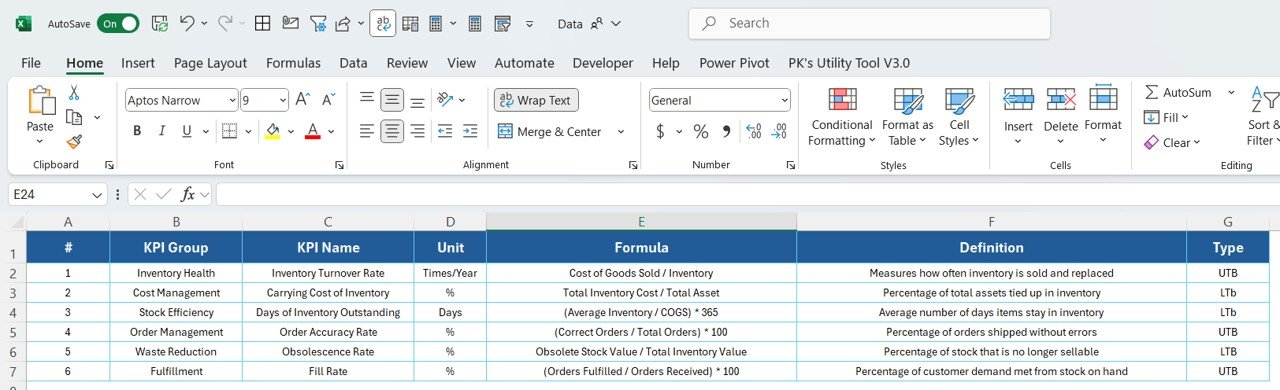
- Columns: KPI Number, Group, Name, Unit, Formula, Definition, Type (LTB/UTB)
This structured data feeds Power BI automatically and keeps everything dynamic.
Advantages of a Retail Inventory KPI Dashboard in Power BI
Using a Power BI inventory dashboard brings a long list of benefits. Here are some of the top reasons you should implement it:
✅ Real-Time Tracking
Quickly identify whether you are on track for your monthly or yearly inventory goals.
✅ Better Visibility
Make data-driven decisions by analyzing trends, gaps, and growth opportunities.
✅ Efficiency and Automation
No more manual updates. Just refresh the Excel data, and everything syncs automatically.
✅ KPI Drilldown
With drillthrough features, you can understand the story behind every number.
✅ Beautiful Visualizations
Interactive visuals, slicers, and icons make it easy to interpret data.
Best Practices for Building the Dashboard
To get the most value from your Power BI Retail Inventory Dashboard, follow these expert tips:
⚡ Keep Your Data Clean
Ensure consistency in KPI names and date formats. This reduces reporting errors.
⚡ Use Conditional Formatting
Apply red/green arrows and icons to quickly highlight good or bad performance.
⚡ Refresh Data Frequently
Set up scheduled refresh if connected to OneDrive or SharePoint.
⚡ Group KPIs Effectively
Categorize KPIs (e.g., Stock, Returns, Delivery) for better readability.
⚡ Use Tooltips for Definitions
Add tooltip visuals to make your dashboard user-friendly for new users.
Why Should Retailers Use This Dashboard?
If you’re in retail, you already know how inventory inefficiencies can drain your profits. This dashboard ensures:
- No KPI gets ignored
- Every metric is tracked in real-time
- Trends are clearly visible
In short, you gain complete control over your inventory operations.
Conclusion
The Retail Inventory KPI Dashboard in Power BI is more than a dashboard – it’s a management tool that gives retail teams the clarity they need to succeed. From visual summaries to granular drilldowns, this solution helps businesses optimize inventory management, improve decision-making, and stay competitive.
Whether you’re a small retailer or a large chain, this Power BI solution can scale with you and simplify your entire inventory monitoring process.
Frequently Asked Questions (FAQs)
Q1: What KPIs should I include in a retail inventory dashboard?
A: Some common ones are Stock Turnover Rate, Inventory Accuracy, Sell-Through Rate, Stock-Out Frequency, and Days of Inventory on Hand.
Q2: Can I use other data sources besides Excel?
A: Yes, Power BI allows connections to SQL Server, Google Sheets, cloud services like Azure, and many others.
Q3: How often should I update my inventory data?
A: Ideally, you should update it daily or at least weekly to get real-time insights.
Q4: What is the difference between MTD and YTD in KPI tracking?
A: MTD (Month-to-Date) tracks progress from the start of the current month, while YTD (Year-to-Date) tracks from the beginning of the year.
Q5: Can I share this dashboard with my team?
A: Absolutely. You can publish it on Power BI Service and share it with team members using workspace permissions.
Click to Purchases Retail Inventory KPI Dashboard in Power BI
Visit our YouTube channel to learn step-by-step video tutorials