Managing a retail supply chain without clear visibility always creates delays, cost overruns, and poor customer experiences. Retail organizations handle procurement, inventory, logistics, warehousing, and store replenishment daily. Therefore, tracking performance using scattered Excel files or manual reports quickly becomes inefficient.
That is exactly where a Retail Supply Chain KPI Dashboard in Excel becomes a powerful and practical solution.
In this detailed guide, you will learn what a Retail Supply Chain KPI Dashboard in Excel is, why businesses need it, how it works, its worksheet-wise structure, key features, advantages, best practices, and frequently asked questions. Moreover, the explanations remain simple, actionable, and easy to implement for real business use.
Click to Purchases Retail Supply Chain KPI Dashboard in Excel
What Is a Retail Supply Chain KPI Dashboard in Excel?
A Retail Supply Chain KPI Dashboard in Excel is a centralized performance monitoring tool that tracks key metrics related to procurement, inventory management, logistics, warehousing, order fulfillment, and distribution.
Instead of analyzing multiple reports separately, this dashboard brings all KPIs into one interactive Excel file. As a result, supply chain teams gain instant visibility into operational efficiency, cost control, and service levels.
Because the dashboard is built in Microsoft Excel, it offers flexibility, affordability, and ease of use. Moreover, users can update data quickly and view real-time KPI performance without advanced technical skills.
Why Do Retail Businesses Need a Supply Chain KPI Dashboard?
Retail supply chains involve multiple moving parts. However, without structured KPIs, organizations struggle to identify issues early.
Here is why retailers need a KPI dashboard:
-
Inventory levels fluctuate daily
-
Supplier delays impact store availability
-
Logistics costs rise without warning
-
Stockouts reduce customer satisfaction
-
Excess inventory blocks working capital
Therefore, a Retail Supply Chain KPI Dashboard in Excel helps retailers track performance consistently and make faster, data-driven decisions.
Key Objectives of a Retail Supply Chain KPI Dashboard
Before using the dashboard, it is important to understand its core objectives:
-
Monitor supply chain performance in one place
-
Compare actual vs target results monthly
-
Analyze trends using MTD and YTD values
-
Identify bottlenecks in procurement and logistics
-
Improve inventory turnover and fulfillment speed
-
Support strategic and operational decision-making
Key Features of the Retail Supply Chain KPI Dashboard in Excel
This ready-to-use Retail Supply Chain KPI Dashboard comes with a structured design and powerful analysis capabilities. Below are its major features explained clearly.
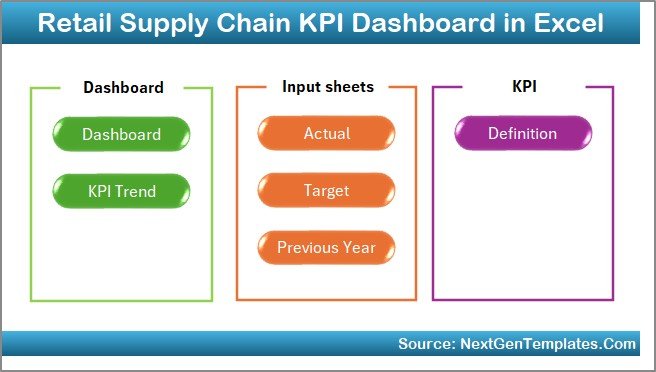
Worksheet Structure of the Retail Supply Chain KPI Dashboard in Excel
The dashboard contains 7 well-organized worksheets, each designed for a specific purpose.
Click to Purchases Retail Supply Chain KPI Dashboard in Excel
1. Home Sheet (Navigation Index)
The Home sheet acts as an index and navigation panel.
Key Highlights of the Home Sheet:
-
Clean and user-friendly layout
-
6 navigation buttons
-
One-click jump to any worksheet
-
Improves usability and navigation speed
As a result, users can move across the dashboard without scrolling or searching manually.
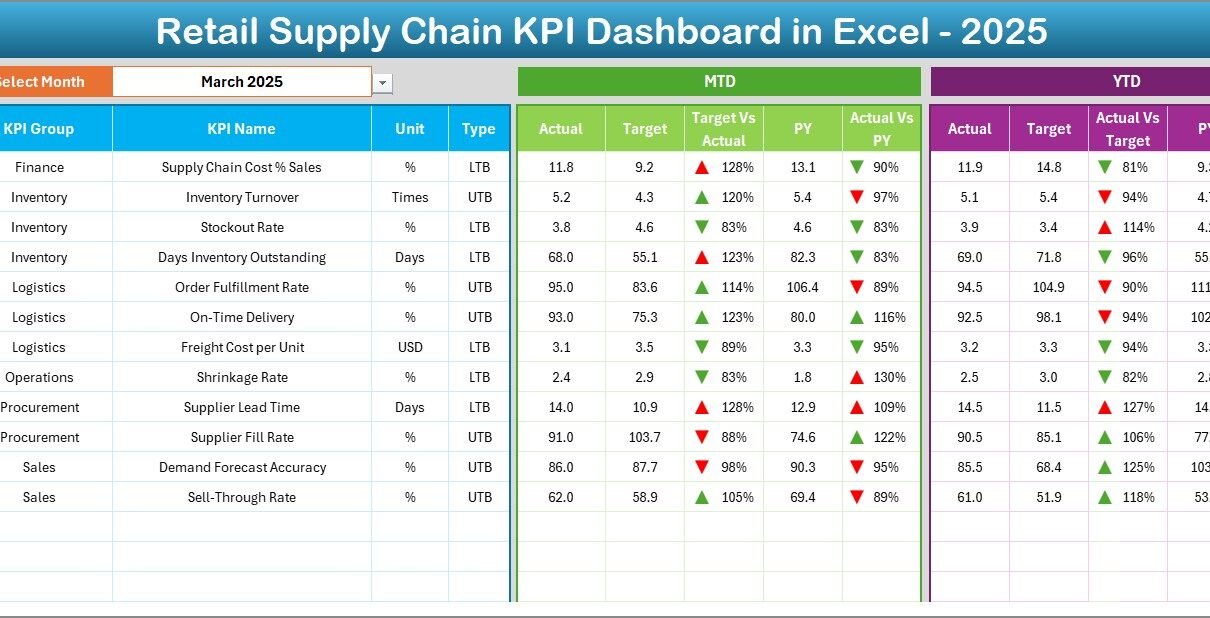
2. Dashboard Sheet Tab (Main KPI Summary)
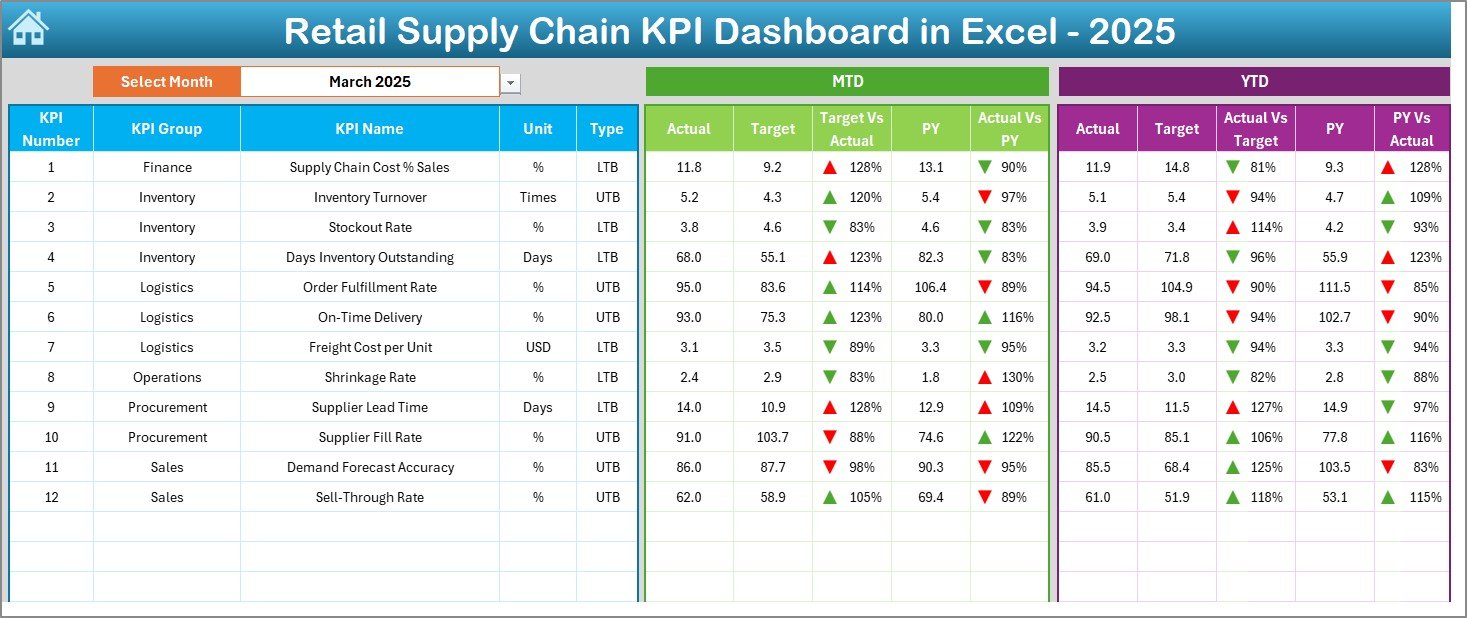
The Dashboard sheet is the heart of the entire KPI dashboard.
What Does This Sheet Show?
-
All supply chain KPIs in one view
-
Month selection drop-down at cell D3
-
Automatic refresh of all numbers when the month changes
KPI Metrics Displayed:
-
MTD Actual
-
MTD Target
-
MTD Previous Year (PY)
-
Target vs Actual variance
-
PY vs Actual variance
Additionally, the dashboard shows:
-
YTD Actual
-
YTD Target
-
YTD Previous Year (PY)
Visual Enhancements:
-
Conditional formatting arrows
-
Green arrows for improvement
-
Red arrows for decline
Therefore, users instantly understand performance without reading raw numbers.
Click to Purchases Retail Supply Chain KPI Dashboard in Excel
3. KPI Trend Sheet Tab (Detailed KPI Analysis)
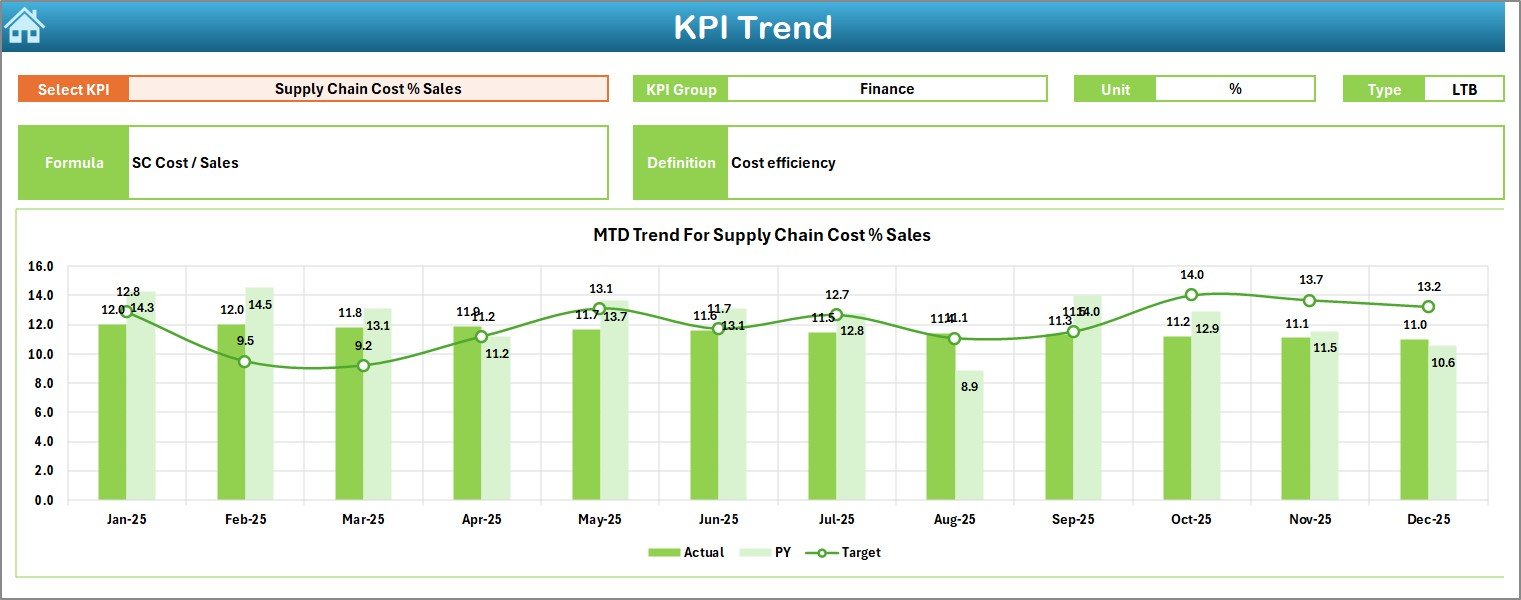
The KPI Trend sheet provides deep insights into individual KPIs.
How This Sheet Works:
-
KPI selection drop-down at cell C3
-
Automatic display of KPI details
KPI Information Displayed:
-
KPI Group
-
KPI Unit
-
KPI Type (Lower the Better / Upper the Better)
-
KPI Formula
-
KPI Definition
Charts Included:
-
MTD trend chart
-
YTD trend chart
-
Actual vs Target vs Previous Year comparison
As a result, users easily identify performance patterns and seasonal trends.
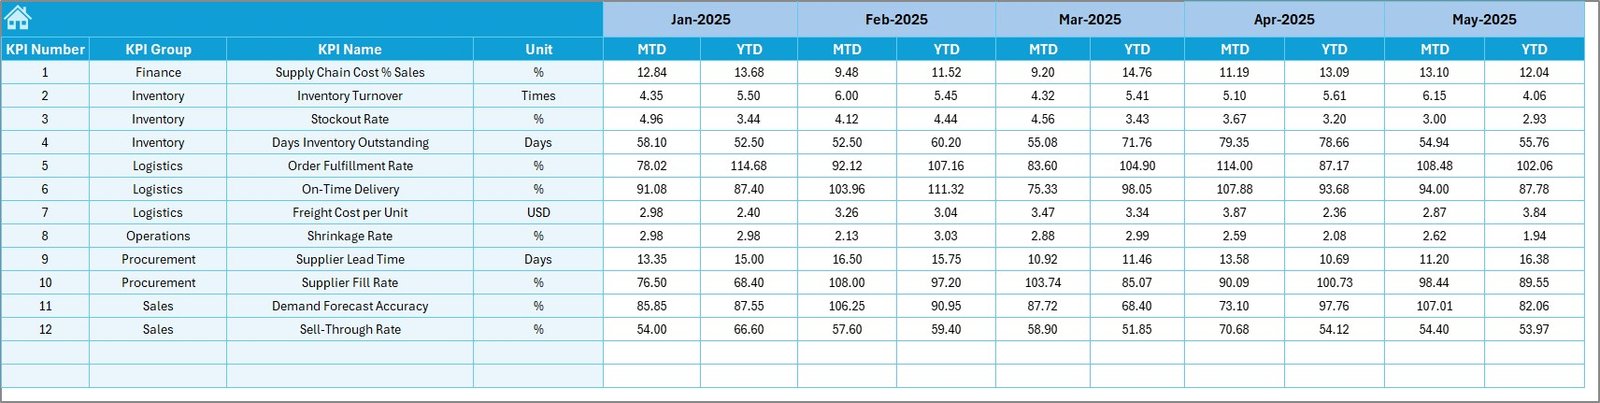
4. Actual Numbers Input Sheet
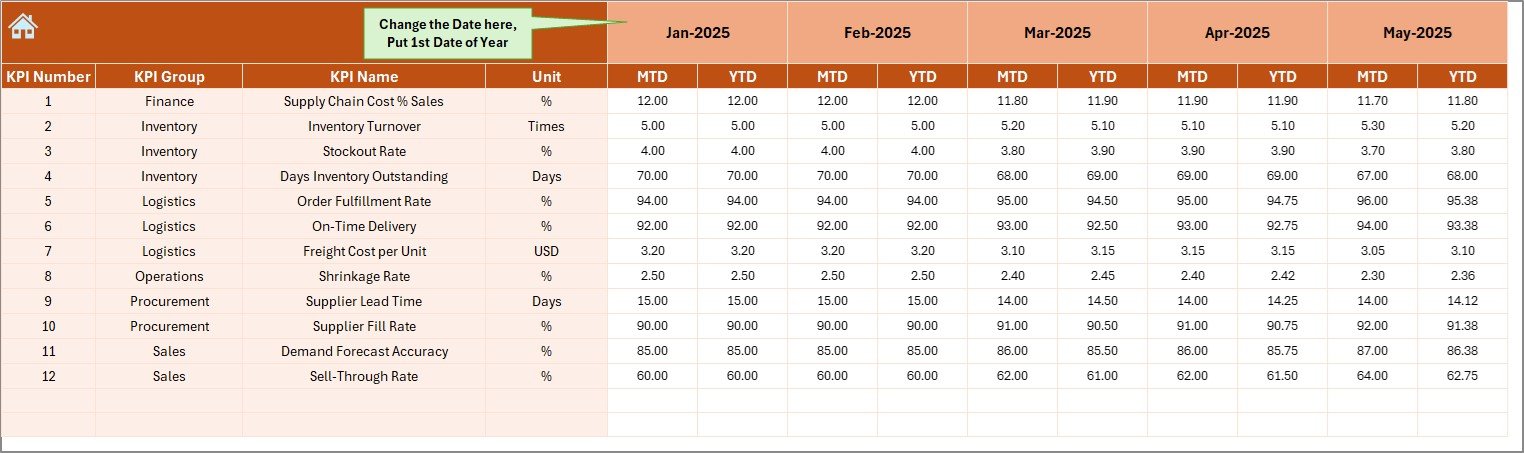
The Actual Numbers Input sheet captures real operational data.
Key Inputs:
-
Monthly MTD Actual values
-
Monthly YTD Actual values
Dynamic Month Control:
-
Change the reporting month using cell E1
-
Enter the first month of the financial year once
-
All calculations update automatically
This approach ensures flexibility and accuracy throughout the year.
Click to Purchases Retail Supply Chain KPI Dashboard in Excel
5. Target Sheet Tab
The Target sheet defines performance expectations.
What Users Enter Here:
-
Monthly MTD Target values
-
Monthly YTD Target values
-
KPI-wise targets for all supply chain metrics
Because targets remain separate from actual data, tracking becomes more transparent and structured.
6. Previous Year Number Sheet Tab
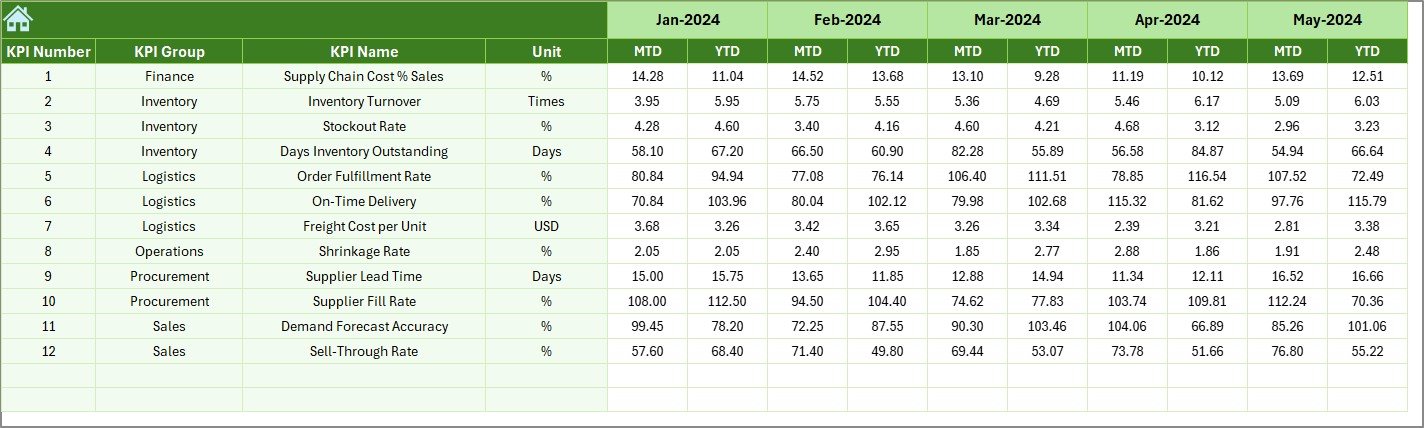
The Previous Year Numbers sheet allows year-over-year comparison.
Key Benefits:
-
Enter last year’s MTD values
-
Enter last year’s YTD values
-
Enable historical performance analysis
As a result, teams can measure growth, efficiency, and improvement accurately.
7. KPI Definition Sheet Tab
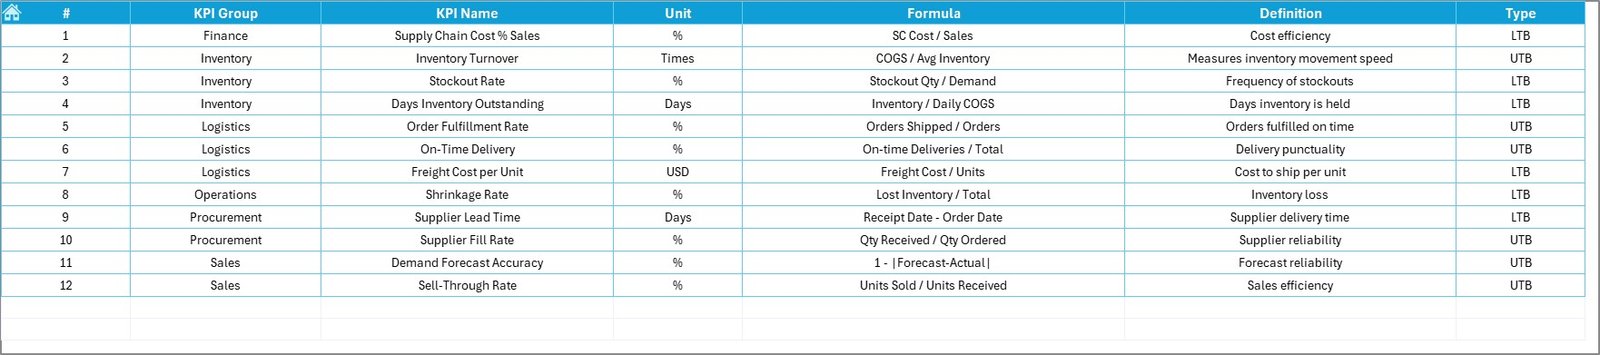
The KPI Definition sheet documents all KPIs clearly.
Information Captured:
-
KPI Name
-
KPI Group
-
Unit of Measurement
-
KPI Formula
-
KPI Definition
This sheet acts as a reference guide for users and ensures consistent understanding across teams.
What KPIs Can Be Tracked in a Retail Supply Chain Dashboard?
A Retail Supply Chain KPI Dashboard typically tracks KPIs across multiple areas:
Procurement KPIs
-
Supplier On-Time Delivery %
-
Purchase Order Cycle Time
-
Supplier Defect Rate
Inventory KPIs
-
Inventory Turnover
-
Stockout Rate
-
Excess Inventory Value
Logistics KPIs
-
Transportation Cost per Unit
-
On-Time Shipment Rate
-
Order Fulfillment Cycle Time
Warehouse KPIs
-
Order Picking Accuracy
-
Warehouse Utilization
-
Average Handling Time
Advantages of Retail Supply Chain KPI Dashboard in Excel
Click to Purchases Retail Supply Chain KPI Dashboard in Excel
Using a Retail Supply Chain KPI Dashboard in Excel offers several clear advantages.
1. Centralized Performance Monitoring
All supply chain KPIs appear in one dashboard. Therefore, teams save time and reduce confusion.
2. Faster Decision-Making
Because the dashboard updates instantly, managers react quickly to delays and inefficiencies.
3. Improved Inventory Control
Clear MTD and YTD tracking helps avoid stockouts and overstocking.
4. Cost Optimization
Logistics, procurement, and warehousing costs become transparent and manageable.
5. Easy Customization
Excel allows users to add KPIs, adjust targets, and modify layouts easily.
6. No Advanced Tools Required
The dashboard works entirely in Excel, so no expensive software or coding skills are needed.
Best Practices for Retail Supply Chain KPI Dashboard in Excel
To get the best results, follow these proven best practices.
Keep KPIs Relevant
Track only KPIs that align with retail supply chain goals.
Update Data Regularly
Ensure actual, target, and previous year data remains current.
Use Clear KPI Definitions
Maintain a well-documented KPI Definition sheet to avoid confusion.
Review Trends Monthly
Analyze MTD and YTD trends consistently rather than focusing on one month.
Align Targets with Business Goals
Set realistic and measurable targets for each KPI.
Train Users
Ensure all stakeholders understand how to use and interpret the dashboard.
Click to Purchases Retail Supply Chain KPI Dashboard in Excel
Who Can Use a Retail Supply Chain KPI Dashboard?
This dashboard suits a wide range of professionals:
-
Retail supply chain managers
-
Inventory planners
-
Procurement teams
-
Logistics managers
-
Operations heads
-
Business analysts
-
Retail executives
How Does This Dashboard Improve Retail Operations?
The dashboard improves retail operations by:
-
Reducing manual reporting effort
-
Improving forecast accuracy
-
Enhancing supplier performance tracking
-
Increasing order fulfillment efficiency
-
Supporting strategic planning
As a result, retailers gain a competitive advantage.
Conclusion
A Retail Supply Chain KPI Dashboard in Excel transforms raw operational data into meaningful insights. Instead of relying on disconnected spreadsheets, retail teams gain a single, structured, and interactive performance view.
With features like MTD and YTD tracking, target comparison, KPI trends, and clear definitions, this dashboard supports smarter decisions, better inventory control, and improved customer satisfaction.
If your retail organization wants clarity, control, and consistency, this dashboard is an essential tool.
Click to Purchases Retail Supply Chain KPI Dashboard in Excel
Frequently Asked Questions (FAQs)
What is a Retail Supply Chain KPI Dashboard in Excel?
It is an Excel-based dashboard that tracks supply chain performance using predefined KPIs with MTD, YTD, target, and previous year comparisons.
Can I customize the KPIs?
Yes, Excel allows full customization of KPIs, targets, and formats.
Do I need advanced Excel skills to use it?
No, basic Excel knowledge is sufficient to update and analyze the dashboard.
How often should I update the data?
You should update actual data monthly or weekly, depending on business needs.
Can this dashboard support multiple retail locations?
Yes, you can extend it by adding location-wise data or filters.
Is this dashboard suitable for small retailers?
Yes, it works for small, medium, and large retail businesses.
Click to Purchases Retail Supply Chain KPI Dashboard in Excel
Visit our YouTube channel to learn step-by-step video tutorials