Road and highway construction projects require continuous monitoring, quick decision-making, and tight control over performance. You manage project timelines, labor hours, material usage, safety performance, machinery efficiency, budget utilization, and quality checks every single day. Because construction projects involve thousands of data points, teams often struggle to organize everything manually. Excel files, paper logs, and scattered reports make it even harder.
A Road and Highway Construction KPI Dashboard in Excel solves this problem instantly. It brings all key performance indicators (KPIs) into one easy-to-use dashboard. You can track Month-to-Date (MTD) numbers, Year-to-Date (YTD) results, targets, and Previous Year (PY) performance in a clear and visual way. The dashboard also helps you analyze trends, update data quickly, and maintain full visibility of every construction activity.
In this complete guide, you will learn how the dashboard works, the purpose of each worksheet, how to update the data, and why this tool becomes essential for project managers, engineers, and construction firms.
Click to Purchases Road and Highway Construction KPI Dashboard in Excel
What Is a Road and Highway Construction KPI Dashboard in Excel?
A Road and Highway Construction KPI Dashboard in Excel is a ready-to-use performance monitoring tool created for infrastructure companies, road contractors, government agencies, engineering teams, and project consultants. It tracks all essential KPIs related to:
-
Road construction progress
-
Equipment utilization
-
Safety and compliance
-
Material consumption
-
Cost and budget
-
Quality inspections
-
Workforce efficiency
-
Delays and project risks
Because the dashboard runs inside Excel, you can update data easily and generate automatic results for each KPI.
This dashboard includes seven important sheets that help you track and manage every aspect of your project.
Click to Purchases Road and Highway Construction KPI Dashboard in Excel
Why Do Road Construction Projects Need a KPI Dashboard?
Road and highway construction is complex. Without a proper dashboard:
-
You struggle to track daily or monthly progress.
-
You miss delays until the last moment.
-
You cannot monitor material wastage correctly.
-
You fail to check contractor performance.
-
You lose control over budget and costs.
-
You waste time preparing manual reports.
However, when you use a KPI dashboard:
-
You see real-time performance.
-
You compare actuals vs targets anytime.
-
You reduce delays.
-
You improve productivity.
-
You strengthen decision-making.
-
You create accurate monthly and yearly reports within seconds.
This dashboard gives you complete clarity and full project control.
Click to Purchases Road and Highway Construction KPI Dashboard in Excel
Key Features of the Road and Highway Construction KPI Dashboard
This dashboard contains 7 important worksheets. Each sheet plays a unique role in tracking, updating, and analyzing KPIs.
1. Home Sheet – Quick Navigation for Users
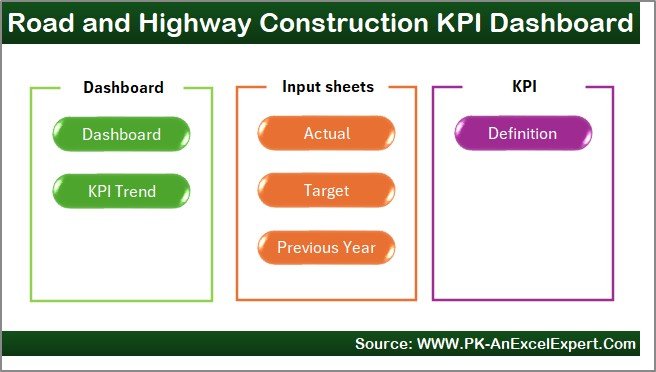
The Home sheet works like an index page. It contains six important buttons, and each button opens a specific worksheet.
These buttons provide access to:
-
Dashboard
-
KPI Trend
-
Actual Numbers Input
-
Target Sheet
-
Previous Year Numbers
-
KPI Definition
This makes the entire system easy to use, even for team members with basic Excel knowledge.
2. Dashboard Sheet – Complete KPI Overview
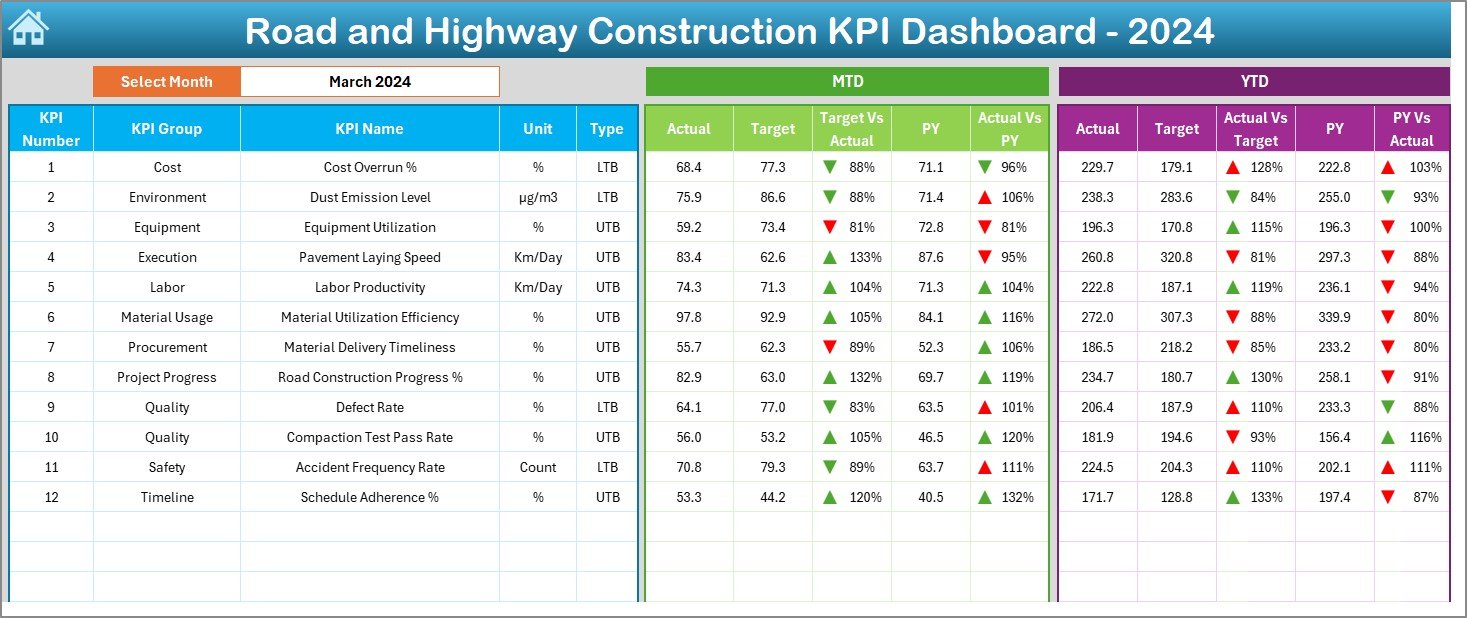
This sheet displays all major KPIs with full monthly and yearly comparison.
Key Highlights of the Dashboard Sheet
✔ Month Selector in Cell D3
Select a month from the dropdown.
The dashboard recalculates all KPIs instantly.
✔ MTD Actual, Target, and Previous Year Values
This section shows:
-
Actual MTD Value
-
MTD Target
-
MTD Previous Year
These values allow you to compare progress.
✔ Target vs Actual (MTD)
Shows performance using:
-
Green upward arrow = Better performance
-
Red downward arrow = Needs improvement
✔ PY vs Actual (MTD)
Shows current MTD vs last year’s MTD.
✔ YTD Actual, Target, and Previous Year Values
You also see:
-
YTD Actual Numbers
-
YTD Target
-
YTD PY Numbers
These values give the yearly progress in a clear way.
✔ Target vs Actual (YTD)
Indicates overall achievement for the year.
✔ PY vs Actual (YTD)
Helps you understand yearly improvement.
This dashboard sheet becomes the main view for:
-
Project Directors
-
Project Managers
-
Site Engineers
-
Consultants
-
Contractors
-
Monitoring and Evaluation Teams
They can see the full picture in seconds.
Click to Purchases Road and Highway Construction KPI Dashboard in Excel
3. KPI Trend Sheet – Analyze MTD and YTD Movement
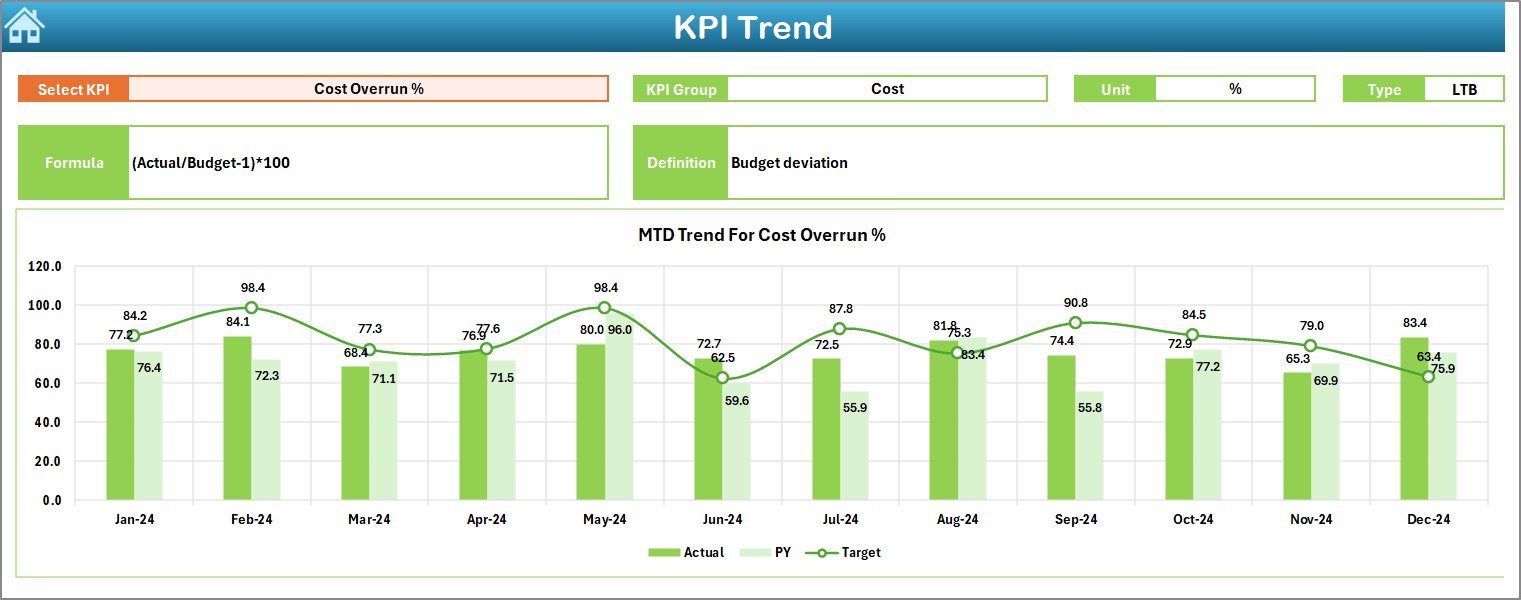
This sheet helps you study long-term trends for each KPI.
When You Select a KPI Name from Cell C3:
You immediately see:
-
KPI Group
-
KPI Unit
-
KPI Type (LTB or UTB)
-
KPI Formula
-
KPI Definition
These details help you understand exactly what the KPI means and how it is calculated.
Trend Charts on This Sheet
You see two combo charts:
✔ MTD Trend Chart
Compares:
-
Actual MTD
-
Target MTD
-
Previous Year MTD
✔ YTD Trend Chart
Compares:
-
Actual YTD
-
Target YTD
-
Previous Year YTD
These trend charts help you identify:
-
Slowing progress
-
Cost overruns
-
Delay patterns
-
Safety issues
-
Productivity gaps
As a result, project managers take action on time.
Click to Purchases Road and Highway Construction KPI Dashboard in Excel
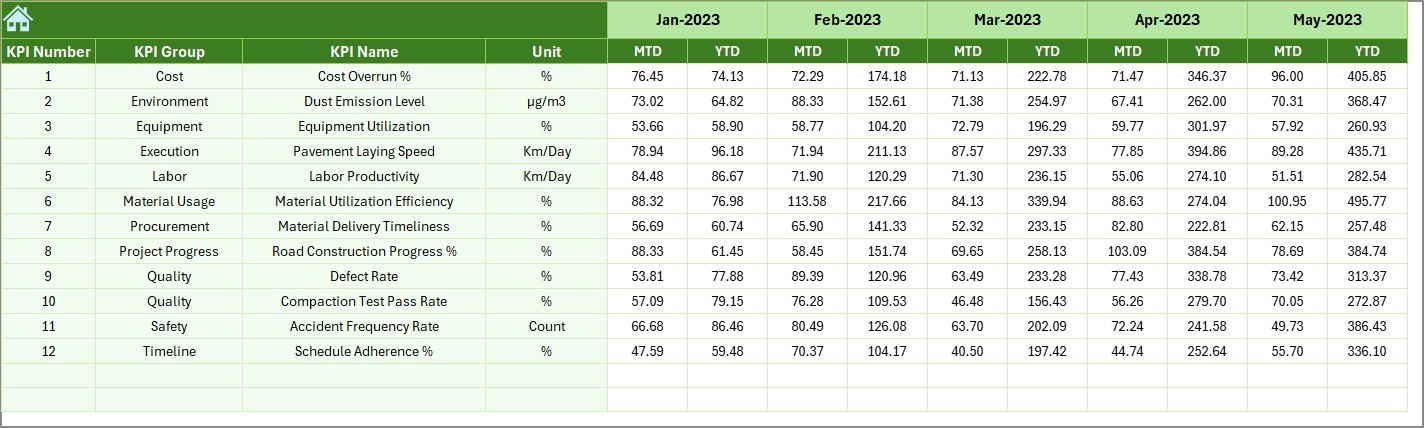
4. Actual Numbers Input Sheet – Enter Monthly Actuals
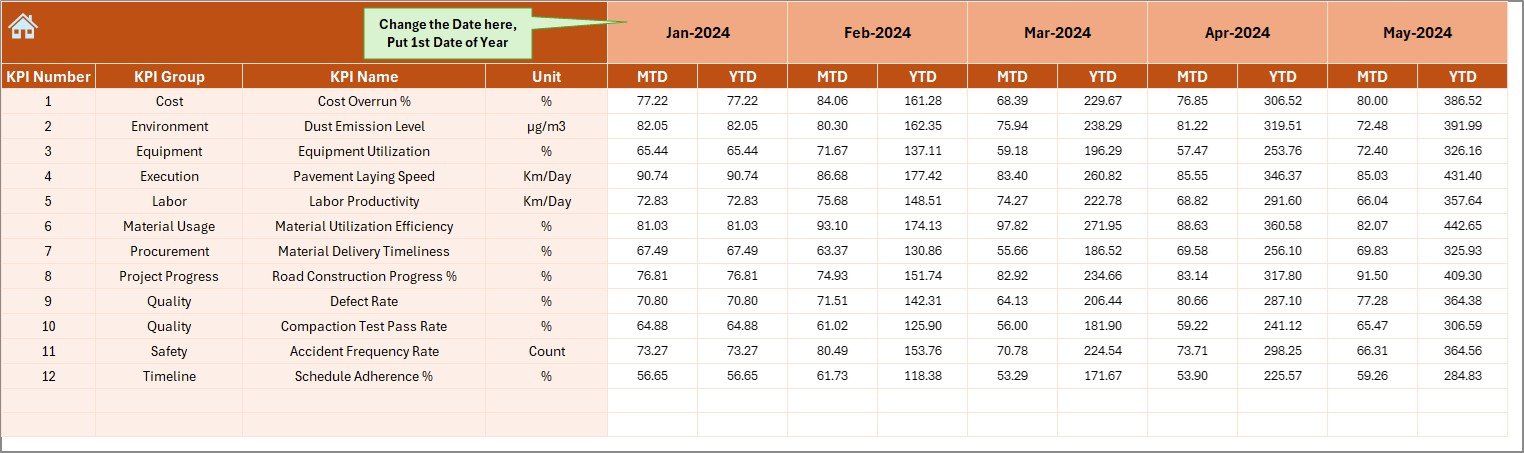
This sheet is the data input area for all actual numbers.
You enter:
-
KPI Name
-
Month
-
MTD Value
-
YTD Value
✔ Month Selector (Cell E1)
You select the first month of the year to set the reporting period.
All calculations automatically adjust.
Click to Purchases Road and Highway Construction KPI Dashboard in Excel
5. Target Sheet – Enter Monthly and Yearly Targets
This sheet stores:
-
KPI Target MTD
-
KPI Target YTD
-
KPI Name
-
Month
Target values help the dashboard compare performance instantly.
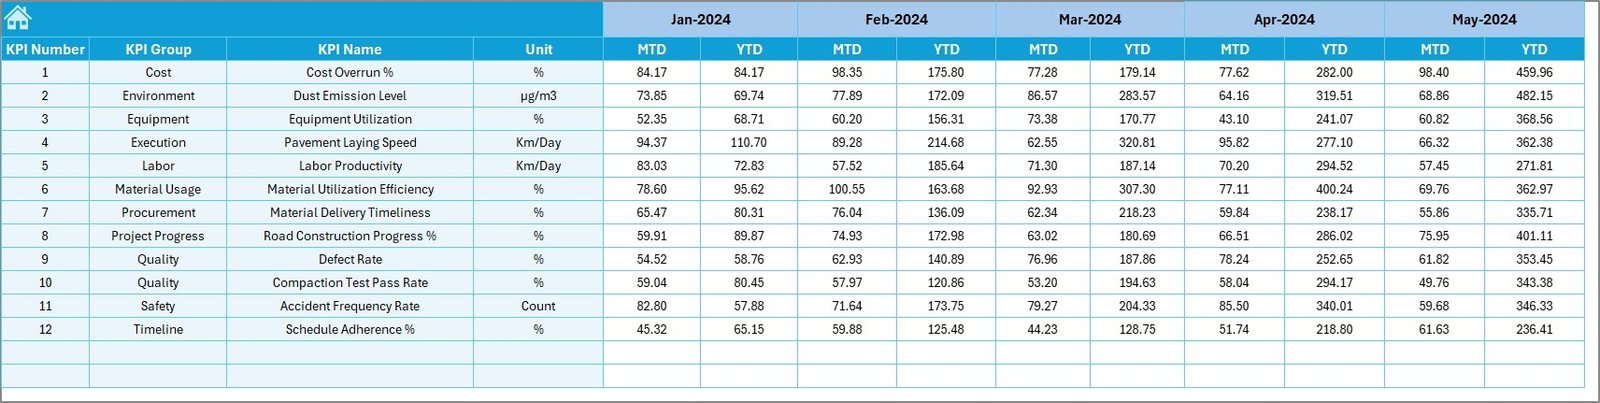
6. Previous Year Numbers Sheet – Historical Performance
This sheet keeps the last year’s actual numbers in the same format as the current year.
The dashboard uses this data for:
-
MTD PY vs CY
-
YTD PY vs CY
-
Year-over-year analysis
This helps identify long-term improvement or decline.
Click to Purchases Road and Highway Construction KPI Dashboard in Excel
7. KPI Definition Sheet – Master KPI Information
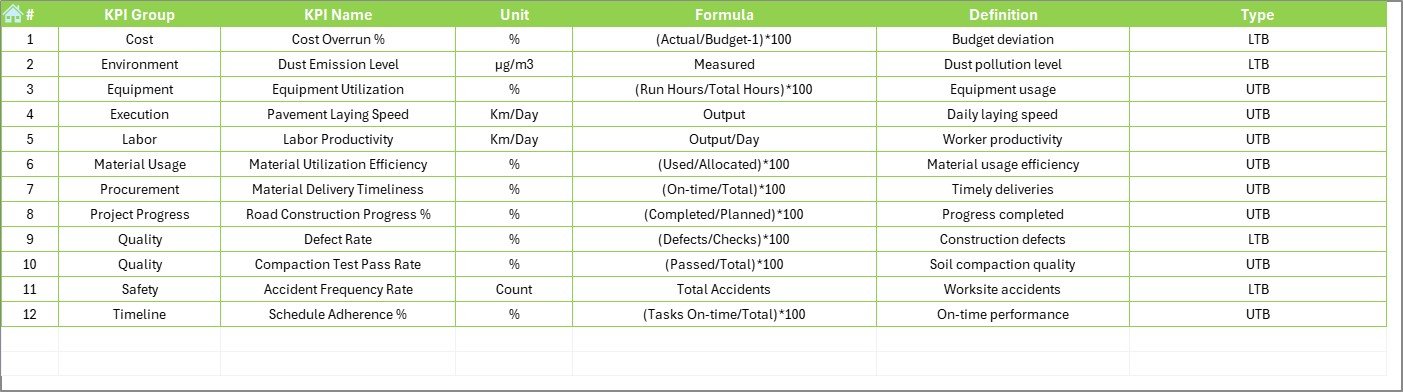
You enter:
-
KPI Name
-
KPI Group
-
KPI Unit
-
KPI Type
-
KPI Formula
-
KPI Definition
This sheet ensures that:
-
All KPIs follow the same calculation logic
-
Everyone in the team understands each KPI clearly
-
Reporting remains consistent
Advantages of the Road and Highway Construction KPI Dashboard in Excel
This dashboard brings many benefits for infrastructure teams and construction firms.
1. You track all KPIs in one place
Instead of handling many Excel files, you get one unified dashboard for all KPIs.
2. You get instant performance insights
You see whether the project is ahead or behind schedule.
3. You monitor cost, time, quality, and safety easily
Because all KPIs appear in one view, you spot issues early.
4. You reduce delays and cost overruns
Real-time data helps you take action before problems grow.
5. You improve contractor and team performance
Clear KPIs encourage accountability.
6. You understand progress better with MTD and YTD numbers
This helps you track both short-term and long-term performance.
7. You simplify monthly reporting
The dashboard updates automatically when you enter data.
8. You compare with previous year’s performance
Year-over-year insights help improve planning and forecasting.
Click to Purchases Road and Highway Construction KPI Dashboard in Excel
Best Practices for Using This KPI Dashboard
Follow these practices to get the best results:
1. Update actuals and targets every month
Consistent data keeps the dashboard accurate.
2. Keep KPI definitions clear
This avoids confusion about calculations.
3. Use the KPI Trend charts weekly
They help you track progress and detect early warning signs.
4. Validate data before entering
Correct input gives correct analysis.
5. Use LTB and UTB classifications properly
Examples:
-
UTB: Productivity, Road Length Completed, Revenue
-
LTB: Accidents, Material Waste, Delays
6. Review PY vs CY values often
They highlight long-term growth or decline.
7. Share the dashboard with field teams
This improves communication and performance.
Conclusion
A Road and Highway Construction KPI Dashboard in Excel is one of the most powerful tools for infrastructure reporting. It helps you track performance, compare targets, monitor progress, and detect delays early. With its 7 structured worksheets, trend charts, conditional formatting, and clear definitions, it becomes the perfect solution for project managers, engineers, and construction firms.
By using this dashboard regularly, your team improves efficiency, reduces project risks, manages budgets better, and ensures timely project completion.
Click to Purchases Road and Highway Construction KPI Dashboard in Excel
Frequently Asked Questions (FAQs)
1. Who should use this dashboard?
Project managers, consultants, engineers, and construction firms can use it.
2. Do I need Excel expertise to use the dashboard?
No. Basic Excel knowledge is enough.
3. Can I add more KPIs?
Yes. You can add new KPIs in the KPI Definition sheet.
4. Does this dashboard show trends?
Yes. The KPI Trend sheet shows both MTD and YTD trends.
5. Can I compare results with last year?
Yes. PY values help you compare year-over-year performance.
6. Is this dashboard editable?
Yes. You can customize formulas, charts, and layout.
7. Can this dashboard be used for multi-project management?
Yes. You can include KPI groups for different projects.
8. How often should the data be updated?
A monthly update is recommended for accurate reporting.
Click to Purchases Road and Highway Construction KPI Dashboard in Excel
Visit our YouTube channel to learn step-by-step video tutorials