Managing a secondary school involves much more than daily teaching activities. Schools must track student strength, attendance, exam performance, scholarships, fees, and participation activities continuously. However, when this data remains scattered across multiple Excel files, registers, or manual reports, decision-making becomes slow and unclear.
That is exactly why a Secondary Schools Dashboard in Excel plays a vital role in modern school management.
In this detailed article, you will learn what a Secondary Schools Dashboard in Excel is, how it works, why schools need it, and how each dashboard page supports data-driven decisions. Moreover, this guide explains advantages, best practices, and frequently asked questions in a clear and practical way.
A Secondary Schools Dashboard in Excel is a ready-to-use analytical tool that transforms raw school data into meaningful visual insights. Instead of reviewing multiple sheets and reports, school administrators can monitor all key performance indicators from one centralized dashboard.
This dashboard tracks student distribution, attendance percentage, exam scores, scholarships, monthly fees, and participation activities using pivot tables and pivot charts. As a result, schools gain clarity and take faster actions.
Because the dashboard runs entirely in Microsoft Excel, it stays cost-effective, flexible, and easy to use. At the same time, it delivers professional-level insights without complex software.
Why Do Secondary Schools Need a Dashboard in Excel?
Secondary schools handle large volumes of academic and administrative data every month. Therefore, schools need a simple yet powerful way to analyze performance.
A Secondary Schools Dashboard in Excel helps because it:
-
Centralizes all academic and administrative metrics
-
Improves transparency across departments
-
Supports faster academic and financial decisions
-
Reduces manual reporting time
-
Improves accountability and planning
As a result, schools operate more efficiently and focus more on student outcomes.
What Are the Key Features of the Secondary Schools Dashboard in Excel?
This dashboard includes well-structured analytical pages, interactive slicers, and clean visualizations. Moreover, the design ensures ease of navigation and quick understanding.
Page Navigator for Easy Navigation
The Page Navigator, located on the left side, allows users to move between dashboard pages instantly. Therefore, users do not waste time searching for sheets.
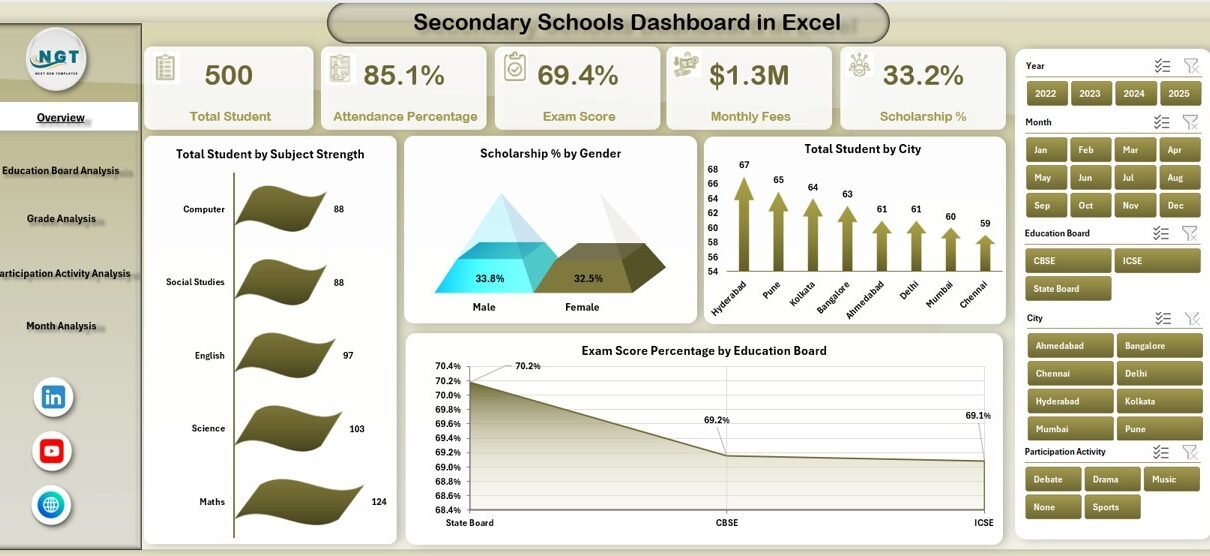
What Does the Overview Page Show?
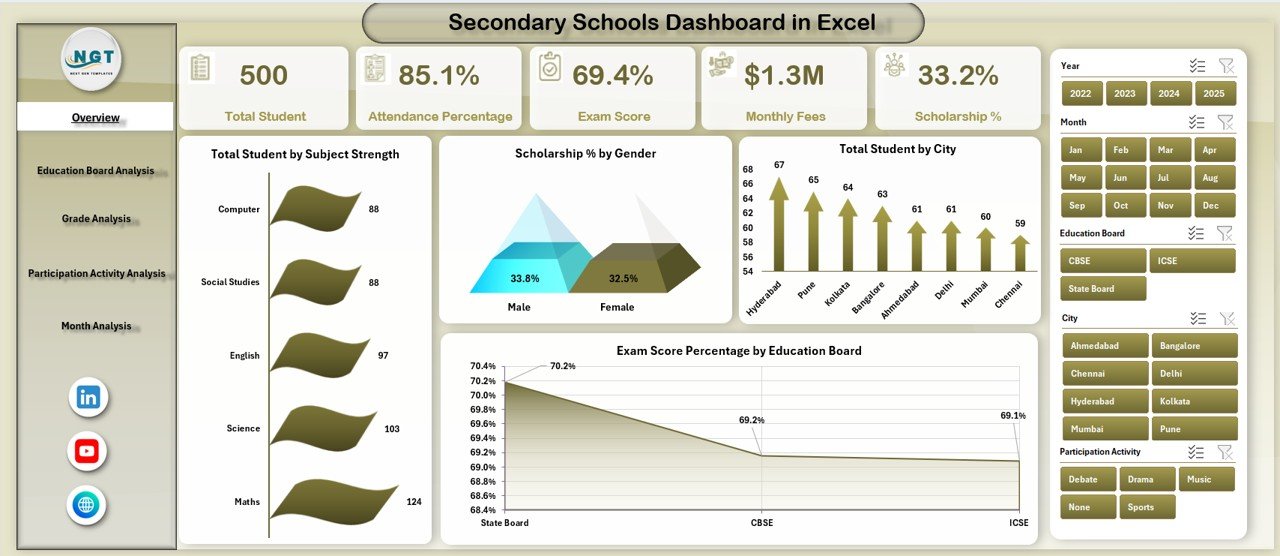
The Overview Page acts as the central control panel of the dashboard. It provides a quick snapshot of overall school performance.
Key Highlights of the Overview Page
-
Interactive slicer on the right side for filtering data
-
Four KPI cards for instant insights
-
Four key charts for high-level analysis
Charts Available on the Overview Page
-
Total Students by Subject Strength
-
Scholarship Percentage by Gender
-
Total Students by City
-
Exam Score Percentage by Education Board
Because of this structure, school leaders can understand student distribution and performance trends at a glance.
How Does the Education Board Analysis Page Help Schools?
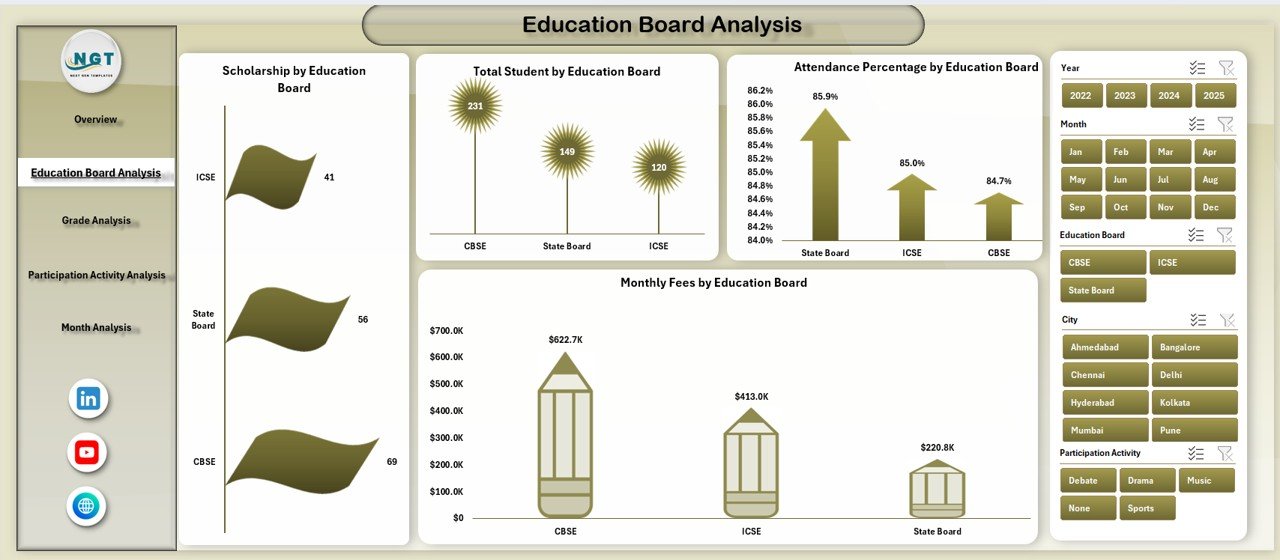
The Education Board Analysis Page focuses on performance across different education boards. Therefore, it supports comparative academic analysis.
Key Charts on the Education Board Analysis Page
-
Scholarship by Education Board
-
Total Students by Education Board
-
Attendance Percentage by Education Board
-
Monthly Fees by Education Board
With these insights, schools can identify which boards perform better academically and financially.
What Insights Does the Grade Analysis Page Provide?
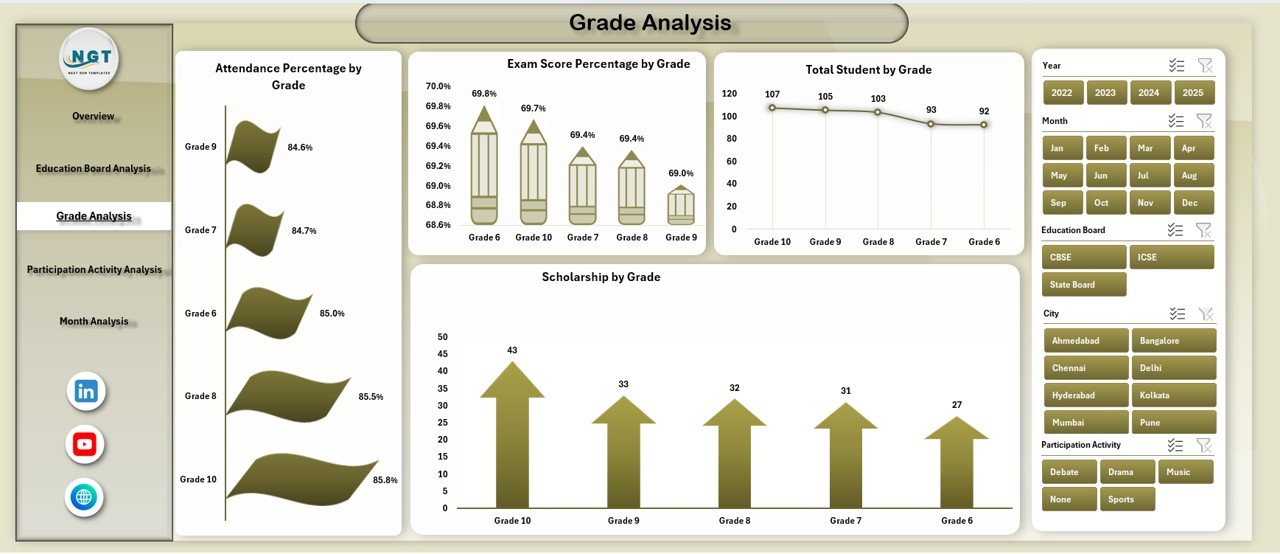
The Grade Analysis Page breaks down performance data by grade level. As a result, schools can track academic consistency across classes.
Charts Included in the Grade Analysis Page
-
Attendance Percentage by Grade
-
Exam Score Percentage by Grade
-
Total Students by Grade
-
Scholarship by Grade
This analysis helps schools identify grades that need academic support or attendance improvement.
Why Is Participation Activity Analysis Important?
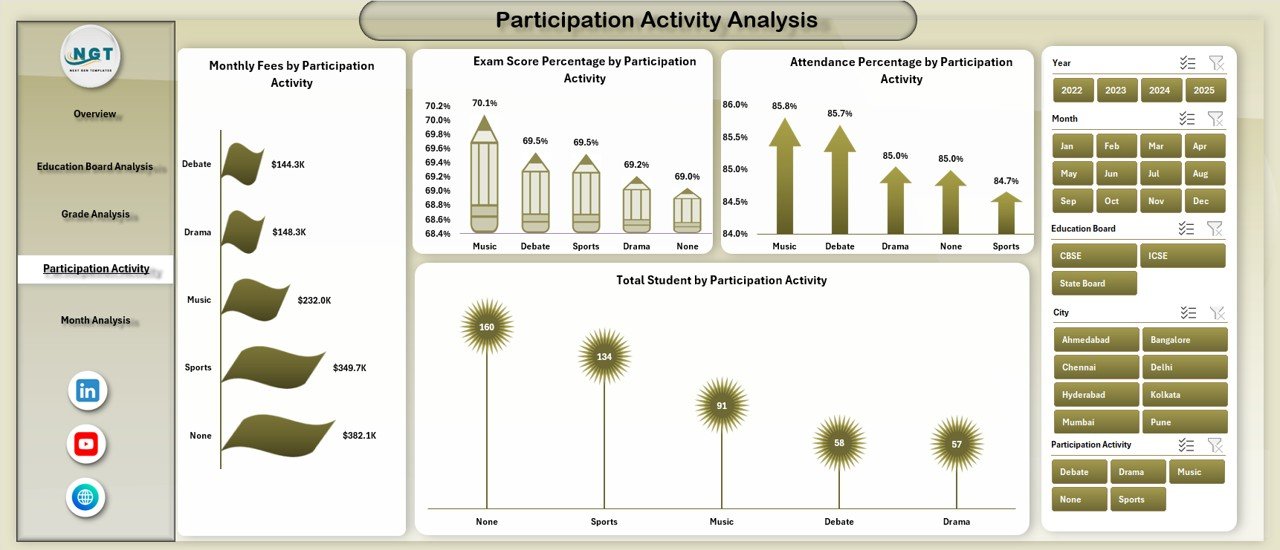
Student participation plays a key role in overall development. Therefore, this dashboard includes a dedicated Participation Activity Analysis Page.
Charts on the Participation Activity Analysis Page
-
Monthly Fees by Participation Activity
-
Exam Score Percentage by Participation Activity
-
Attendance Percentage by Participation Activity
-
Total Students by Participation Activity
Using this data, schools can measure how extracurricular involvement impacts academic performance and attendance.
Click to Purchases Secondary Schools Dashboard in Excel
What Does the Month Analysis Page Reveal?
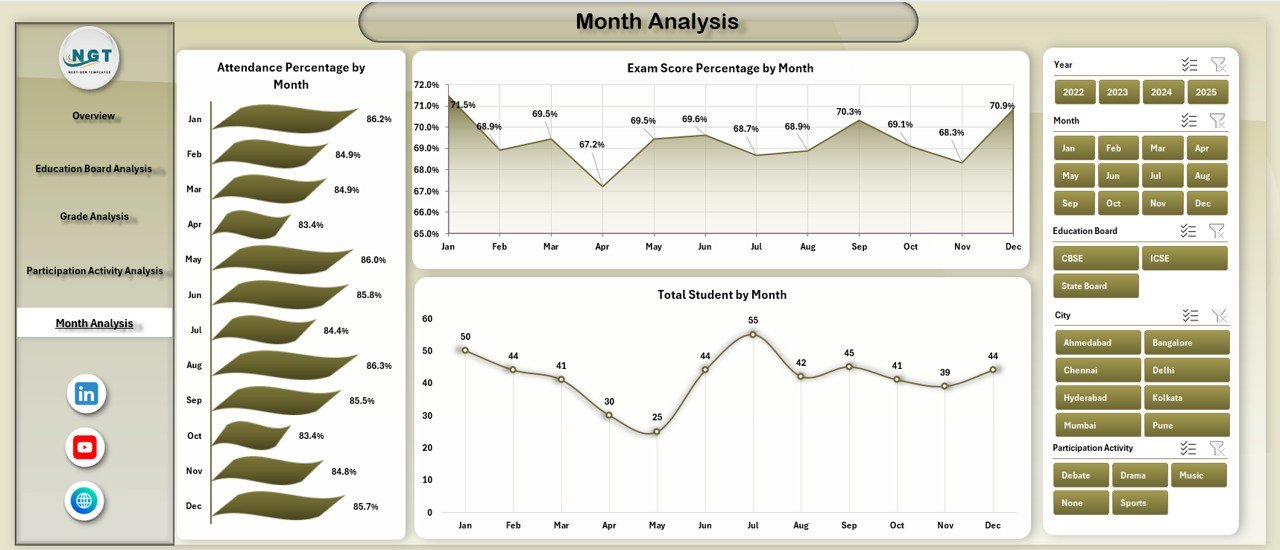
The Month Analysis Page focuses on time-based trends. Therefore, it helps schools monitor progress throughout the academic year.
Monthly Charts Included
-
Attendance Percentage by Month
-
Exam Score Percentage by Month
-
Total Students by Month
With these trends, schools can spot seasonal patterns and take corrective actions early.
How Do the Data Sheet and Support Sheet Work?
The Data Sheet stores all raw student, academic, and financial data. Meanwhile, the Support Sheet helps manage lookup values, calculated fields, and pivot-ready structures.
Because of this setup, the dashboard updates automatically whenever new data is added.
Advantages of Secondary Schools Dashboard in Excel
Using a Secondary Schools Dashboard in Excel delivers several practical benefits.
Key Advantages
-
📊 Centralized academic and administrative reporting
-
⏱️ Saves time on manual report preparation
-
📈 Improves academic performance tracking
-
💰 Enhances financial and fee analysis
-
🎯 Supports data-driven school planning
-
🧩 Fully customizable based on school needs
As a result, schools gain better control and clarity.
Best Practices for the Secondary Schools Dashboard in Excel
Following best practices ensures maximum value from the dashboard.
Recommended Best Practices
-
Keep data entry consistent and standardized
-
Update the data sheet regularly
-
Use slicers for focused analysis
-
Review dashboard insights monthly
-
Train staff on basic dashboard usage
-
Back up the Excel file periodically
These practices ensure accuracy, reliability, and long-term usability.
Click to Purchases Secondary Schools Dashboard in Excel
Conclusion
A Secondary Schools Dashboard in Excel transforms scattered school data into meaningful insights. It helps administrators track students, attendance, exam scores, scholarships, fees, and participation activities from one place.
Because the dashboard uses Excel, schools avoid expensive software while still gaining powerful analytics. When used correctly, this dashboard improves transparency, planning, and student outcomes.
In short, it serves as a smart decision-support tool for modern secondary schools.
Frequently Asked Questions (FAQs)
What is a Secondary Schools Dashboard in Excel used for?
It helps schools analyze student data, attendance, exam scores, scholarships, fees, and participation activities in one centralized dashboard.
Do I need advanced Excel skills to use this dashboard?
No, basic Excel knowledge is enough because the dashboard is ready to use and user-friendly.
Can schools customize the dashboard?
Yes, schools can easily modify charts, KPIs, and data fields based on their requirements.
Does the dashboard support monthly and yearly analysis?
Yes, the Month Analysis page enables trend tracking across the academic year.
Is this dashboard suitable for all secondary schools?
Yes, it works for public and private secondary schools of any size.
How often should schools update the data?
Schools should update the data regularly, preferably monthly or weekly, for accurate insights.
Visit our YouTube channel to learn step-by-step video tutorials