The agriculture industry never stops. Farmers prepare land before the season. Dealers expect timely supply. Distributors push for faster delivery. Meanwhile, raw material prices keep changing. Therefore, seed and fertilizer manufacturers must track production, sales, revenue, cost, and profit in real time.
However, many companies still depend on scattered Excel sheets. As a result, managers struggle to monitor plant performance. They miss profit leakage. They fail to compare regions and sales channels clearly.
So, how can you track production efficiency, revenue by region, plant-wise profit, and monthly trends in one structured system?
The answer is simple.
Click to Purchases Seed and Fertilizer Manufacturing Dashboard in Excel
You need a Seed and Fertilizer Manufacturing Dashboard in Excel.
In this detailed guide, you will learn:
-
What a Seed and Fertilizer Manufacturing Dashboard in Excel is
-
Why manufacturing companies need it
-
Detailed explanation of all 5 dashboard pages
-
Key metrics included in the dashboard
-
Advantages of Seed and Fertilizer Manufacturing Dashboard in Excel
-
Best Practices for the Seed and Fertilizer Manufacturing Dashboard
-
Frequently Asked Questions with Answers
Let us explore everything step by step.
What Is a Seed and Fertilizer Manufacturing Dashboard in Excel?
A Seed and Fertilizer Manufacturing Dashboard in Excel is a ready-to-use analytical reporting system designed specifically for seed processing units and fertilizer manufacturing companies.
It helps you:
-
Monitor total revenue and cost
-
Track profit margin %
-
Compare plant performance
-
Analyze product category performance
-
Evaluate sales channels
-
Monitor monthly trends
-
Track target sales by production manager
Moreover, it organizes all your business data into visual charts and KPI cards. Therefore, you can make fast and confident decisions.
Why Do Seed and Fertilizer Manufacturers Need This Dashboard?
Agricultural manufacturing depends on timing, cost control, and supply chain accuracy. Therefore, companies must stay alert at every stage.
Without a dashboard:
-
Managers rely on manual reports
-
Data stays scattered
-
Teams waste time compiling numbers
-
Profit leakage goes unnoticed
-
Production targets miss deadlines
However, with a dashboard:
-
You see real-time insights
-
You identify underperforming plants quickly
-
You compare product categories easily
-
You monitor sales channels clearly
-
You track monthly growth trends
As a result, you increase efficiency and profitability.
What Makes This Excel Dashboard Powerful?
This Seed and Fertilizer Manufacturing Dashboard in Excel includes:
-
5 Analytical Pages
-
Right-side slicers for dynamic filtering
-
KPI cards for quick summary
-
Pivot-based interactive charts
-
Page Navigator for smooth movement
-
Support Sheet for structured setup
-
Data Sheet for raw transaction data
Furthermore, the dashboard uses Pivot Tables and Pivot Charts. Therefore, you can refresh data instantly.
Detailed Explanation of All 5 Pages
Now let us understand each page in detail.
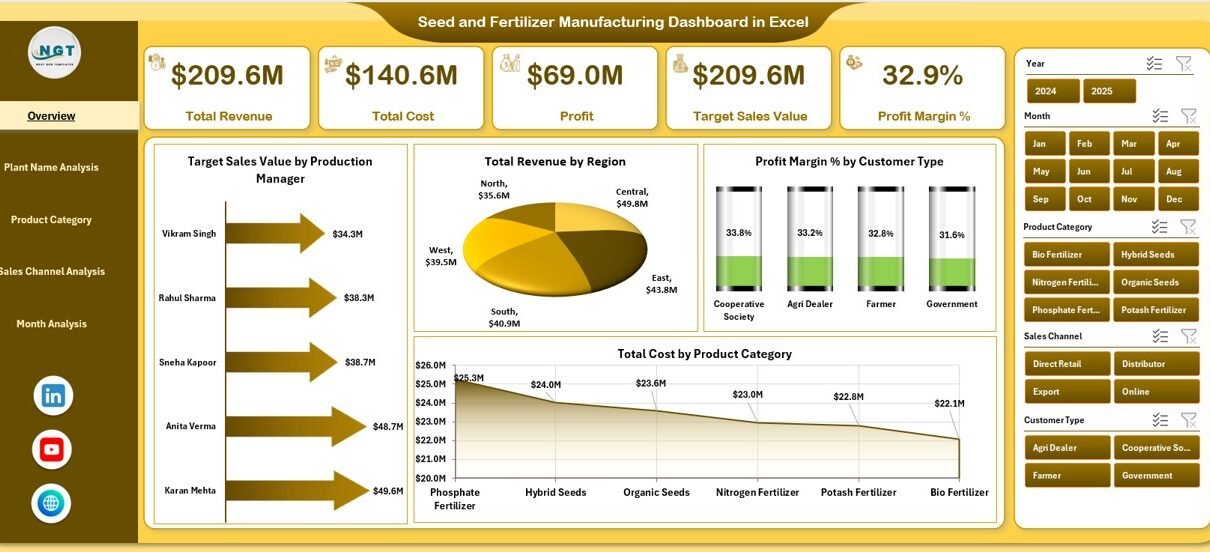
1️⃣ Overview Page – What Can You See at a Glance?
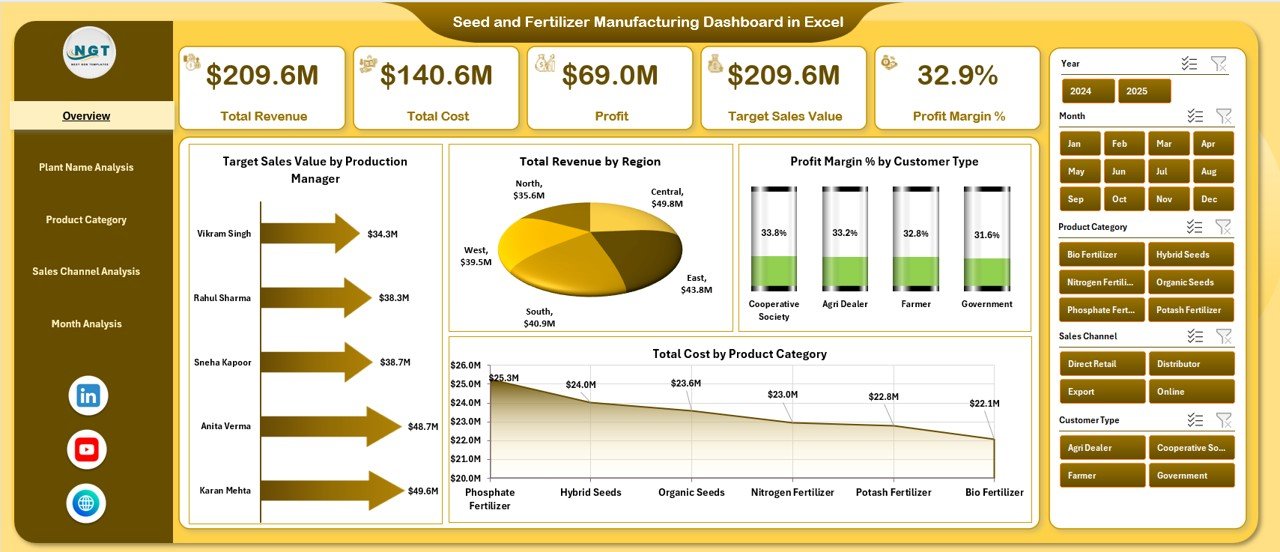
The Overview Page acts as the control center of the dashboard.
Key Features:
-
Right-side slicer (for filtering by month, region, plant, etc.)
-
4 KPI Cards
-
4 Analytical Charts
KPI Cards Include:
-
Target Sales Value by Production Manager
-
Total Revenue by Region
-
Profit Margin % by Customer Type
-
Total Cost by Product Category
Charts on Overview Page:
-
Target Sales Value by Production Manager
-
Total Revenue by Region
-
Profit Margin % by Customer Type
-
Total Cost by Product Category
Therefore, this page answers important questions like:
-
Which production manager meets targets?
-
Which region generates maximum revenue?
-
Which customer type gives better margins?
-
Which product category drives cost?
As a result, top management gets instant visibility.
2️⃣ Plant Name Analysis – Which Plant Performs Best?
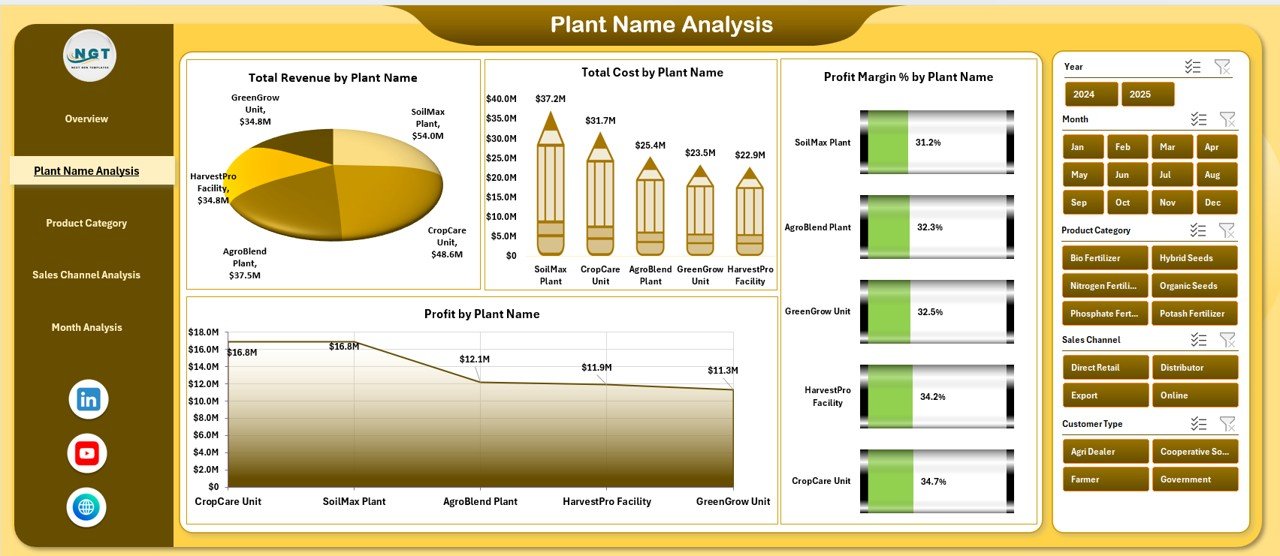
Manufacturing companies often operate multiple plants. However, not every plant performs equally.
This page helps you compare plant performance clearly.
Charts Included:
-
Total Revenue by Plant Name
-
Total Cost by Plant Name
-
Profit Margin % by Plant Name
-
Profit by Plant Name
Therefore, you can:
-
Identify high-revenue plants
-
Detect high-cost plants
-
Spot low-profit plants
-
Compare margin performance
Moreover, you can apply slicers to filter by month, product category, or region.
As a result, plant managers improve operational efficiency.
Click to Purchases Seed and Fertilizer Manufacturing Dashboard in Excel
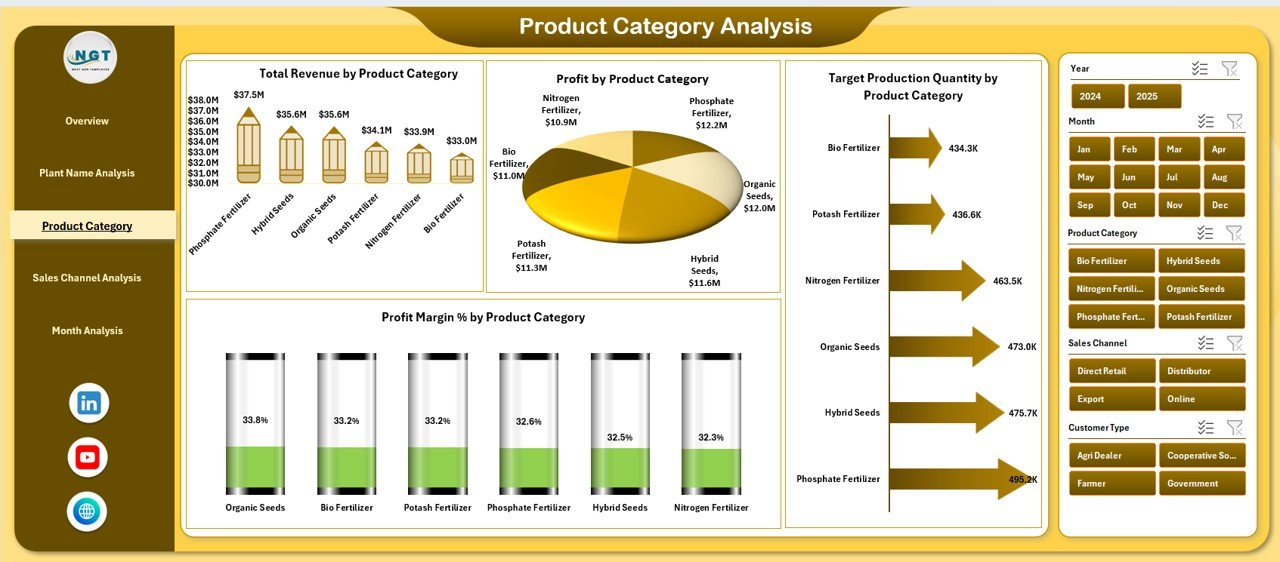
3️⃣ Product Category Analysis – Which Products Drive Growth?
Seed and fertilizer companies sell multiple categories such as:
-
Hybrid Seeds
-
Organic Fertilizers
-
Chemical Fertilizers
-
Micronutrients
-
Crop Protection Products
This page focuses on product-level performance.
Charts Included:
-
Total Revenue by Product Category
-
Total Cost by Product Category
-
Profit Margin % by Product Category
-
Target Production Quantity by Product Category
Therefore, you can:
-
Identify top-selling categories
-
Track production targets
-
Detect high-cost categories
-
Improve low-margin products
Consequently, management can adjust pricing or optimize production.
4️⃣ Sales Channel Analysis – Which Channel Brings Maximum Profit?
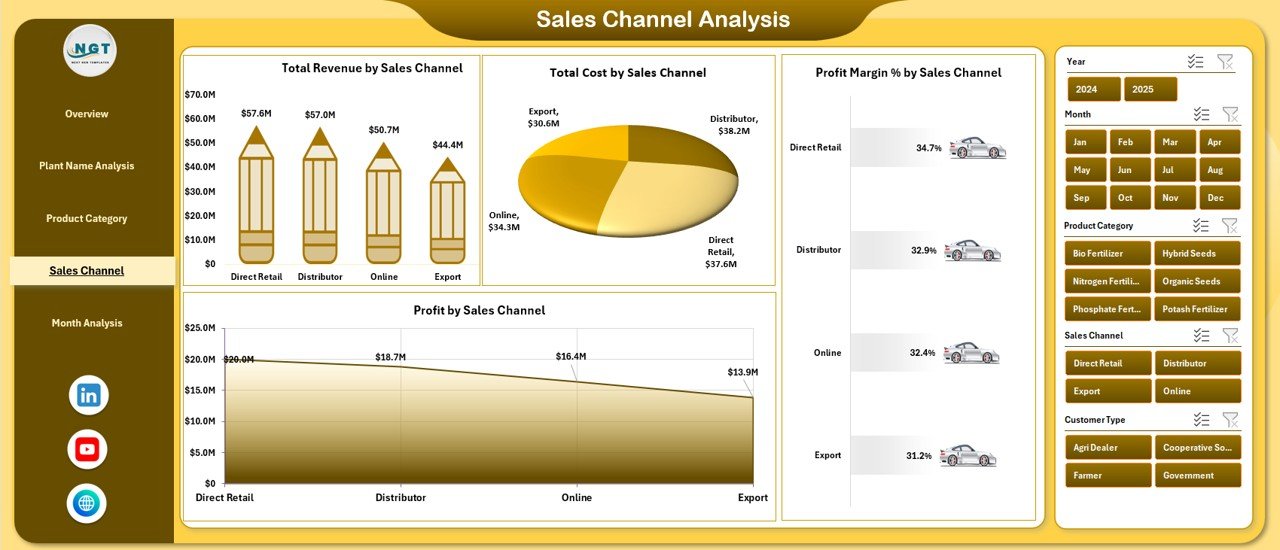
Manufacturers use multiple sales channels such as:
-
Direct Sales
-
Distributor Network
-
Dealer Network
-
Online Orders
-
Institutional Sales
However, not every channel performs equally.
Charts Included:
-
Total Revenue by Sales Channel
-
Total Cost by Sales Channel
-
Profit Margin % by Sales Channel
-
Profit by Sales Channel
Therefore, you can:
-
Compare revenue contribution
-
Identify high-cost channels
-
Evaluate profit margins
-
Improve underperforming channels
As a result, sales leaders allocate resources wisely.
5️⃣ Month Analysis – How Does Performance Change Over Time?
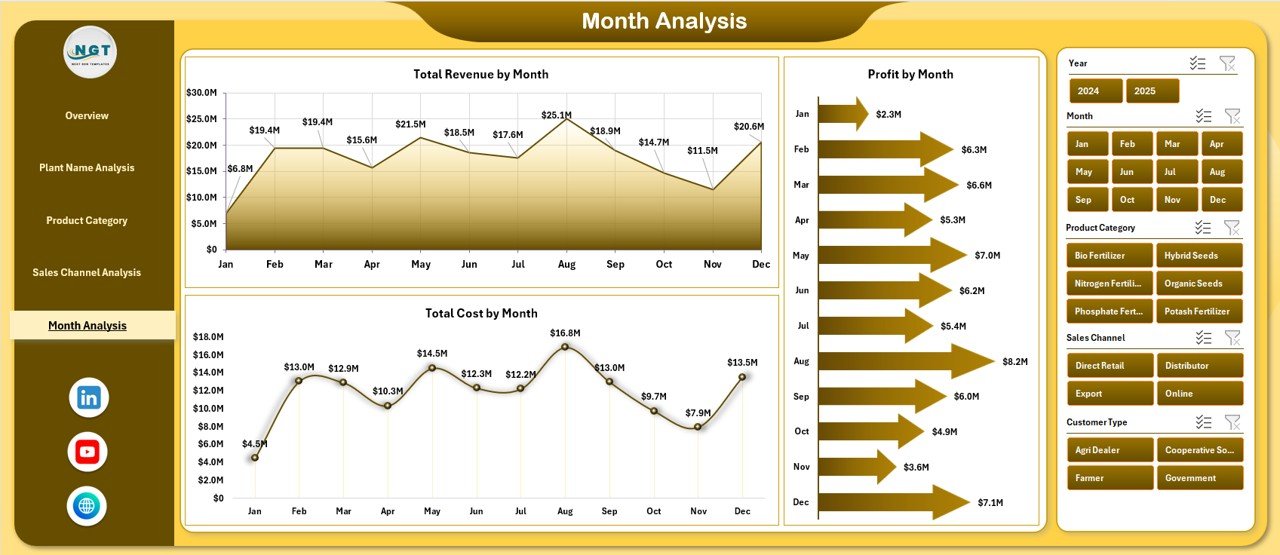
Seasonality plays a major role in seed and fertilizer manufacturing.
Therefore, month-wise analysis becomes critical.
Charts Included:
-
Total Revenue by Month
-
Total Cost by Month
-
Profit by Month
Thus, you can:
-
Identify peak sales months
-
Detect seasonal trends
-
Compare monthly profit
-
Plan inventory effectively
Consequently, you prepare better for future seasons.
What Is Included in the Support Sheet?
The Support Sheet helps structure the backend of the dashboard.
It contains:
-
Master lists (Plant Names, Product Categories, Sales Channels, Regions)
-
Lookup tables
-
Target data
-
KPI definitions
Therefore, it ensures data consistency.
What Does the Data Sheet Contain?
Click to Purchases Seed and Fertilizer Manufacturing Dashboard in Excel
The Data Sheet captures transaction-level data such as:
-
Date
-
Plant Name
-
Product Category
-
Sales Channel
-
Region
-
Production Manager
-
Customer Type
-
Quantity
-
Revenue
-
Cost
-
Profit
Because the dashboard connects directly to this sheet, you only need to update data regularly and refresh.
Advantages of Seed and Fertilizer Manufacturing Dashboard in Excel
Now let us explore the major benefits.
1. Improves Decision-Making
You get instant insights. Therefore, you make faster decisions.
2. Saves Time
You avoid manual reporting. As a result, teams focus on operations.
3. Identifies Profit Leakage
You spot high-cost areas quickly. Consequently, you reduce losses.
4. Enhances Plant Efficiency
You compare plants clearly. Therefore, you improve weak units.
5. Boosts Sales Strategy
You analyze channels and regions. Thus, you optimize distribution.
6. Tracks Target Achievement
You monitor production manager targets. Therefore, you increase accountability.
7. Supports Seasonal Planning
You evaluate monthly trends. As a result, you plan inventory smartly.
How Does This Dashboard Help Top Management?
Top executives need summary-level information. However, they also require the ability to drill down.
This dashboard:
-
Provides quick overview
-
Offers detailed analysis pages
-
Allows filtering by slicers
-
Updates instantly
Therefore, it supports both strategic and operational decisions.
Best Practices for the Seed and Fertilizer Manufacturing Dashboard
Click to Purchases Seed and Fertilizer Manufacturing Dashboard in Excel
To get maximum value, follow these best practices.
1. Update Data Regularly
Add new transaction data daily or weekly.
2. Maintain Data Accuracy
Avoid duplicate entries. Check formulas regularly.
3. Use Consistent Naming
Keep plant names and product categories standardized.
4. Review Targets Monthly
Update target sales and production quantities regularly.
5. Analyze Trends, Not Just Numbers
Look at month-over-month changes.
6. Train Your Team
Ensure managers understand slicers and filters.
7. Protect the Structure
Lock formula cells to avoid accidental changes.
How Can This Dashboard Improve Profitability?
Profit depends on revenue, cost, and margin control.
This dashboard:
-
Highlights high-cost products
-
Identifies low-margin regions
-
Compares channel profitability
-
Tracks production efficiency
Therefore, management can:
-
Adjust pricing
-
Negotiate raw material cost
-
Improve plant efficiency
-
Optimize distribution network
As a result, overall profitability improves.
Who Can Use This Dashboard?
This dashboard benefits:
-
Seed Manufacturers
-
Fertilizer Producers
-
Agrochemical Companies
-
Agriculture Input Suppliers
-
Regional Sales Managers
-
Plant Managers
-
Finance Teams
-
Operations Heads
Therefore, it serves multiple departments.
Why Choose Excel for Manufacturing Dashboard?
Excel remains powerful because:
-
Most companies already use it
-
It supports Pivot Tables
-
It allows dynamic slicers
-
It offers easy customization
-
It requires no additional software
Moreover, Excel keeps data flexible and scalable.
Conclusion
Seed and fertilizer manufacturing requires precision, timing, and cost control. However, manual reporting slows down decision-making.
Therefore, companies must adopt a structured analytical system.
The Seed and Fertilizer Manufacturing Dashboard in Excel provides:
-
Clear visibility
-
Real-time insights
-
Plant comparison
-
Product analysis
-
Sales channel tracking
-
Monthly trend monitoring
As a result, businesses improve efficiency, reduce cost leakage, and increase profitability.
If you want to transform your manufacturing operations with clear insights and smarter decisions, this dashboard delivers exactly what you need.
Frequently Asked Questions with Answers
1. What data do I need to use this dashboard?
You need transaction-level data including revenue, cost, plant name, product category, sales channel, region, and date.
2. Can I customize the dashboard?
Yes, you can modify charts, add new KPIs, or adjust slicers based on your business needs.
3. Do I need advanced Excel skills to use it?
No. You only need basic Excel knowledge. The dashboard uses Pivot Tables and slicers for easy navigation.
4. How often should I update the data?
You should update data weekly or monthly depending on your reporting cycle.
5. Can this dashboard handle large data?
Yes. Excel supports thousands of rows. However, you should maintain clean data for smooth performance.
6. Does this dashboard support seasonal analysis?
Yes. The Month Analysis page helps you track seasonal revenue, cost, and profit trends.
7. Can this dashboard improve production efficiency?
Yes. The Plant Name Analysis page helps you compare plants and improve underperforming units.
Visit our YouTube channel to learn step-by-step video tutorials