The shipbuilding industry deals with some of the most complex engineering projects in the world. Shipyards work with strict timelines, large budgets, material constraints, and safety standards. Because of these complexities, teams need a clear and organized way to monitor performance across multiple stages—from planning and engineering to production and quality control.
A Shipbuilding KPI Dashboard in Excel serves this purpose perfectly. It helps managers, engineers, and operations teams analyze key metrics in one place. Since this dashboard includes MTD, YTD, Target, and Previous Year comparisons, it becomes a powerful tool for performance improvement.
In this article, you will explore the complete structure of this dashboard, its worksheets, benefits, best practices, and answers to the most common questions.
Click to Purchases Shipbuilding KPI Dashboard in Excel
⚓ What Is a Shipbuilding KPI Dashboard in Excel?
A Shipbuilding KPI Dashboard in Excel is a ready-to-use template designed to track KPIs related to production efficiency, safety compliance, material usage, labor productivity, and project progress. It brings all data together into a clean, visual scorecard for easier decision-making.
Because it runs on Excel, organizations do not need expensive software. They only need a structured file that updates automatically whenever new data is added.
📁 Structure of the Shipbuilding KPI Dashboard
This dashboard includes 7 worksheets, and each worksheet plays a unique role in tracking and analyzing KPIs.
1️⃣ Home Sheet – Quick Navigation
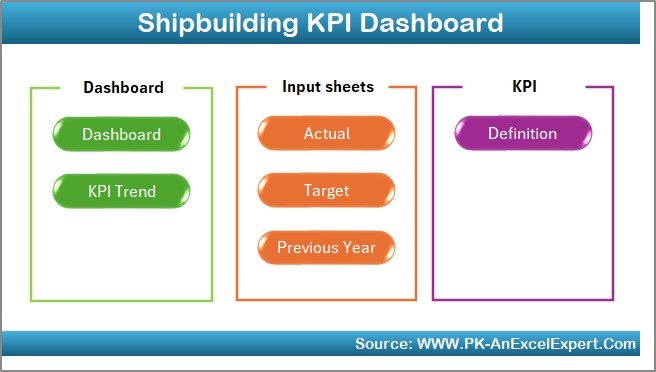
The Home Sheet works as the index page. It includes 6 navigation buttons that take you directly to the respective worksheet.
Teams often use this sheet to streamline workflow and access data quickly.
Click to Purchases Shipbuilding KPI Dashboard in Excel
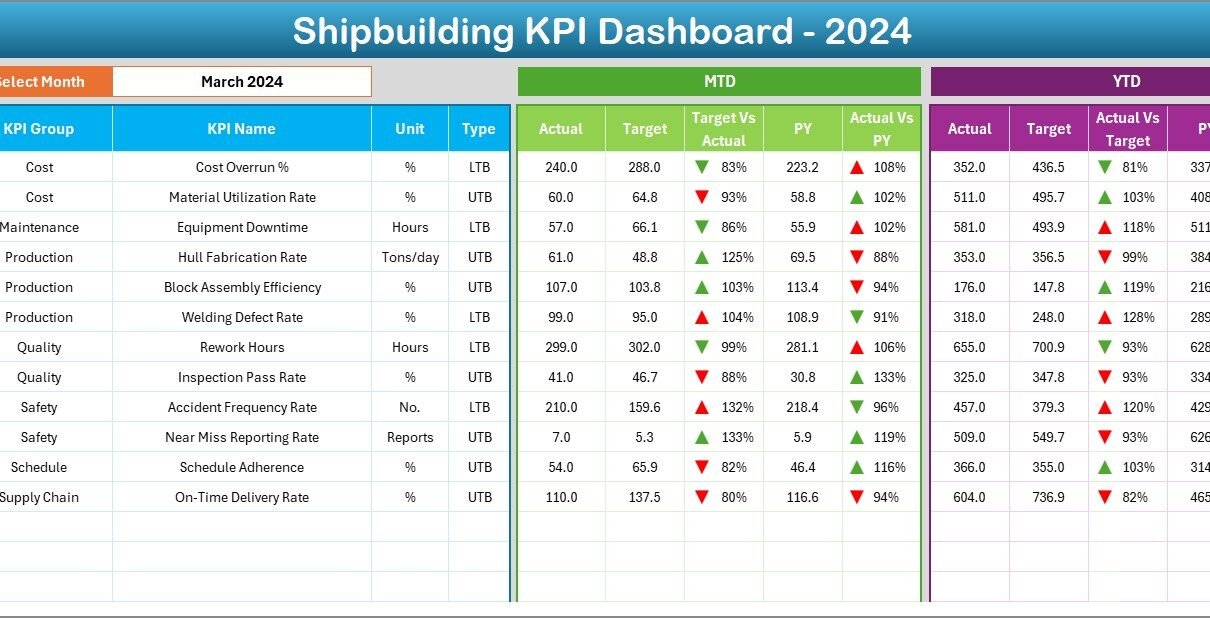
2️⃣ Dashboard Sheet – The Main Performance View
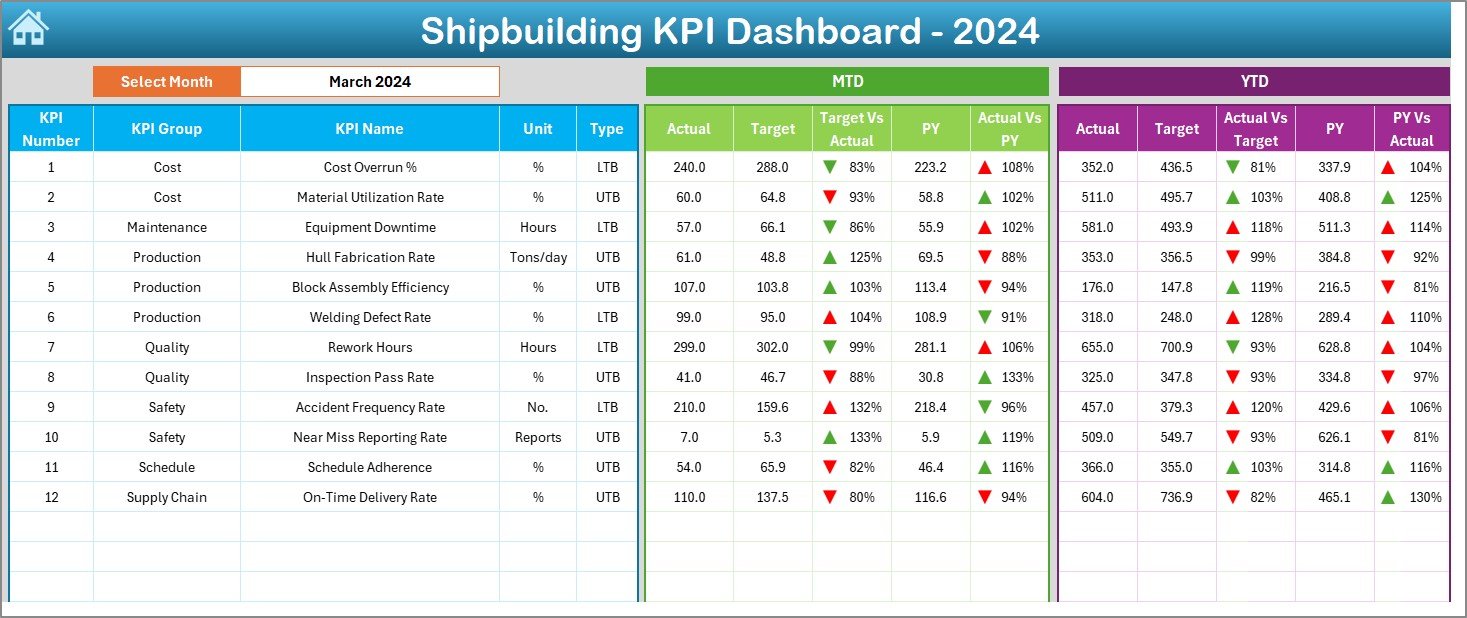
The Dashboard Sheet displays all major KPI insights in one place. This is the page that managers use most frequently because it provides a complete view of shipbuilding performance.
⭐ Key Features on This Sheet
✔ Month Selector (Cell D3)
You can select any month from the dropdown. As soon as you choose a month, the dashboard updates the numbers automatically.
✔ MTD Performance
The sheet displays:
-
Actual (MTD)
-
Target (MTD)
-
Previous Year MTD
-
Target vs Actual % (MTD)
-
PY vs Actual % (MTD)
Every KPI also includes conditional formatting with:
-
Green upward arrows (▲) for positive performance
-
Red downward arrows (▼) for negative performance
✔ YTD Performance
Similarly, the dashboard shows:
-
Actual (YTD)
-
Target (YTD)
-
Previous Year YTD
-
Target vs Actual % (YTD)
-
PY vs Actual % (YTD)
These visuals help shipbuilding teams understand whether current production is improving or falling behind.
Click to Purchases Shipbuilding KPI Dashboard in Excel
3️⃣ KPI Trend Sheet – Analyze Progress Over Time
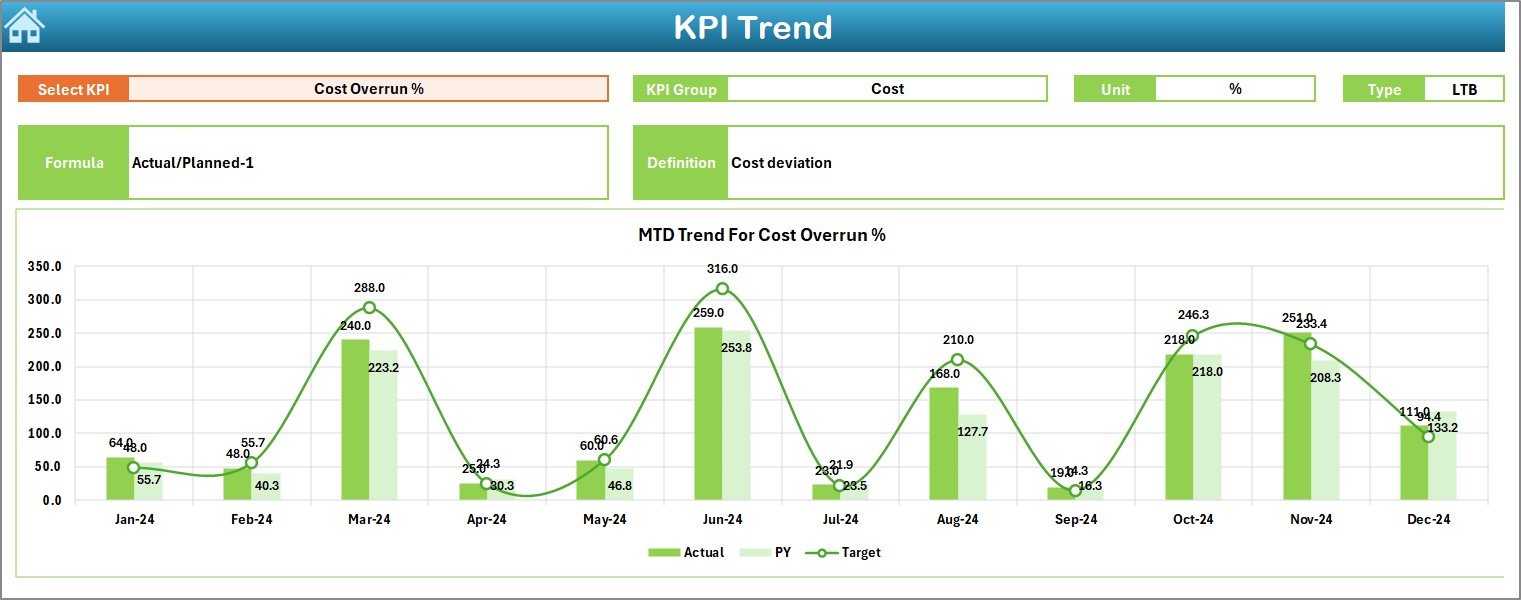
The KPI Trend Sheet gives users the ability to study performance trends. Shipbuilding projects often run for months or even years, so trend charts help teams observe long-term improvement.
⭐ What This Sheet Includes
-
KPI Selector at Cell C3
-
KPI Group
-
Unit of Measurement
-
KPI Type (UTB – Upper the Better, LTB – Lower the Better)
-
KPI Formula
-
KPI Definition
-
MTD Trend Chart for Actual, Target, and Previous Year
-
YTD Trend Chart for Actual, Target, and Previous Year
These charts help teams understand how a KPI behaves month after month.
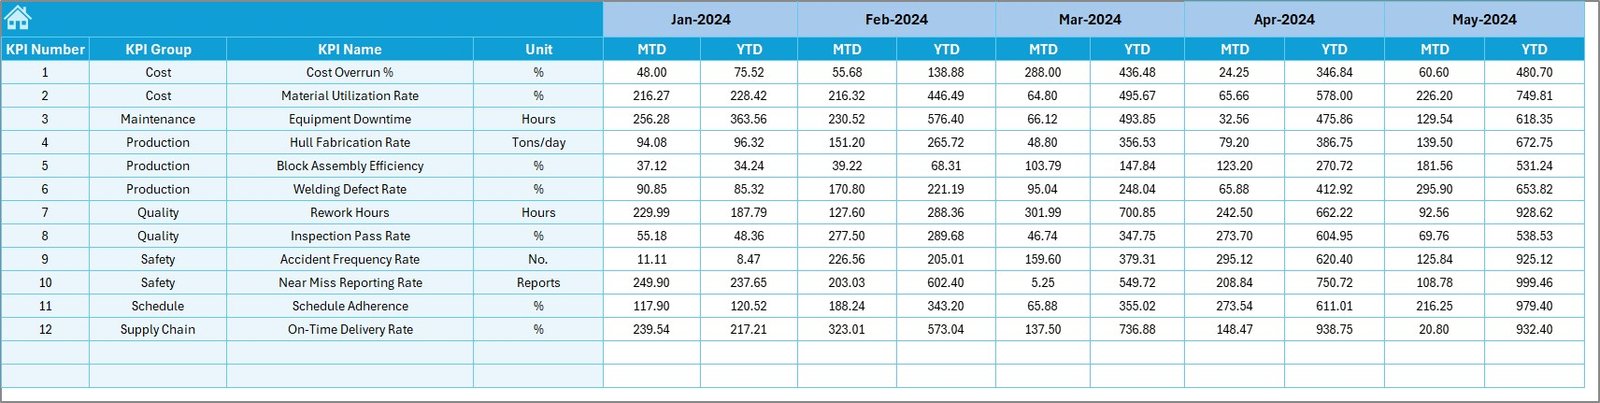
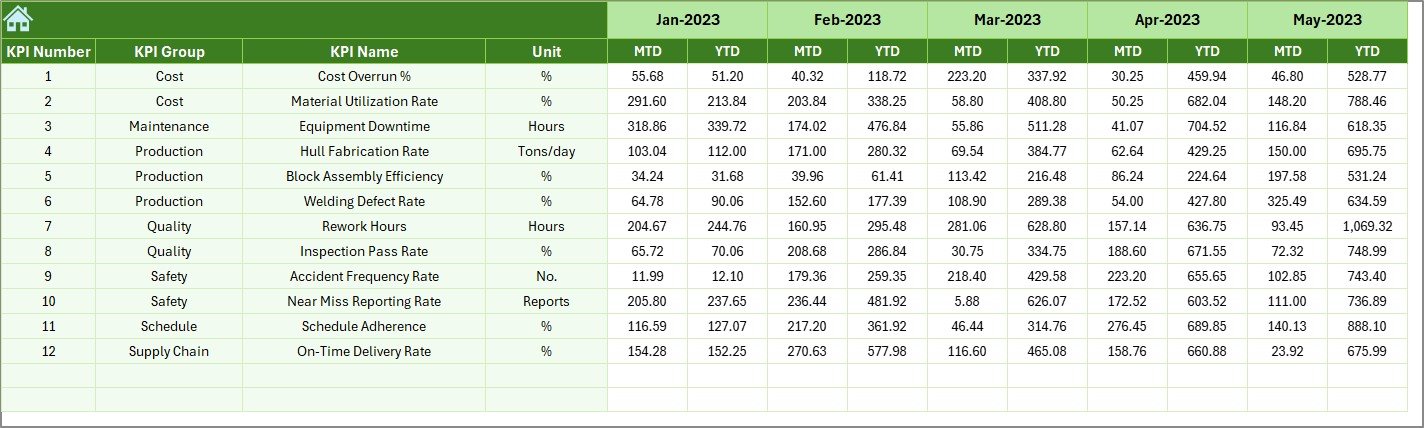
4️⃣ Actual Numbers Input Sheet – Fill Current Year Values

In this sheet, users enter the:
-
Current Year MTD numbers
-
Current Year YTD numbers
⭐ How It Works
-
Select the first month of the year in Cell E1.
-
Enter all actual numbers for each KPI for the chosen reporting period.
Because this sheet handles the heart of the data entry, it must always remain clean and accurate.
5️⃣ Target Sheet – Enter Target Values
Every shipbuilding project runs with fixed targets. These targets help teams measure progress against expectations.
⭐ In This Sheet, Users Record:
-
Monthly Target MTD
-
Target YTD
-
Targets for each KPI
When targets update regularly, the dashboard adjusts automatically.
6️⃣ Previous Year Numbers Sheet – Compare Performance Over Years
Shipbuilding performance improves when teams can compare results with previous years.
⭐ What You Enter Here
-
Previous Year MTD
-
Previous Year YTD
This data allows the dashboard to calculate:
-
CY vs PY (MTD)
-
CY vs PY (YTD)
This comparison helps managers evaluate long-term performance improvement.
Click to Purchases Shipbuilding KPI Dashboard in Excel
7️⃣ KPI Definition Sheet – Maintain Clarity for Every KPI

The KPI Definition Sheet stores all the important information about each KPI.
⭐ You Must Fill:
-
KPI Name
-
KPI Group
-
Unit
-
Formula
-
Definition
This sheet ensures everyone in the shipbuilding team understands how each KPI is calculated.
🛠 Why Shipbuilding Needs a KPI Dashboard
The shipbuilding industry must manage:
-
Complex timelines
-
High operational costs
-
Safety compliance
-
Skilled labor availability
-
Material delays
-
Quality control
-
Technical accuracy
A KPI dashboard helps teams manage all these tasks accurately and efficiently. It becomes the single source of truth that guides daily and monthly decisions.
Click to Purchases Shipbuilding KPI Dashboard in Excel
⚓ Advantages of the Shipbuilding KPI Dashboard in Excel
Using this dashboard offers several benefits.
✔ 1. Better Visibility of Entire Production Cycle
Users see MTD and YTD values together, so they understand the current status instantly.
✔ 2. Faster Decision-Making
The dashboard updates immediately whenever actual numbers are entered. This speed helps shipyards act quickly.
✔ 3. Clear Comparison of Actual vs Target
Knowing how far you are from the target makes planning easier.
✔ 4. Year-over-Year Insights
Analyzing CY vs PY values highlights improvement areas that require attention.
✔ 5. Trend Charts for Deeper Analysis
Trend data helps managers understand if performance is improving month after month.
✔ 6. High Customization
Shipyards can add new KPIs, rename existing KPIs, change colors, or modify layout structure easily.
✔ 7. Cost-Effective Solution
Excel-based dashboards cost far less than specialized reporting software.
Click to Purchases Shipbuilding KPI Dashboard in Excel
📌 Best Practices for Using the Shipbuilding KPI Dashboard
To get accurate reporting and better insights, follow these best practices.
⭐ 1. Update Data Every Month
Regular updates help maintain report accuracy.
⭐ 2. Use Correct KPI Formulas
Every KPI must follow the formula listed in the KPI Definition Sheet.
⭐ 3. Enter Clean and Accurate Inputs
Avoid mistakes in the Input Sheets because all dashboard visuals depend on this data.
⭐ 4. Track Both MTD and YTD Values
Monthly values help with short-term analysis, while YTD values help with long-term growth.
⭐ 5. Compare With Previous Year Numbers
This helps identify true performance improvement.
⭐ 6. Use Trend Charts for Planning
Trends help managers find areas that need support or improvement.
⭐ 7. Add New KPIs as Shipbuilding Processes Evolve
Shipbuilding operations change, so KPI lists must evolve too.
🌎 Where Can This Dashboard Be Used?
-
Large shipyards
-
Naval construction projects
-
Merchant vessel manufacturing
-
Marine engineering companies
-
Offshore vessel fabrication
-
Repair dock performance tracking
-
Maritime equipment production
Because the dashboard adapts easily, it becomes useful across the entire shipbuilding ecosystem.
🏁 Conclusion
The Shipbuilding KPI Dashboard in Excel helps shipyards track MTD and YTD performance with clarity and speed. It simplifies reporting, highlights performance gaps, and supports better decision-making. With its 7 worksheets—including Dashboard, Trends, Input Sheets, and KPI Definitions—this template becomes a complete performance monitoring solution.
When shipbuilding teams use this dashboard regularly, they gain deeper insights and build stronger, more efficient processes.
Click to Purchases Shipbuilding KPI Dashboard in Excel
❓ Frequently Asked Questions (FAQs)
1. What is a Shipbuilding KPI Dashboard?
It is an Excel template that tracks shipbuilding KPIs using charts, trends, actual vs target values, and conditional formatting.
2. What KPIs does it track?
Production efficiency, material usage, labor productivity, quality scores, safety incidents, cost variance, project delays, and more.
3. Who uses this dashboard?
Shipyard managers, engineers, planners, production supervisors, and quality teams.
4. How often should the data be updated?
Update it every month to maintain accurate MTD and YTD reporting.
5. Can the dashboard be customized?
Yes, you can add KPIs, change layouts, and modify formulas easily.
6. Does it show trend charts?
Yes, the KPI Trend Sheet displays MTD and YTD trends for Actual, Target, and Previous Year.
7. Why use Excel instead of software?
Excel is affordable, flexible, and easy to update without technical knowledge.
Click to Purchases Shipbuilding KPI Dashboard in Excel
Visit our YouTube channel to learn step-by-step video tutorials