The shipbuilding industry manages some of the most complex engineering projects in the world. Shipyards track thousands of activities every day—from design, fabrication, welding, and assembly to safety checks, inspections, energy usage, and final delivery. Because the workflow includes many departments and many timelines, leaders often struggle with performance tracking. This is exactly where a Shipbuilding KPI Dashboard in Power BI becomes a powerful decision-making tool.
This complete guide explains the structure, features, working method, Excel data setup, and advantages of using a Shipbuilding KPI Dashboard in Power BI. You will also learn best practices to maintain accuracy and clarity along with detailed FAQs. Since this dashboard is fully interactive and easy to update, shipyards can rely on it for daily monitoring, monthly reviews, and long-term planning.
Let’s explore everything step-by-step.
Click to Purchases Shipbuilding KPI Dashboard in Power BI
What Is a Shipbuilding KPI Dashboard in Power BI?
A Shipbuilding KPI Dashboard in Power BI is a reporting system that tracks the performance of shipyard operations through Key Performance Indicators (KPIs). It provides a clear view of project progress, cost, quality, safety, resource usage, timelines, and process efficiency. Since the dashboard connects with an Excel file, teams can update KPI values easily without technical skills.
This dashboard helps shipbuilding companies:
-
Monitor target vs actual values
-
Compare current year with previous year
-
Visualize project performance
-
Track delays and process risks
-
Improve communication across departments
Because Power BI offers an interactive interface, decision-makers understand everything clearly in one place.
Click to Purchases Shipbuilding KPI Dashboard in Power BI
Why Do Shipyards Need a KPI Dashboard?
Shipbuilding projects involve large budgets, long timelines, multiple production lines, and complex coordination. Therefore, shipyards need strong visibility. A KPI dashboard helps in:
-
Tracking monthly progress
-
Comparing with planned targets
-
Reducing delays
-
Controlling cost overruns
-
Ensuring safety compliance
-
Improving design-to-delivery accuracy
-
Identifying root causes faster
When shipyards use a KPI dashboard, every department can see performance clearly. As a result, actions become faster and decisions become more reliable.
Structure of the Shipbuilding KPI Dashboard in Power BI
This dashboard contains three powerful pages:
-
Summary Page
-
KPI Trend Page
-
KPI Definition Page
Now, let’s understand each page in detail.
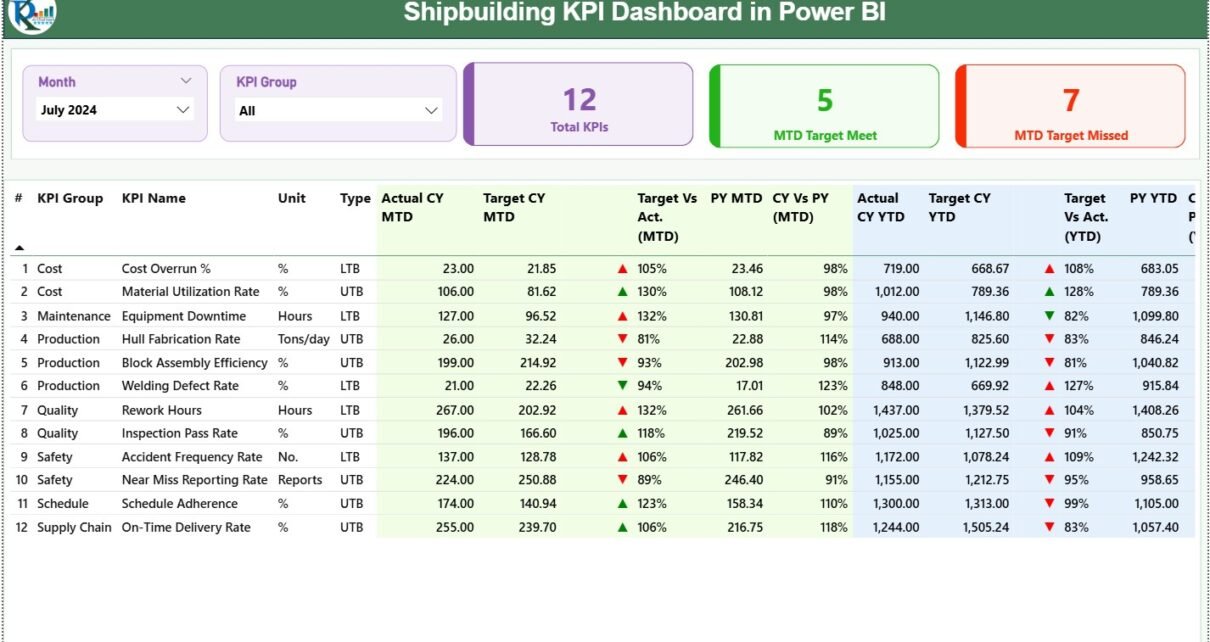
1. Summary Page – The Main Control Center
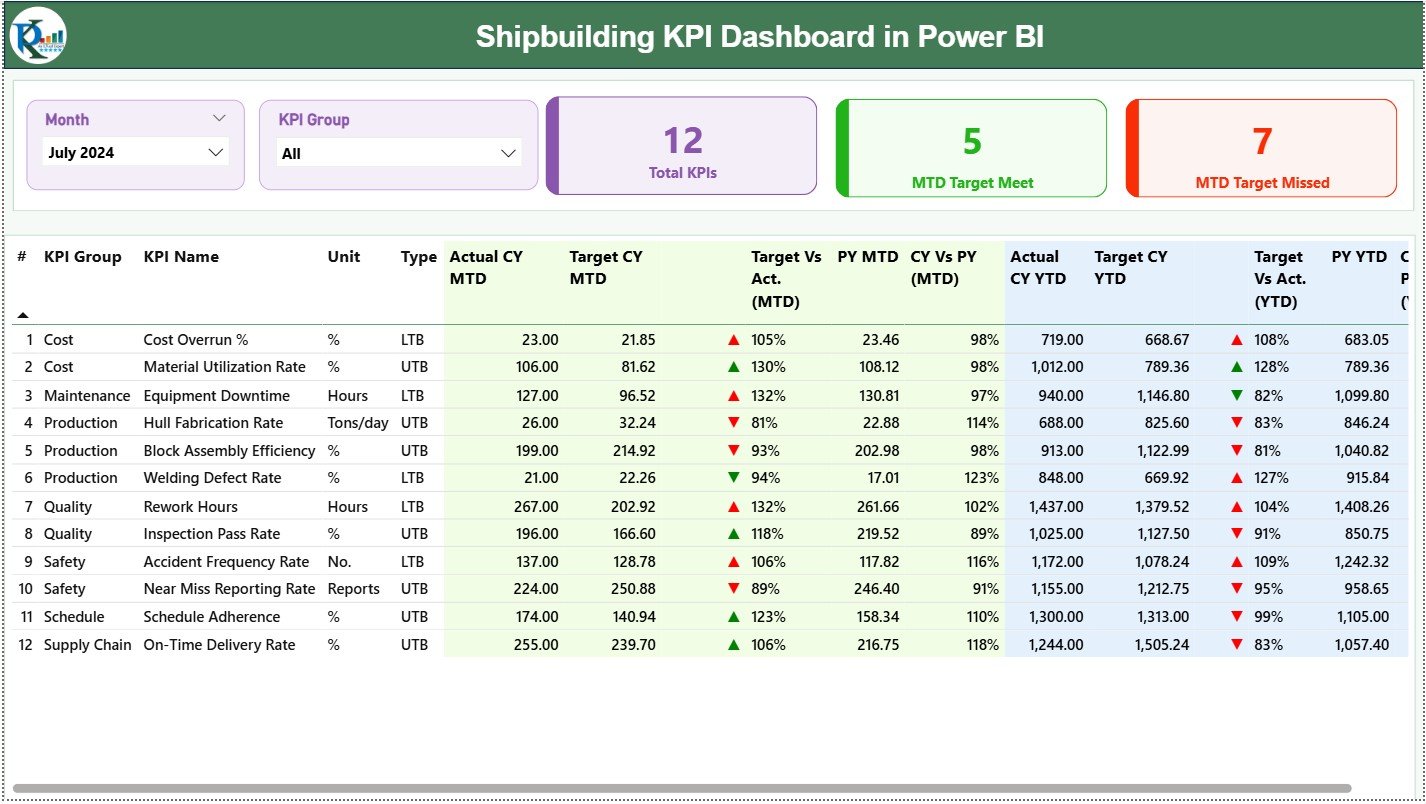
The Summary Page is the most important page of the dashboard. It acts as a control center where users can filter, explore, and analyze KPIs instantly.
Top Section – Slicers for Easy Navigation
This page includes two slicers:
-
Month Slicer – Selects the reporting month
-
KPI Group Slicer – Filters KPIs by categories like Production, Quality, Safety, Energy, Supply Chain, Welding, Fabrication, Dock Operations, etc.
These slicers allow users to explore data quickly without manually filtering tables.
KPI Cards – Quick Snapshot of Performance
This page displays three KPI cards:
-
Total KPIs Count
-
MTD Target Met Count
-
MTD Target Missed Count
These cards provide a quick overview of shipyard performance. When more KPIs fall into the “target met” category, performance remains stable.
Detailed KPI Table – Complete KPI Visibility
The detailed table on the Summary Page includes the following fields:
-
KPI Number
-
KPI Group
-
KPI Name
-
Unit
-
KPI Type (LTB – Lower the Better / UTB – Upper the Better)
-
Actual CY MTD
-
Target CY MTD
-
MTD Status Icon (▲/▼ showing green/red indicator)
-
Target vs Actual MTD %
-
PY MTD
-
CY vs PY MTD %
-
Actual CY YTD
-
Target CY YTD
-
YTD Status Icon
-
Target vs Actual YTD %
-
PY YTD
-
CY vs PY YTD %
Because the table includes icons and percentages, users understand KPI status instantly.
For example:
-
If welding defects exceed the limit → KPI will show red icon
-
If ship block production exceeds target → KPI will show green icon
-
If project timeline improves vs previous year → CY vs PY % increases
This makes performance evaluation simple and clear.
Click to Purchases Shipbuilding KPI Dashboard in Power BI
2. KPI Trend Page – Visual Charts for Deeper Analysis
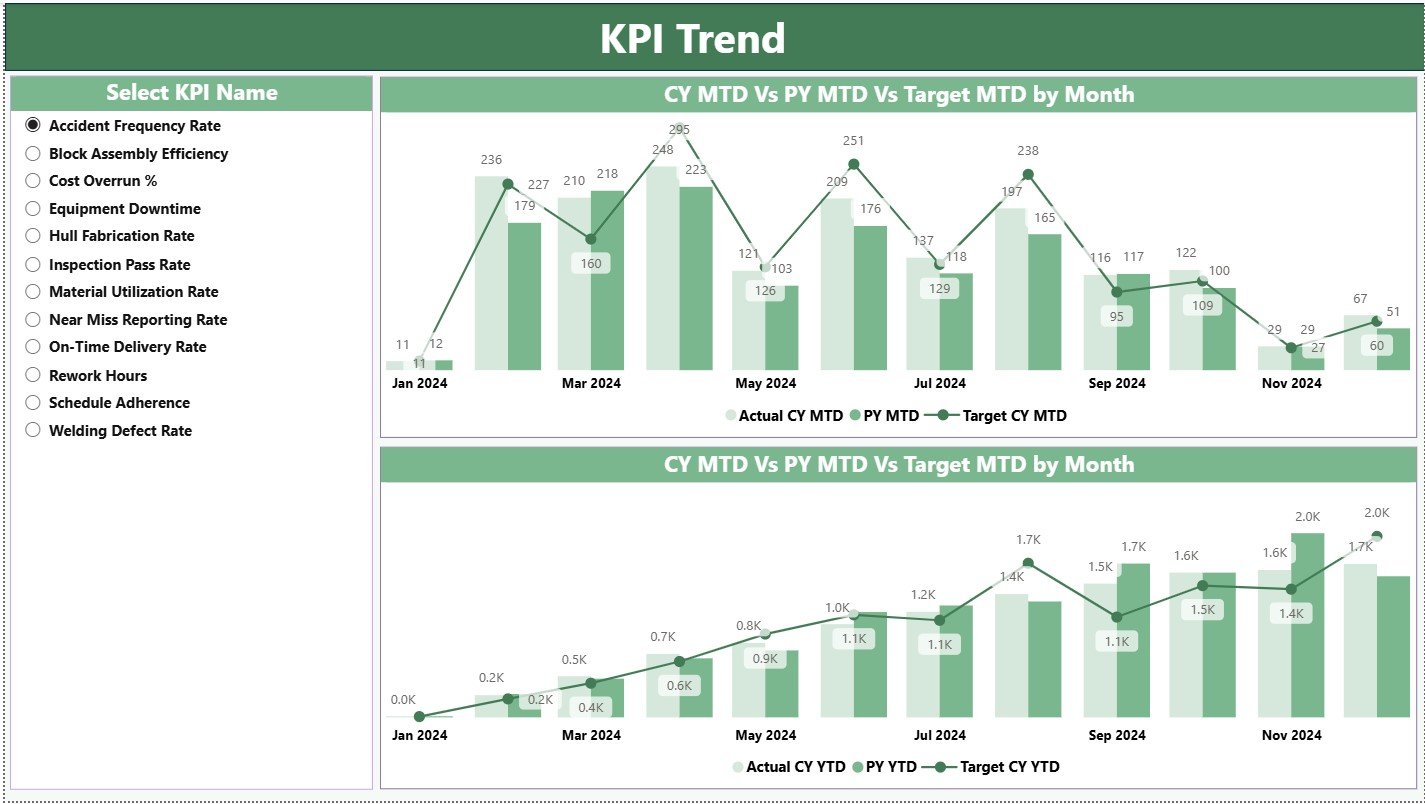
The KPI Trend Page helps users analyze month-over-month and year-over-year performance. You can select any KPI from the slicer on the left side.
The page includes two important combo charts:
Combo Chart 1: MTD Trend
This chart shows:
-
Actual CY MTD
-
Target CY MTD
-
Actual PY MTD
This helps in understanding whether the KPI is improving or declining.
Combo Chart 2: YTD Trend
This chart shows:
-
Actual CY YTD
-
Target CY YTD
-
Actual PY YTD
This helps in checking long-term performance for:
-
Steel cutting
-
Welding completion
-
Assembly hours
-
Outfitting completion
-
Machinery installation
-
Safety performance
-
Energy consumption
Because the charts combine bars and lines, trends become extremely easy to understand.
Click to Purchases Shipbuilding KPI Dashboard in Power BI
3. KPI Definition Page – Drill-Through Insights
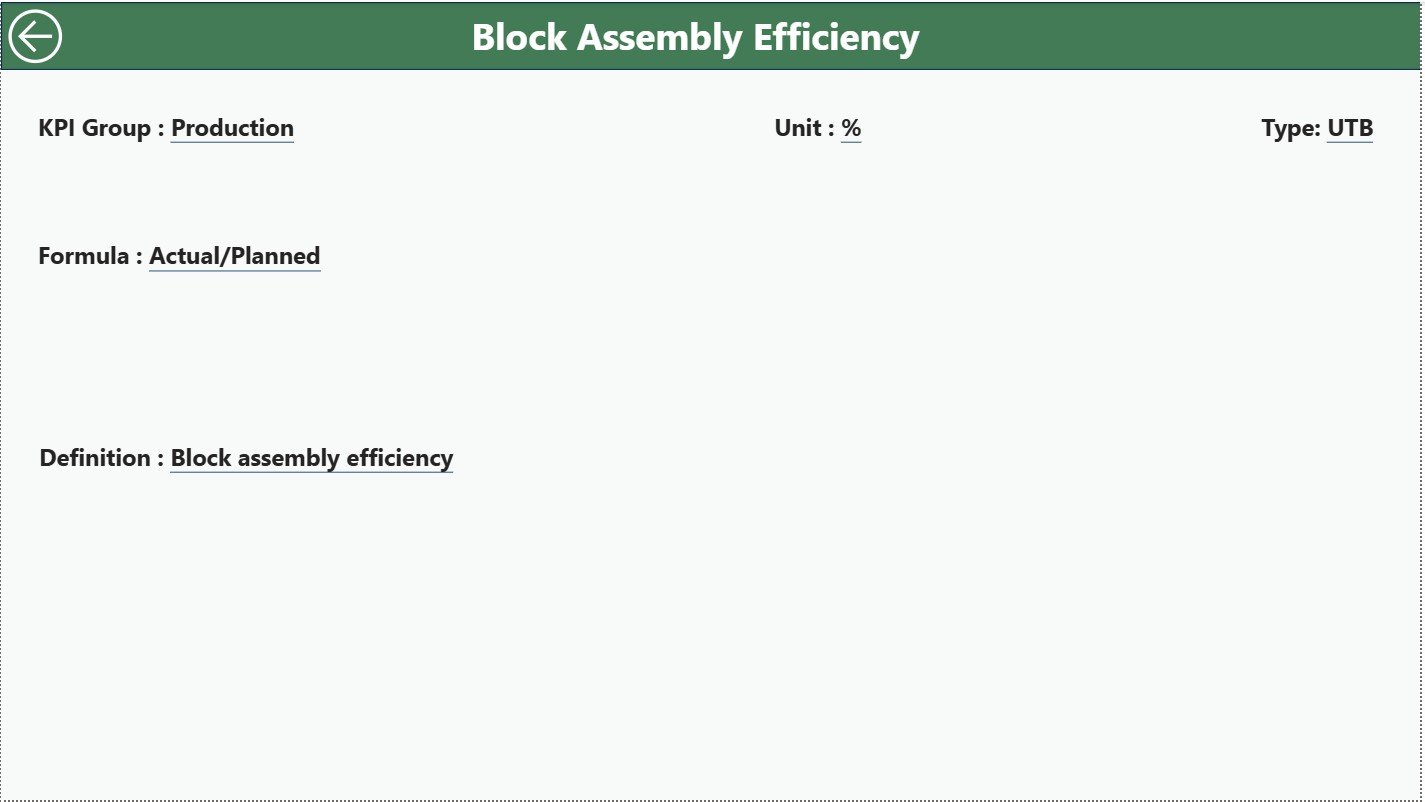
This page remains hidden and opens only when users drill through from the Summary Page. This page includes:
-
KPI Number
-
KPI Group
-
KPI Name
-
Unit
-
Formula
-
Definition
-
Type (LTB or UTB)
This page ensures that every team member understands how each KPI is calculated. Shipbuilding KPIs often include complex formulas. Therefore, this page reduces confusion and builds alignment across teams.
You can return to the Summary Page using the back button at the top-left corner.
Excel Data Structure – The Backbone of the Dashboard
This dashboard uses three Excel sheets as data sources:
1. Input_Actual Sheet
This sheet contains:
-
KPI Name
-
Month (first day of the month)
-
MTD Actual
-
YTD Actual
Example KPIs for shipbuilding:
-
Welding efficiency
-
Steel fabrication output
-
Block assembly rate
-
Dock occupancy
-
Delivery milestones
-
Safety incident count
-
Energy consumption
2. Input_Target Sheet
This sheet contains:
-
KPI Name
-
Month
-
MTD Target
-
YTD Target
Targets help shipyards compare planned vs actual performance.
3. KPI Definition Sheet
This sheet includes:
-
KPI Number
-
KPI Group
-
KPI Name
-
Unit
-
Formula
-
Definition
-
Type (LTB/UTB)
Common shipbuilding KPI types:
-
Lower the Better (LTB):
-
Defects, rework hours, safety incidents, fuel waste
-
-
Upper the Better (UTB):
-
Block fabrication rate, welding output, dock productivity
-
Since Power BI reads this sheet directly, filling it correctly is very important.
Click to Purchases Shipbuilding KPI Dashboard in Power BI
Advantages of Shipbuilding KPI Dashboard in Power BI
A shipbuilding dashboard delivers strong benefits across operations, quality, safety, supply chain, and management. Here are the major advantages:
1. Provides Real-Time Visibility
Shipyards deal with long projects. Therefore, real-time visibility becomes essential. This dashboard gives instant updates when the Excel sheet refreshes.
2. Reduces Project Delays
When KPIs highlight slow progress in fabrication or outfitting, teams can act early and reduce delays.
3. Improves Cost Control
Shipbuilding involves huge budgets. This dashboard helps track cost-related KPIs like:
-
Material efficiency
-
Rework hours
-
Scrap rate
-
Overtime hours
4. Enhances Safety Monitoring
Safety is the highest priority in shipyards. KPIs like near misses, incidents, and compliance rates help improve workplace safety.
5. Strengthens Communication
Every department—design, fabrication, welding, painting, assembly, safety, logistics—views the same performance report.
6. Makes Management Reviews Easier
With MTD, YTD, and PY comparisons, monthly review meetings become faster and more accurate.
7. Supports Data-Driven Planning
The dashboard helps leaders plan resources, manpower, equipment, and materials more efficiently.
Click to Purchases Shipbuilding KPI Dashboard in Power BI
Best Practices for the Shipbuilding KPI Dashboard in Power BI
To get the best performance from the dashboard, follow these practices:
1. Keep KPI Numbers and Names Consistent
Use the same name in both Actual and Target sheets.
2. Enter Month Values Correctly
Use the first date of each month. Incorrect dates break the trend charts.
3. Maintain Clean Data Formatting
Shipyards handle hundreds of values. Clean data ensures stable visuals.
4. Review Targets Regularly
Targets need updates based on season, project load, and capacity.
5. Track Both MTD and YTD
MTD helps in short-term decisions. YTD helps in long-term performance planning.
6. Encourage Teams to Use Drill-Through
Before taking action, users must understand KPI formulas.
7. Avoid Overloading KPIs
Choose only meaningful KPIs such as:
-
Production rate
-
Delivery timeline
-
Safety performance
-
Resource efficiency
-
Quality compliance
8. Update Data Before Review Meetings
Make sure Excel sheets have the latest values before refresh.
9. Check for KPI Type Errors
Incorrect LTB/UTB assignment may show wrong colors.
10. Use Trend Charts Frequently
Trend patterns reveal hidden performance levels that tables may not show.
How Does This Dashboard Help Shipyards Improve Operations?
Shipyards can track KPIs from many departments:
● Production KPIs
-
Steel cutting
-
Welding efficiency
-
Block assembly
-
Outfitting progress
● Quality KPIs
-
Rework hours
-
Defect rate
-
Inspection pass rate
● Safety KPIs
-
Incidents
-
Near misses
-
PPE compliance
● Logistics KPIs
-
Material availability
-
Dock usage
-
Crane utilization
● Project Management KPIs
-
Timeline variance
-
Milestone completion
This dashboard centralizes all these areas into one reporting platform.
Conclusion
A Shipbuilding KPI Dashboard in Power BI transforms the way shipyards monitor performance. It helps teams track MTD, YTD, and PY values for every major KPI. With cards, slicers, trend charts, and drill-through features, users can analyze everything quickly.
Since the dashboard connects with Excel, updating data becomes very simple. When shipyards use this kind of dashboard, they reduce delays, control cost, improve safety, and increase project predictability.
If you want better control over shipyard operations, a KPI dashboard in Power BI is the best solution.
Click to Purchases Shipbuilding KPI Dashboard in Power BI
Frequently Asked Questions (FAQs)
1. What is a Shipbuilding KPI Dashboard in Power BI?
It is a reporting dashboard that tracks shipyard KPIs using visuals like cards, tables, combo charts, and trend charts.
2. Who uses this dashboard?
Production heads, quality managers, safety teams, project managers, and senior leadership.
3. Can I add more KPIs?
Yes, you can add KPIs by entering new rows in the Excel sheets.
4. How do I update the dashboard?
Enter actual and target numbers in Excel and click Refresh in Power BI.
5. What visuals does the dashboard include?
Cards, tables, combo charts, slicers, and drill-through pages.
6. Does it support project timeline tracking?
Yes. You can track milestones using relevant KPIs.
7. Is Power BI easy to use for shipyards?
Yes. The dashboard works with Excel and requires no advanced technical skills.
Click to Purchases Shipbuilding KPI Dashboard in Power BI
Visit our YouTube channel to learn step-by-step video tutorials