Shopify Store Dashboard in Excel is a powerful, ready-to-use analytics template designed for Shopify store owners, e-commerce managers, and business analysts who want to track sales performance, monitor fulfillment efficiency, and analyze profitability — all inside a single Excel workbook. This Excel Dashboard Template transforms raw Shopify order data into clear visual insights with 5 interactive dashboard pages, dynamic pivot charts, KPI cards, and slicers for instant filtering.
Whether you are running a single Shopify store or managing multiple stores, this dashboard gives you a 360-degree view of your business performance. From revenue trends and fulfillment rates to sales channel comparisons and regional profitability — every critical metric is just one click away.
Click here to Purchase the Shopify Store Dashboard in Excel
Key Features of the Shopify Store Dashboard in Excel
This dashboard includes 5 dedicated analysis pages, a structured Data Sheet, and a Support Sheet with automated pivot tables — 7 sheets total. It tracks 5 core KPIs (Total Records, Total Revenue, Total Cost, Average Order Value, and Profit Margin %) and presents 15+ chart-based analyses covering sales, products, channels, fulfillment, and regional performance. Interactive slicers on each page let you filter your entire dashboard with a single click. The entire system runs on pivot tables — no VBA, no macros, no coding required.
Click here to Purchase the Shopify Store Dashboard in Excel
Dashboard Pages Explained
1. Overview Page
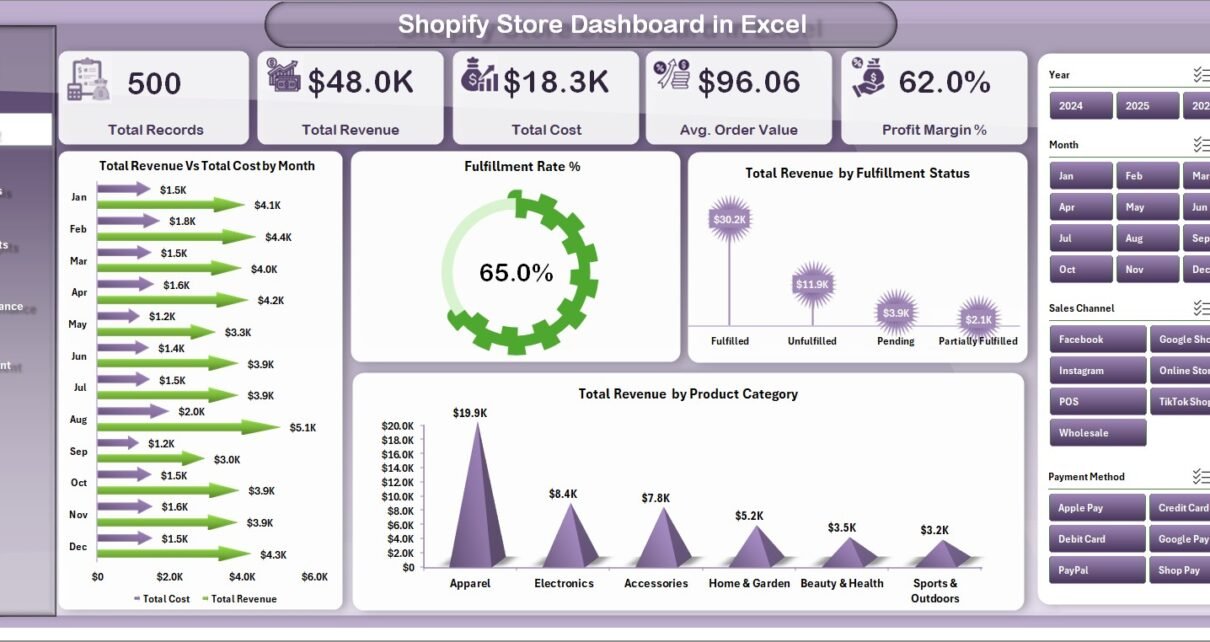
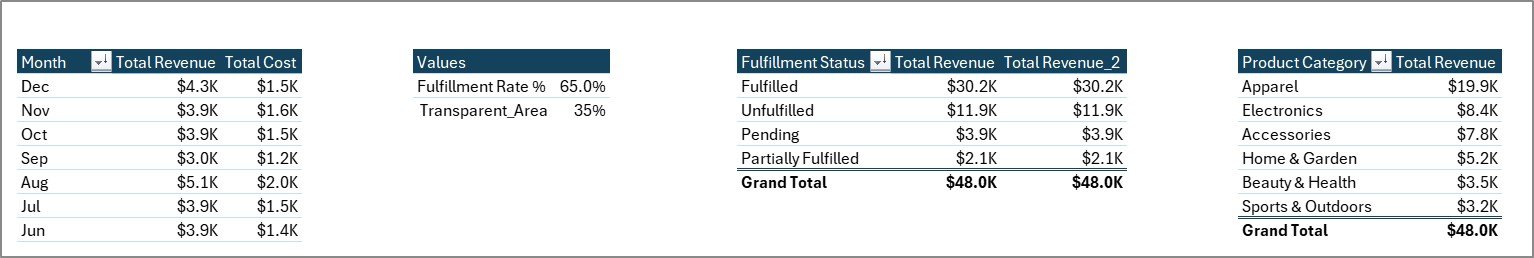
The Overview Page serves as your Shopify command center. At the top, KPI cards display Total Records, Total Revenue, Total Cost, Avg. Order Value, and Profit Margin %. Below, you will find charts showing Total Revenue by Month to spot growth patterns, Fulfillment Rate % to monitor operational efficiency, Total Revenue by Fulfillment Status to compare fulfilled vs unfulfilled orders, and Total Revenue by Product Category to identify your best-selling categories. Slicers on the right let you filter everything instantly by any dimension.
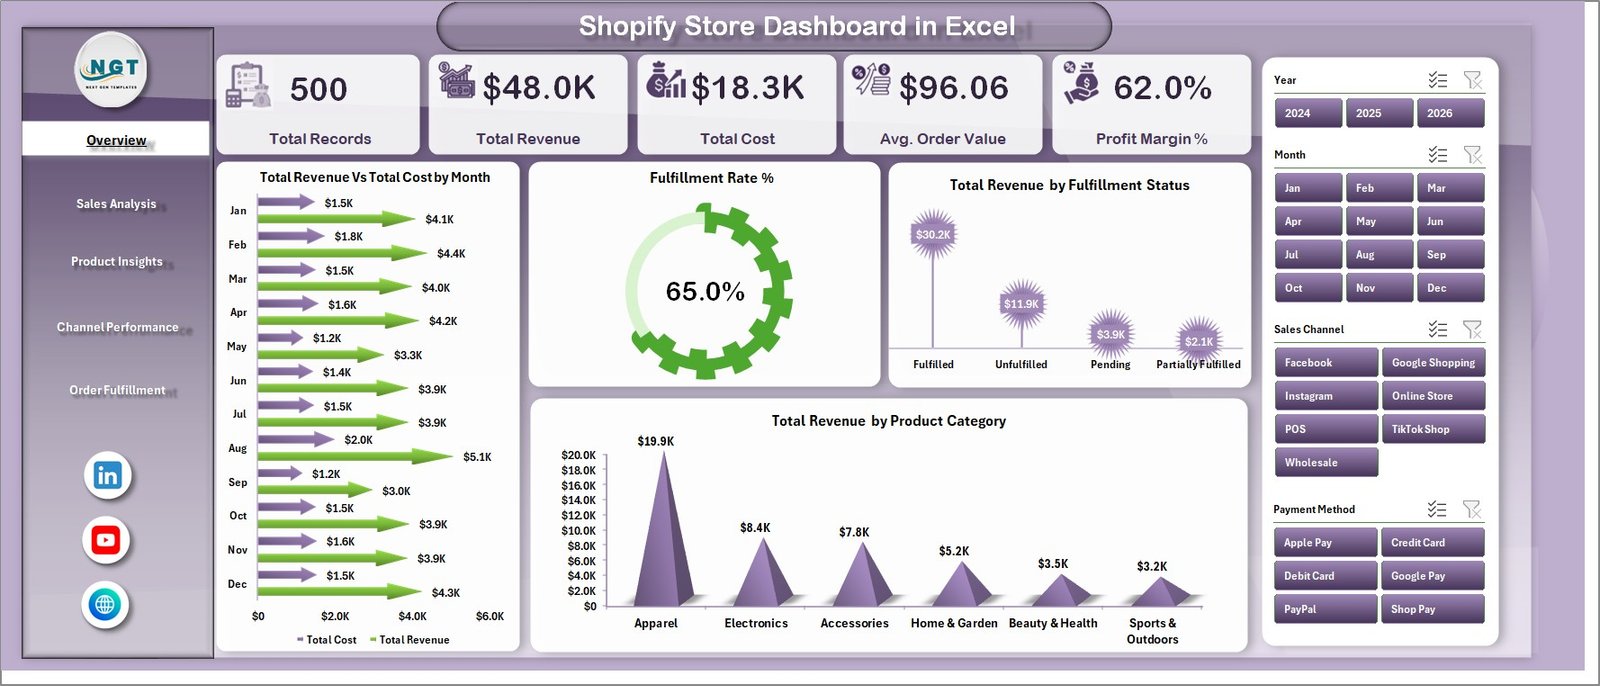 Shopify Store Dashboard in Excel
2. Sales Analysis Page
This page dives deeper into your revenue and cost structure. It features Profit Margin % by Order Status to understand how profitability varies across order stages, Total Revenue by Customer Type to compare new versus returning buyers, Total Records by Payment Method to see customer payment preferences, and Total Revenue vs Total Cost by Region to evaluate geographic profitability. This analysis helps you understand where your money is coming from and where it is going.
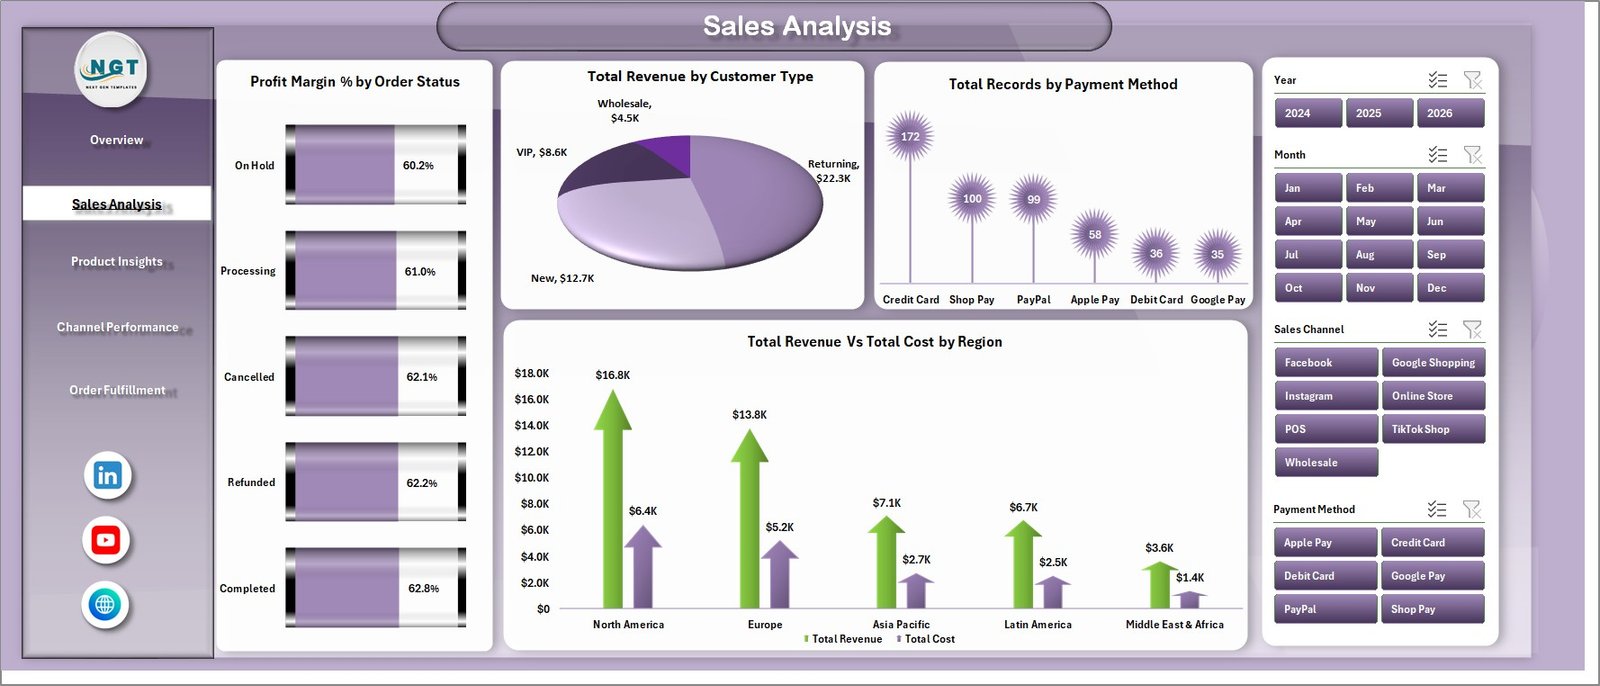 Sales Analysis
3. Product Insights Page
Understand your product portfolio at a granular level. This page visualizes Total Quantity by Product Category to identify your volume leaders, Profit Margin % by Customer Type for segment-level profitability analysis, Total Discount by Product Category to track how promotions impact each category, and Net Profit by Region to uncover your most profitable geographic markets. It helps you make smarter decisions about pricing, promotions, and inventory allocation.
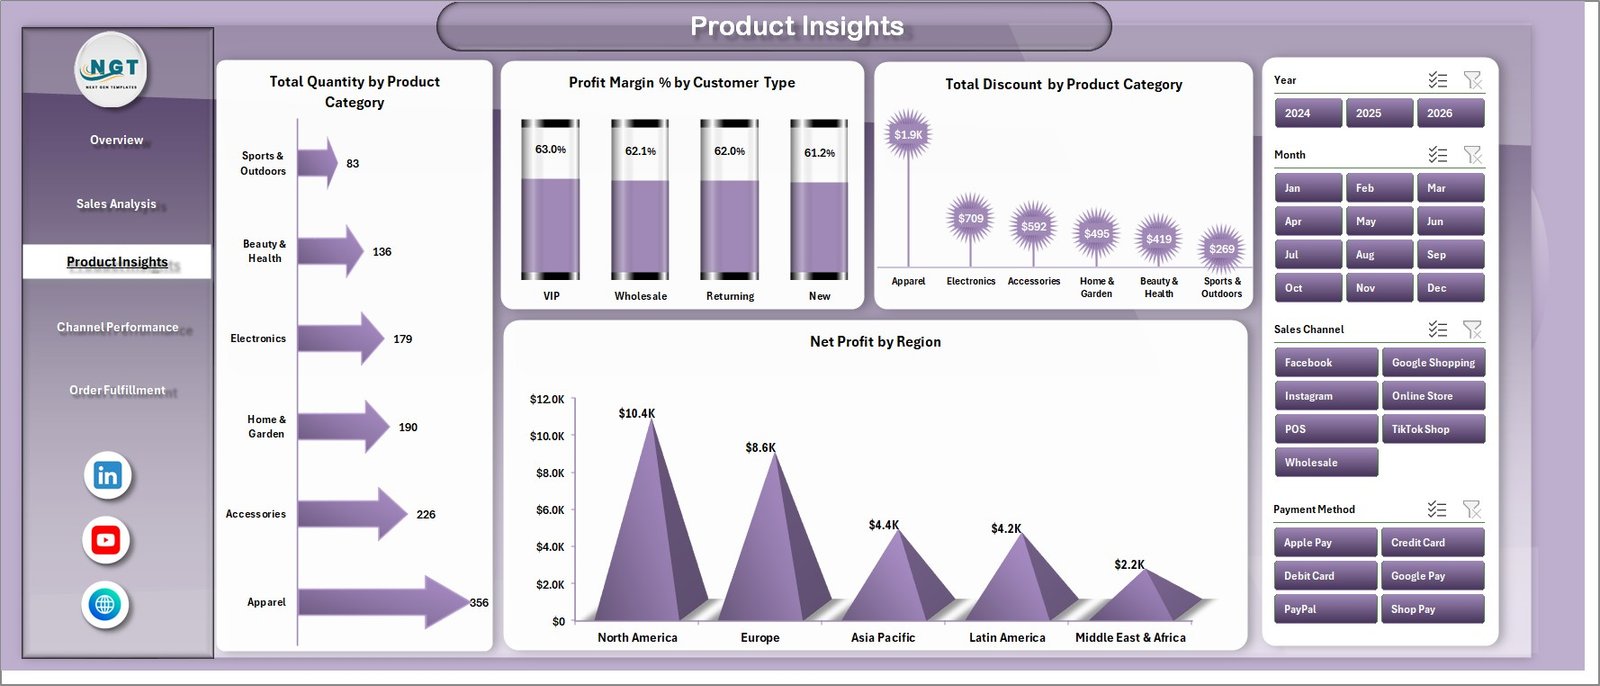 Product Insights
4. Channel Performance Page
If you sell through multiple Shopify sales channels (Online Store, POS, Social Media, Buy Button, etc.), this page is essential. It displays Total Records by Sales Channel, Total Refunds by Customer Type, Avg. Order Value by Sales Channel, and Fulfilled Orders by Sales Channel. This helps you identify which channels drive the most revenue and which ones need attention for improvement. You can quickly determine where to invest more marketing budget.
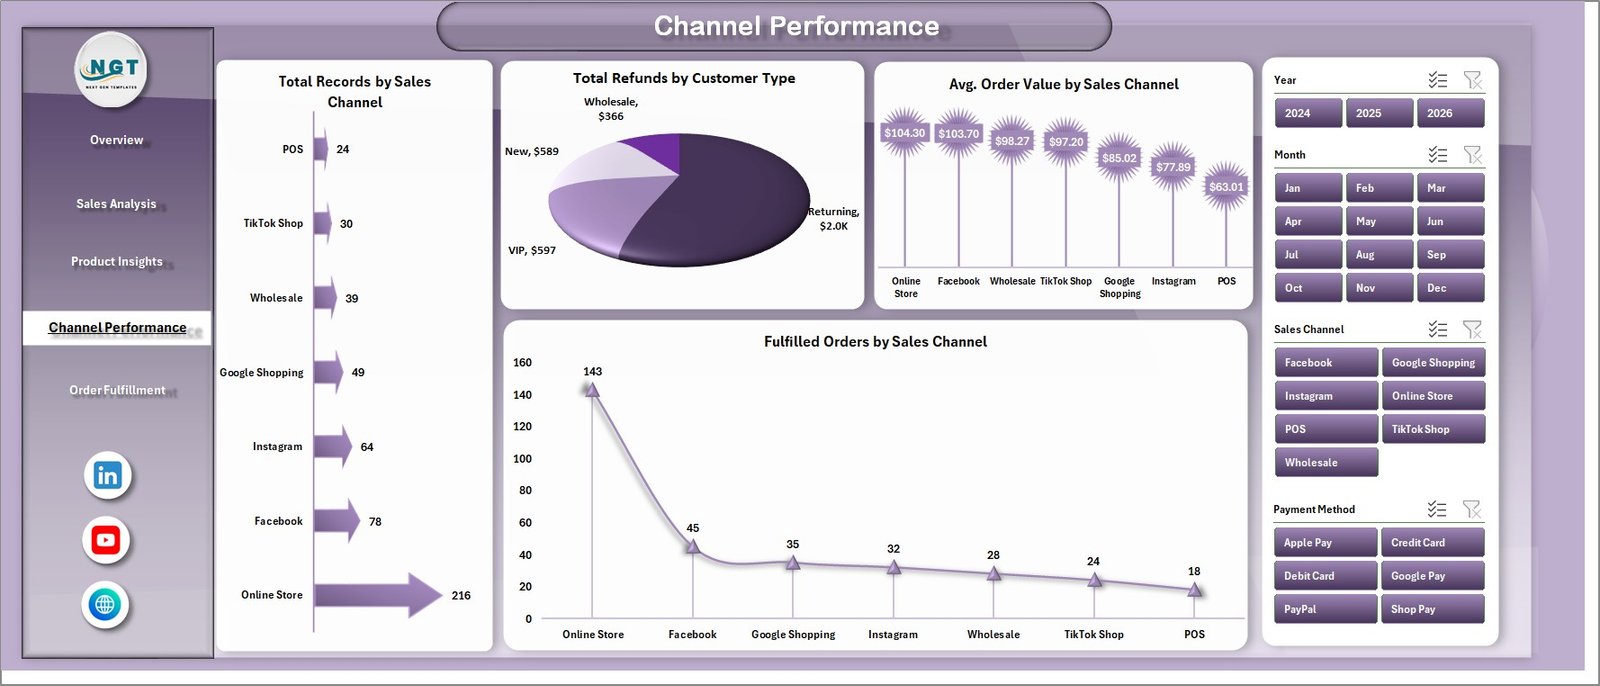 Channel Performance
5. Order Fulfillment Page
Monitor your fulfillment operations with dedicated tracking charts. This page displays Total Records by Order Status to see how orders are distributed across stages, Total Records by Fulfillment Status to compare fulfilled, unfulfilled, and partially fulfilled orders, and Fulfilled Orders by Month to track your fulfillment efficiency over time. This is critical for identifying delivery bottlenecks and improving customer satisfaction.
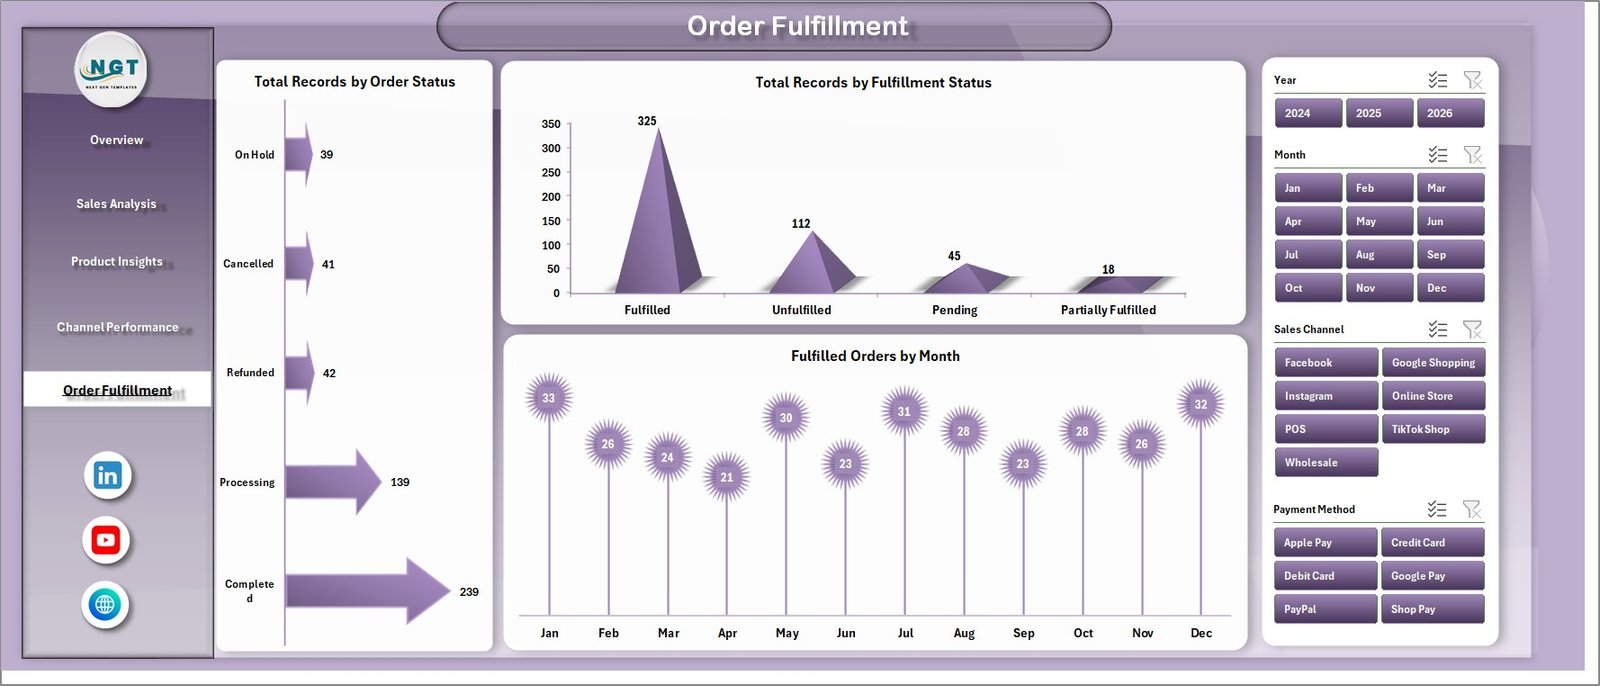 Order Fulfillment
6. Data Sheet
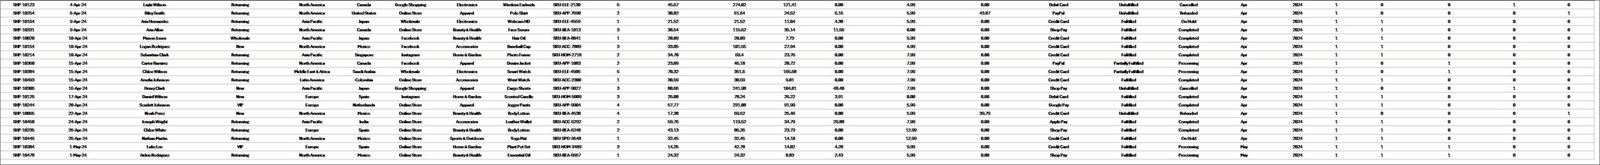
This is where you paste your Shopify store data. Simply export your orders from Shopify Admin, copy the relevant columns into this sheet, and the entire dashboard refreshes when you click Refresh All. The sample data provided gives you a clear understanding of the expected column format.
 Data Sheet Tab
7. Support Sheet
This sheet contains multiple pivot tables that dynamically power every chart and KPI card in the dashboard. After updating data in the Data Sheet, simply go to the Data tab in Excel and click Refresh All. All pivots update and all charts reflect the latest numbers. You can keep this sheet hidden during daily use.
 Support Sheet Tab
Advantages of the Shopify Store Dashboard in Excel
- Complete Shopify Analytics in One File — No need for expensive BI tools or third-party apps.
- 5 Focused Analysis Pages — Each page targets a specific business dimension for deeper insights.
- Automated Updates — Pivot tables and charts refresh automatically with one click.
- Interactive Slicers — Filter your data across any dimension without modifying the underlying data.
- No Technical Skills Required — Zero VBA, zero macros. Just paste data and click refresh.
- Fully Customizable — Add new charts, extend data columns, or create additional analysis pages.
- Offline Access — Works entirely in Microsoft Excel for desktop with no internet dependency.
- Multi-Store Ready — Combine data from multiple Shopify stores into a single dashboard.
Opportunities for Improvement
- Add a Customer Segmentation page with RFM (Recency, Frequency, Monetary) analysis for targeted marketing.
- Include a Return Rate Analysis page to drill into return reasons by product, region, and channel.
- Add a Forecasting Sheet using historical sales trends to predict future revenue and demand.
- Integrate with Power Query for automated data import from Shopify CSV exports.
- Add conditional formatting to KPI cards to highlight metrics that fall below target thresholds.
Best Practices for Using This Dashboard
- Export your Shopify order data weekly or monthly to maintain current analytics.
- Always match column headers in the Data Sheet before pasting new data.
- Use slicers to create focused views for team meetings or stakeholder presentations.
- Review the Channel Performance page monthly to optimize your marketing spend allocation.
- Check the Fulfillment page regularly to catch delivery issues before they affect customer satisfaction.
- Back up your file before making structural changes to the pivot tables or chart layouts.
Explore Relevant Templates
If you found this Shopify Store Dashboard useful, explore these related templates on NextGenTemplates.com:
- Online Marketplaces Dashboard in Excel — Track performance across Amazon, eBay, Walmart, Etsy, and Shopify in a single dashboard.
- Online Marketplaces KPI Scorecard in Excel — Monitor marketplace KPIs with actual vs target tracking and trend analysis.
- E-Commerce Sales Performance Dashboard in Google Sheets — Cloud-based e-commerce analytics with real-time team collaboration.
- E-Commerce Sales Performance Tracker in Google Sheets — Track online sales, payments, and shipping performance.
Frequently Asked Questions
What is the best Excel dashboard template for tracking Shopify store performance?
The Shopify Store Dashboard in Excel is specifically designed for Shopify store analytics. It includes 5 interactive pages tracking sales, fulfillment, channels, products, and regional performance with automated pivot charts and slicers. It requires no coding or VBA skills.
How many KPIs does this Shopify Excel dashboard track?
This dashboard tracks 5 key performance indicators — Total Records, Total Revenue, Total Cost, Average Order Value, and Profit Margin %. Additionally, it provides 15+ chart-based analyses across fulfillment rates, sales channels, product categories, payment methods, customer types, and regional breakdowns.
Can I import data directly from Shopify into this Excel dashboard?
Currently, you need to export your order data from Shopify Admin as a CSV file and paste the relevant columns into the Data Sheet. For advanced users, Power Query can be configured to automate the import process from the downloaded CSV files.
Is this dashboard suitable for Shopify Plus stores with high order volumes?
Yes. Since the dashboard uses Excel pivot tables, it can handle thousands of order records efficiently. For extremely large datasets (100,000+ rows), consider using Power Pivot or splitting data into monthly files for optimal performance.
What Excel version do I need to use this dashboard?
This dashboard works best with Microsoft Excel 2016 or later (desktop version). It uses pivot tables ands slicers which are standard Excel features. It is not designed for Excel Online or Google Sheets due to slicer and pivot table limitations in those platforms.
How do I track Shopify store fulfillment performance in Excel?
The Order Fulfillment page in this dashboard provides dedicated charts showing Total Records by Order Status, Total Records by Fulfillment Status, and Fulfilled Orders by Month. This gives you clear visibility into your delivery operations and helps identify bottlenecks.
Conclusion
The Shopify Store Dashboard in Excel is a complete analytics solution for anyone running a Shopify store. With 5 interactive dashboard pages, automated pivot tables, dynamic charts, and interactive slicers, it transforms your raw order data into actionable business insights. Whether you want to track revenue trends, compare sales channels, analyze product profitability, or monitor fulfillment efficiency — this dashboard delivers everything you need in one file.
Click here to Purchase the Shopify Store Dashboard in Excel
Visit our YouTube channel to learn step-by-step video tutorials.