Shopify Store Dashboard in Power BI is the complete analytics solution for Shopify store owners and e-commerce teams who want deep visibility into their sales performance, order fulfillment, channel effectiveness, and profitability — all inside a professional Power BI report. If you manage a Shopify store and want to stop relying on basic Shopify reports, this Power BI Dashboard Template transforms your raw order data into actionable visual insights in minutes. 📊💡
This dashboard includes 5 interactive analysis pages with dynamic charts, KPI cards, and slicers. Whether you need to compare revenue by product category, track fulfillment rates across channels, analyze customer segmentation, or study monthly profitability trends — this Shopify Store Dashboard in Power BI delivers professional-grade analytics without coding or complex DAX formulas.
👉 Click here to Purchase Shopify Store Dashboard in Power BI
Key Features of Shopify Store Dashboard in Power BI
The Shopify Store Dashboard in Power BI is packed with features designed to give Shopify sellers complete control over their business data. Here are the standout capabilities that make this template essential for any e-commerce operation:
- 5 Dedicated Dashboard Pages — covering Overview, Sales Analysis, Product Insights, Channel Performance, and Order Fulfillment
- 5 Core KPI Cards — Total Orders, Total Revenue, Total Cost, Avg Order Value, and Profit Margin % displayed prominently on the Overview page
- 15+ Analytical Charts — spanning revenue analysis, fulfillment tracking, channel comparison, product performance, and customer segmentation
- Interactive Slicers — filter the entire dashboard by product category, region, sales channel, order status, customer type, or month with a single click
- Regional Profitability Analysis — compare Total Cost vs Total Revenue by Region to identify your most and least profitable markets
- Customer Type Segmentation — understand revenue differences between new and returning buyers
- Fulfillment Performance Monitoring — track order status breakdowns and fulfilled orders by month to optimize delivery operations
- Zero Coding Required — simply connect your Shopify data export and refresh the report
Dashboard Pages Explained
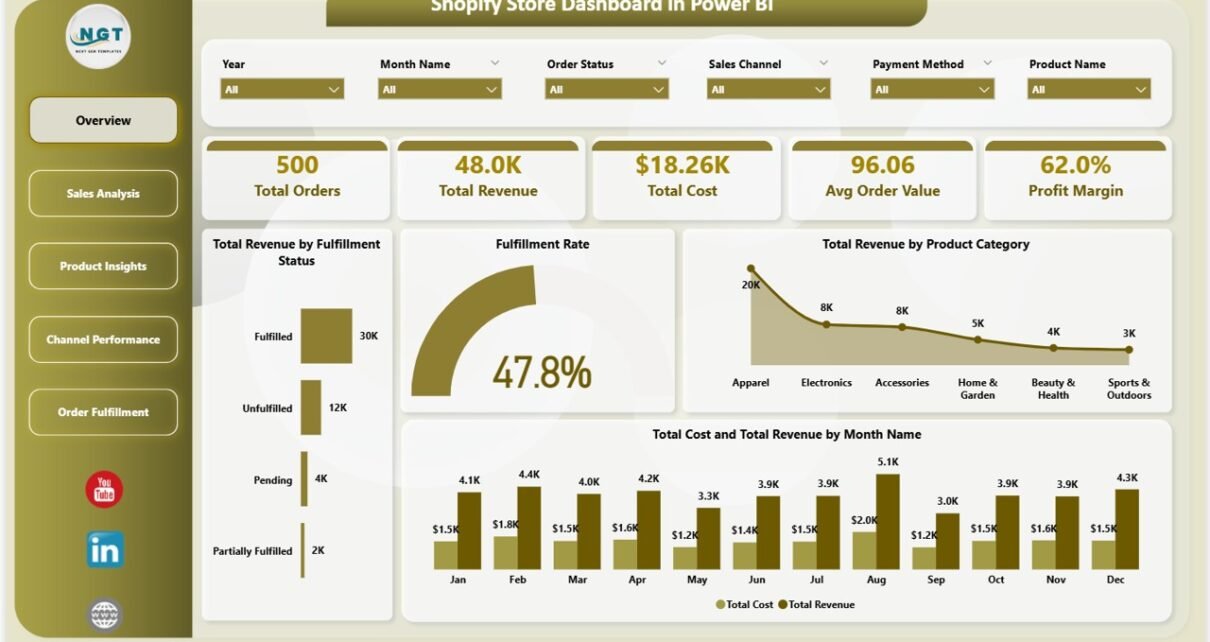
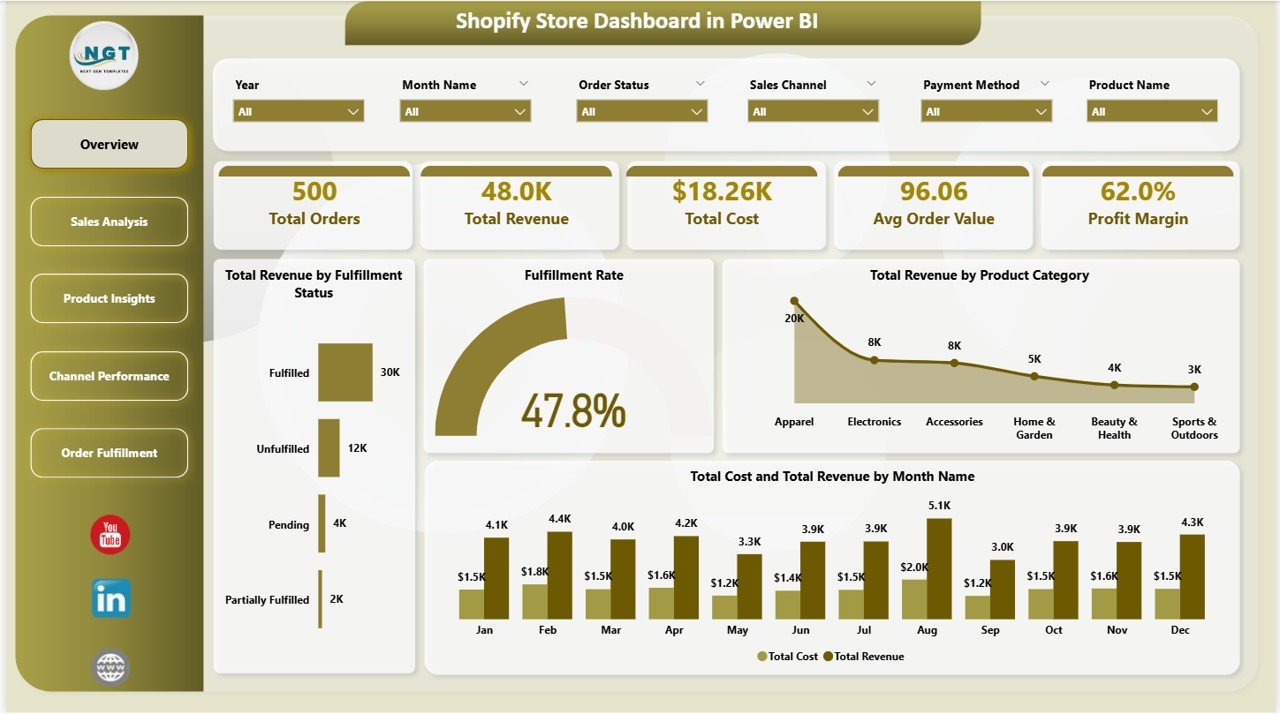
1. Overview Page — Your Shopify Command Center
The Overview Page provides a high-level snapshot of your entire Shopify store performance. At the top, KPI cards display Total Orders, Total Revenue, Total Cost, Avg Order Value, and Profit Margin %. Below, dynamic charts visualize Total Revenue by Fulfillment Status, Fulfillment Rate, Total Revenue by Product Category, and Total Cost and Total Revenue by Month Name. Multiple slicers allow instant filtering across all dimensions.
This page serves as your daily command center — open it every morning to get an instant pulse on how your store is performing. The combination of high-level KPIs with detailed breakdowns makes it easy to spot trends and anomalies at a glance.
Shopify Store Dashboard in Power BI
2. Sales Analysis Page
The Sales Analysis page dives deeper into your Shopify sales performance. It features Profit Margin by Order Status to understand profitability across different order stages (delivered, pending, cancelled, returned), Total Cost and Total Revenue by Region to evaluate geographic profitability, and Total Revenue by Customer Type to compare purchasing patterns between new and returning buyers.
This analysis helps you optimize pricing strategies by region, identify which order statuses are dragging down margins, and develop targeted retention campaigns for your most valuable customer segments.
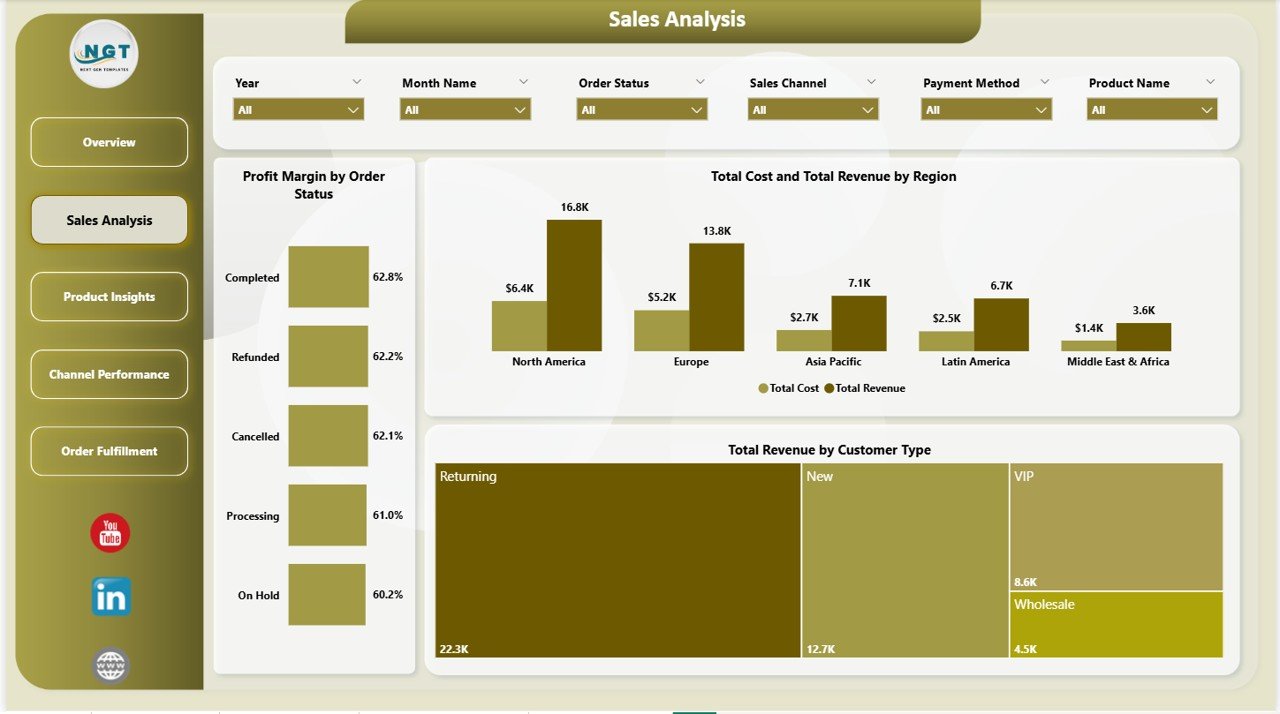
Sales Analysis
3. Product Insights Page
The Product Insights page helps you understand product-level performance in granular detail. It shows Total Quantity by Product Category to identify volume leaders, Net Profit by Region to uncover your most profitable geographic markets, and Total Discount by Product Category to track the impact of promotional campaigns on each product line.
By combining quantity, profit, and discount data, you can make smarter inventory purchasing decisions, optimize which products to promote in each region, and evaluate whether your discounting strategies are actually driving profitable growth.
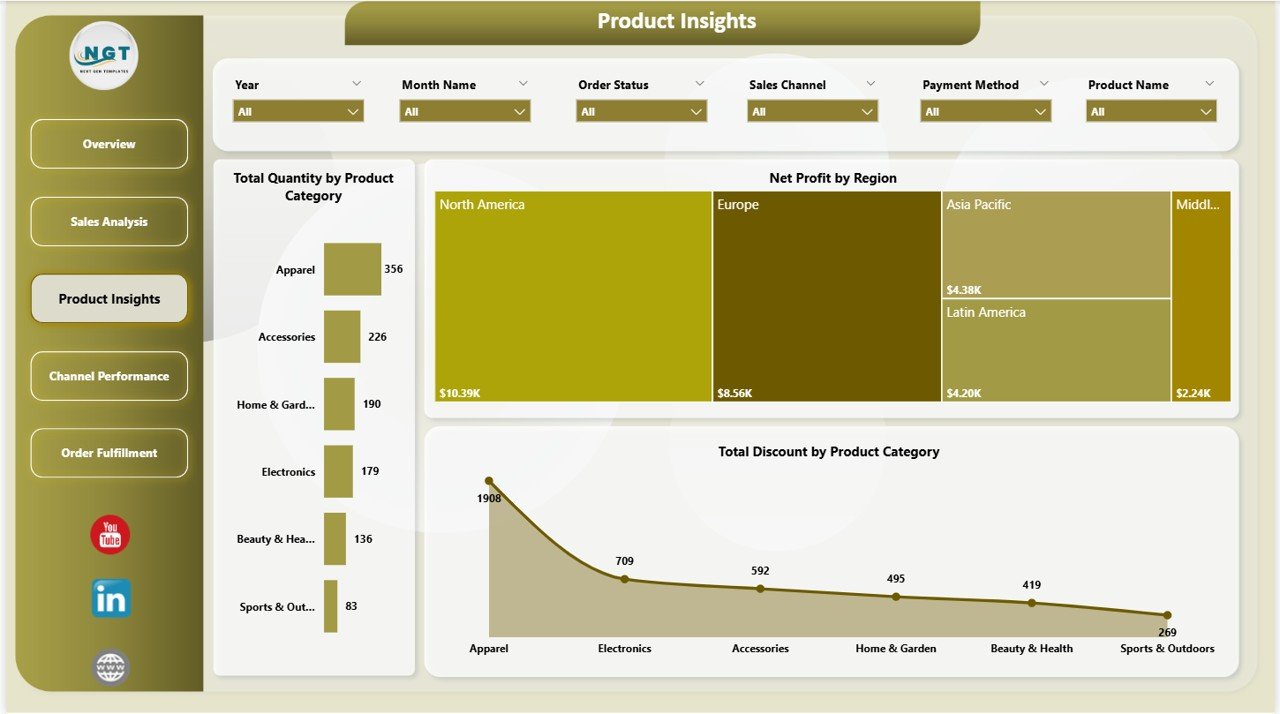
Product Insights
4. Channel Performance Page
If you sell through multiple Shopify sales channels — online store, POS, social media, marketplaces — this page is essential. It visualizes Total Orders by Sales Channel to see where volume is coming from, Avg Order Value by Sales Channel to compare which channels drive higher-value purchases, and Fulfilled Orders by Sales Channel to evaluate operational efficiency across platforms.
Channel performance data helps you allocate marketing budgets more effectively, double down on channels with the highest AOV, and investigate fulfillment bottlenecks on underperforming channels.
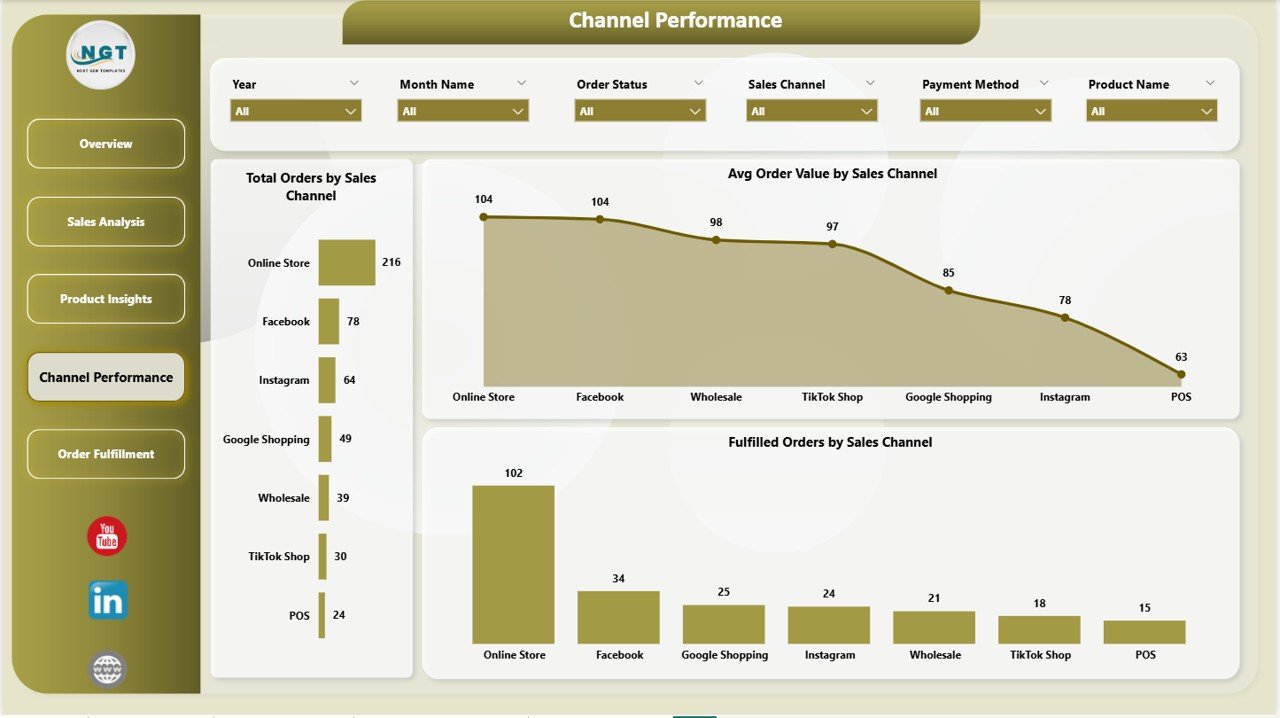
Channel Performance
5. Order Fulfillment Page
The Order Fulfillment page focuses on delivery operations and logistics tracking. It displays Total Orders by Order Status to monitor the pipeline of pending, shipped, delivered, and returned orders, Fulfilled Orders by Month Name to track fulfillment velocity over time, and Total Orders by Fulfillment Status to compare fulfilled vs unfulfilled vs partially fulfilled orders.
This page is critical for operations teams who need to ensure customer satisfaction through timely delivery. Spotting fulfillment delays early allows you to resolve issues before they impact customer reviews and repeat purchase rates.
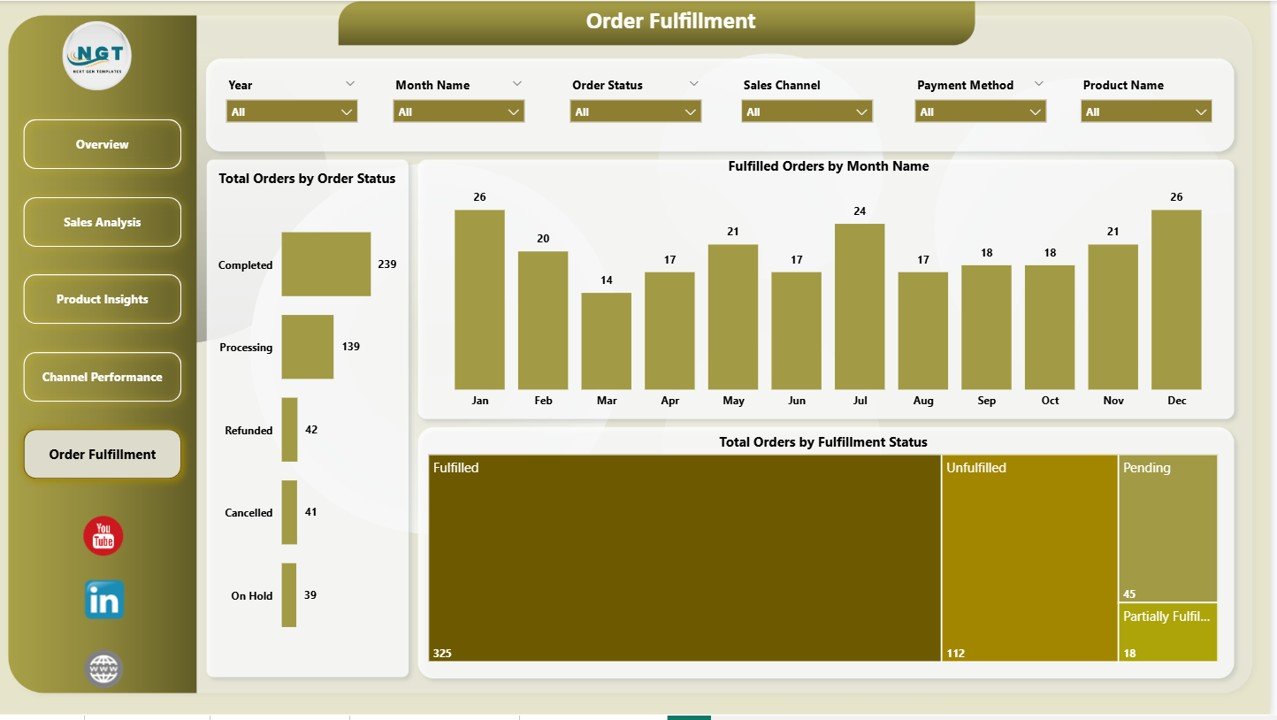
Order Fulfillment
Advantages of Shopify Store Dashboard in Power BI
There are several compelling reasons to use Power BI for your Shopify analytics instead of relying solely on built-in Shopify reporting:
- Unified View — see all your Shopify metrics in one place instead of navigating between multiple Shopify admin pages
- Advanced Visualizations — Power BI offers richer chart types, conditional formatting, and cross-filtering capabilities that Shopify’s native reports cannot match
- Multi-Store Consolidation — combine data from multiple Shopify stores into a single unified dashboard
- Historical Analysis — maintain unlimited historical data for long-term trend analysis and forecasting
- Team Sharing — publish to Power BI Service for cloud-based collaboration with your entire team
- Cost Effective — Power BI Desktop is free, making this a zero-subscription analytics solution
- Full Customization — modify any visual, add new measures, create additional pages, or connect additional data sources
Opportunities for Improvement
- Add Customer Lifetime Value (CLV) calculations to identify your most valuable long-term customers
- Include inventory level tracking by connecting Shopify inventory data for stock management
- Build a marketing attribution page to connect campaign spend data with order revenue
- Add time intelligence measures like YoY growth, MoM change, and rolling averages using DAX
- Connect Google Analytics data for a complete view of traffic-to-conversion funnel performance
Best Practices
- Export your Shopify order data weekly or monthly and refresh the Power BI report to keep analytics current
- Use the slicers strategically — filter by specific time periods during team meetings to focus discussions
- Share the report via Power BI Service so your entire team has access to the same insights
- Monitor the Fulfillment page daily during high-volume periods like holiday seasons
- Compare Channel Performance monthly to identify shifts in customer acquisition patterns
- Use Product Insights data to inform inventory purchasing and promotional planning decisions
Explore Relevant Templates
📊 Shopify Store Dashboard in Excel — Track Shopify store performance using Excel pivot tables, slicers, and automated charts.
📋 Online Marketplaces KPI Scorecard in Excel — Monitor marketplace KPIs with actual vs target comparisons and trend analysis.
📈 E-Commerce Sales Performance Dashboard in Google Sheets — Cloud-based e-commerce analytics with real-time collaboration.
📦 Online Marketplaces Dashboard in Excel — Track orders, returns, profit, ratings, and trends across Amazon, eBay, Walmart, and more.
Frequently Asked Questions
What is the best Power BI dashboard template for Shopify store analytics?
The Shopify Store Dashboard in Power BI is one of the best options available. It includes 5 interactive pages tracking Total Orders, Total Revenue, Total Cost, Avg Order Value, and Profit Margin % with over 15 analytical charts covering sales, products, channels, and fulfillment.
How do I connect my Shopify data to Power BI?
Export your orders from Shopify Admin (Orders → Export → CSV). Open the .pbix template in Power BI Desktop and replace the sample data source with your exported CSV file. Click Refresh and all 5 dashboard pages update automatically.
Do I need Power BI Pro to use this dashboard?
No. Power BI Desktop is completely free to download from Microsoft. You only need Power BI Pro if you want to publish and share the report via Power BI Service cloud.
Can this dashboard track multiple Shopify stores?
Yes. Combine order data from multiple stores into one data source. The dashboard analyzes all data together. Alternatively, maintain separate .pbix files for independent analysis.
What charts does the Shopify Store Dashboard include?
The dashboard includes revenue and cost trend charts, fulfillment rate gauges, category-wise quantity and discount analysis, regional profitability comparisons, sales channel performance charts, customer type segmentation visuals, and monthly order fulfillment tracking across 5 pages.
Is this template customizable?
Yes. The Power BI file is fully open. You can add pages, create DAX measures, modify visual styles, connect additional data sources, and extend the data model as your needs grow.
Conclusion
The Shopify Store Dashboard in Power BI gives e-commerce teams complete control over their store performance analytics. With 5 dedicated pages and over 15 charts, it transforms raw Shopify data into clear, actionable business intelligence. Download it today and start making data-driven decisions.
👉 Click here to Purchase Shopify Store Dashboard in Power BI
🎥 Visit our YouTube channel for tutorials:
👉 Youtube.com/@PK-AnExcelExpert