Skill development missions play a vital role in improving employment opportunities, strengthening economies, and building a skilled workforce. Governments, NGOs, and training institutions continuously run multiple programs to train candidates across different sectors. However, managing thousands of trainees, training centers, courses, and performance indicators becomes challenging without proper analytics.
Many organizations still rely on scattered spreadsheets and manual reports. As a result, decision-makers struggle to evaluate program performance quickly. Moreover, tracking enrollment trends, completion rates, and satisfaction scores becomes time-consuming.
Therefore, organizations increasingly adopt Power BI dashboards to transform raw training data into meaningful insights. The Skill Development Missions Dashboard in Power BI helps administrators monitor mission progress, analyze training effectiveness, and make faster data-driven decisions.
Click to Purchases Skill Development Missions Dashboard in Power BI
In this comprehensive guide, you will learn everything about the Skill Development Missions Dashboard in Power BI, including features, structure, benefits, best practices, and implementation strategies.
What Is a Skill Development Missions Dashboard in Power BI?
A Skill Development Missions Dashboard in Power BI is an interactive analytics solution designed to monitor and evaluate skill development programs using visual reports and real-time insights.
Instead of reviewing multiple files, stakeholders can view all performance metrics on one centralized platform. Consequently, administrators understand trends faster and improve program outcomes effectively.
This dashboard helps organizations track:
-
Candidate enrollment and completion
-
Training center performance
-
Course effectiveness
-
Program type success rates
-
Monthly progress trends
-
Trainer satisfaction levels
-
State-wise mission performance
Because Power BI provides dynamic filtering and visualization, users can instantly explore data from different perspectives.
Why Do Skill Development Programs Need a Dashboard?
Skill development missions generate large volumes of data daily. Without visualization tools, teams face several operational challenges.
Common Problems Without a Dashboard
-
Manual reporting consumes too much time.
-
Data remains scattered across departments.
-
Performance evaluation becomes inconsistent.
-
Decision-making slows down.
-
Trends remain hidden in raw data.
However, a Power BI dashboard solves these problems by converting complex datasets into easy visuals.
As a result, leaders focus on strategy instead of data collection.
Key Features of the Skill Development Missions Dashboard in Power BI
This dashboard contains five interactive pages inside the Power BI desktop application. Each page focuses on a specific analytical area, ensuring complete performance visibility.
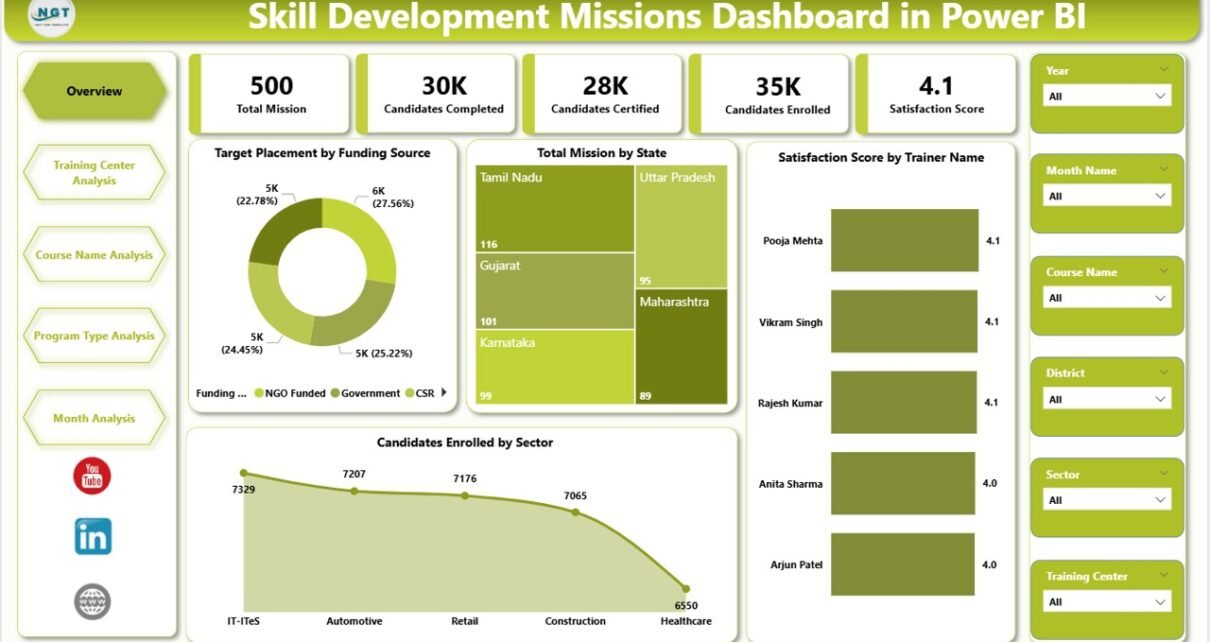
1. Overview Page – Mission Performance at a Glance
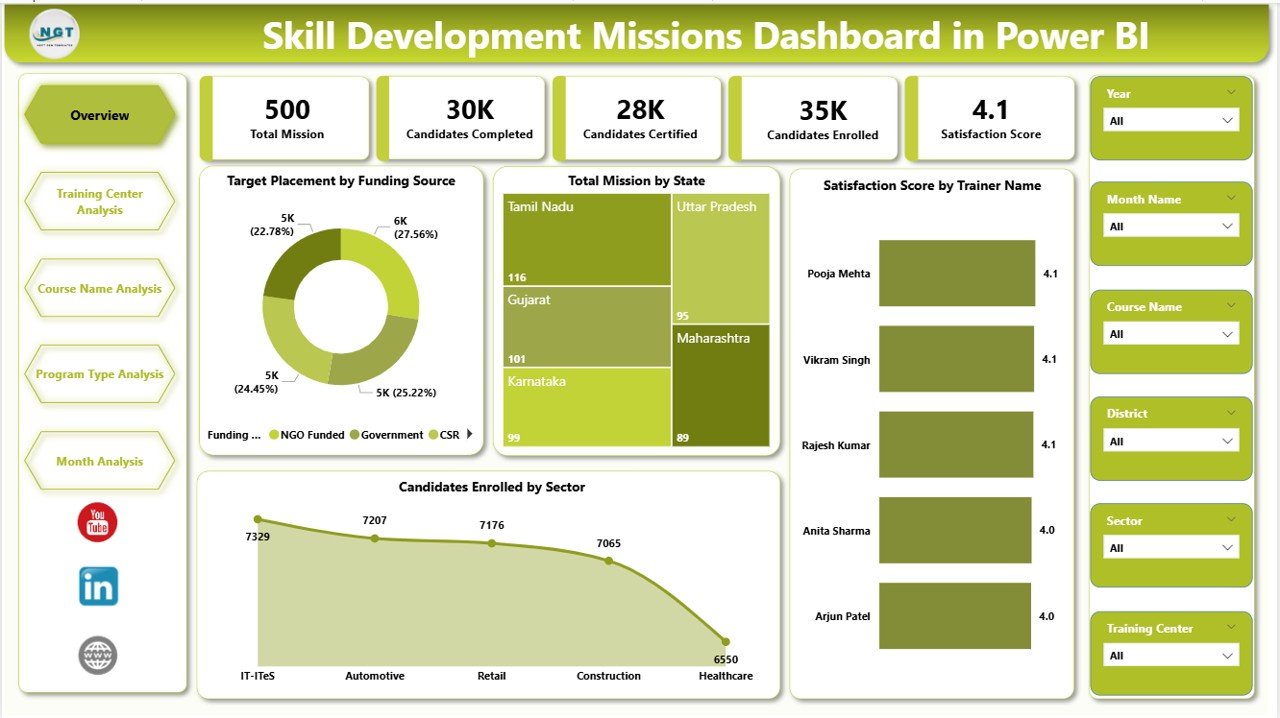
The Overview Page acts as the central control panel of the dashboard. Users quickly understand overall mission performance without navigating multiple reports.
KPI Cards Included
-
Target Placement by Funding Source
-
Total Mission by State
-
Satisfaction Score by Trainer Name
-
Candidates Enrolled by Sector
These KPI cards provide instant insights into program achievements.
Visual Insights Available
-
Sector-wise candidate enrollment trends
-
Trainer satisfaction performance
-
Funding-based placement tracking
-
State-level mission analysis
Additionally, slicers allow users to filter data dynamically. Therefore, decision-makers analyze specific regions or programs instantly.
2. Training Center Analysis – How Do Training Centers Perform?
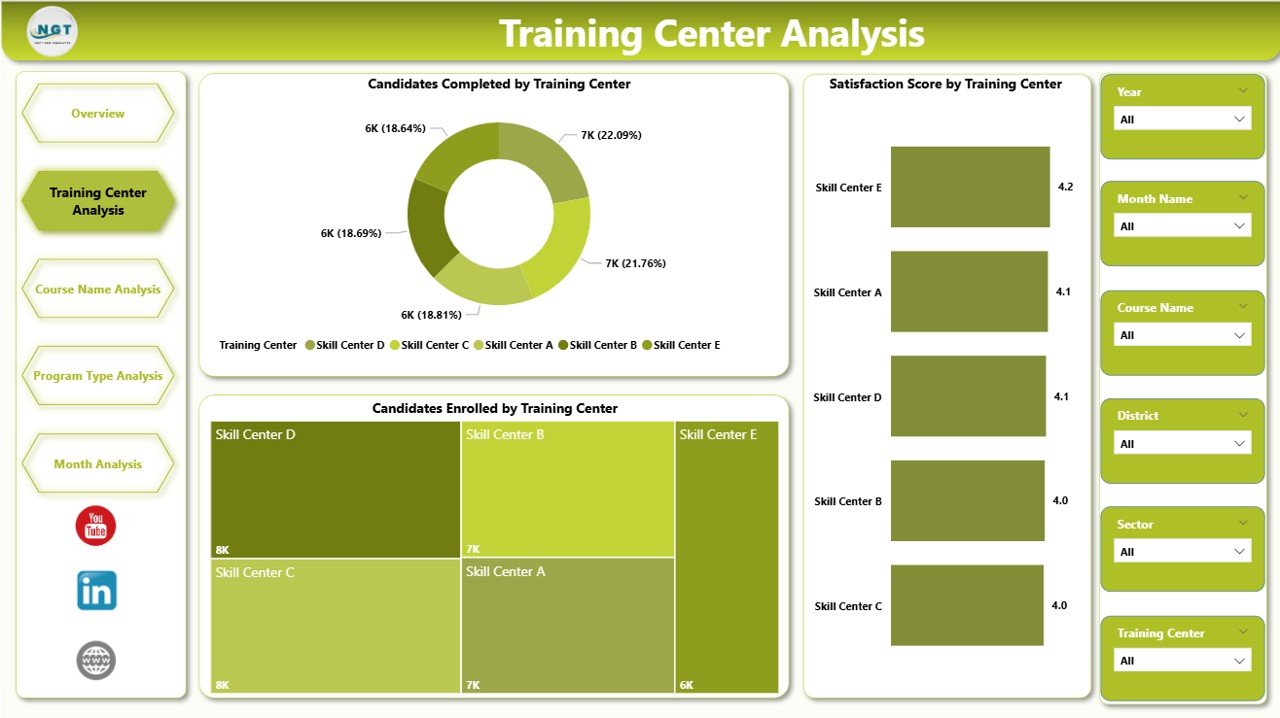
Training centers directly influence program success. Hence, analyzing their performance becomes essential.
The Training Center Analysis Page provides detailed evaluation using interactive visuals.
Charts Included
-
Candidates Completed by Training Center
-
Satisfaction Score by Training Center
-
Candidates Enrollment by Training Center
Through these visuals, administrators can:
-
Identify high-performing centers
-
Detect underperforming locations
-
Improve resource allocation
-
Monitor training quality
Consequently, organizations ensure consistent training standards across centers.
Click to Purchases Skill Development Missions Dashboard in Power BI
3. Course Name Analysis – Which Courses Deliver the Best Results?
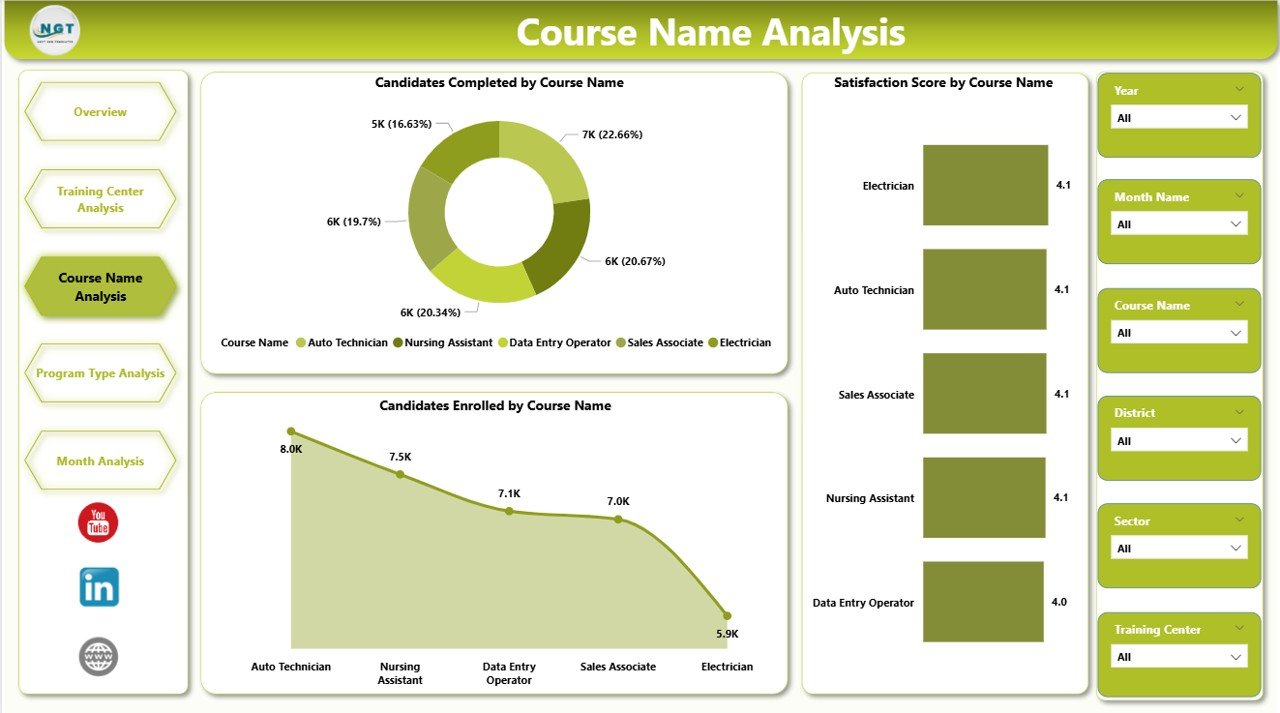
Not every course produces the same outcomes. Therefore, course-level analysis helps institutions optimize training strategies.
The Course Name Analysis Dashboard highlights course performance using clear visualizations.
Charts Available
-
Candidates Completed by Course Name
-
Satisfaction Score by Course Name
-
Candidates Enrollment by Course Name
Because of this analysis, organizations can:
-
Promote high-demand courses
-
Improve low-performing programs
-
Adjust curriculum strategies
-
Align courses with job market demand
As a result, training programs become more impactful.
4. Program Type Analysis – Evaluating Program Effectiveness
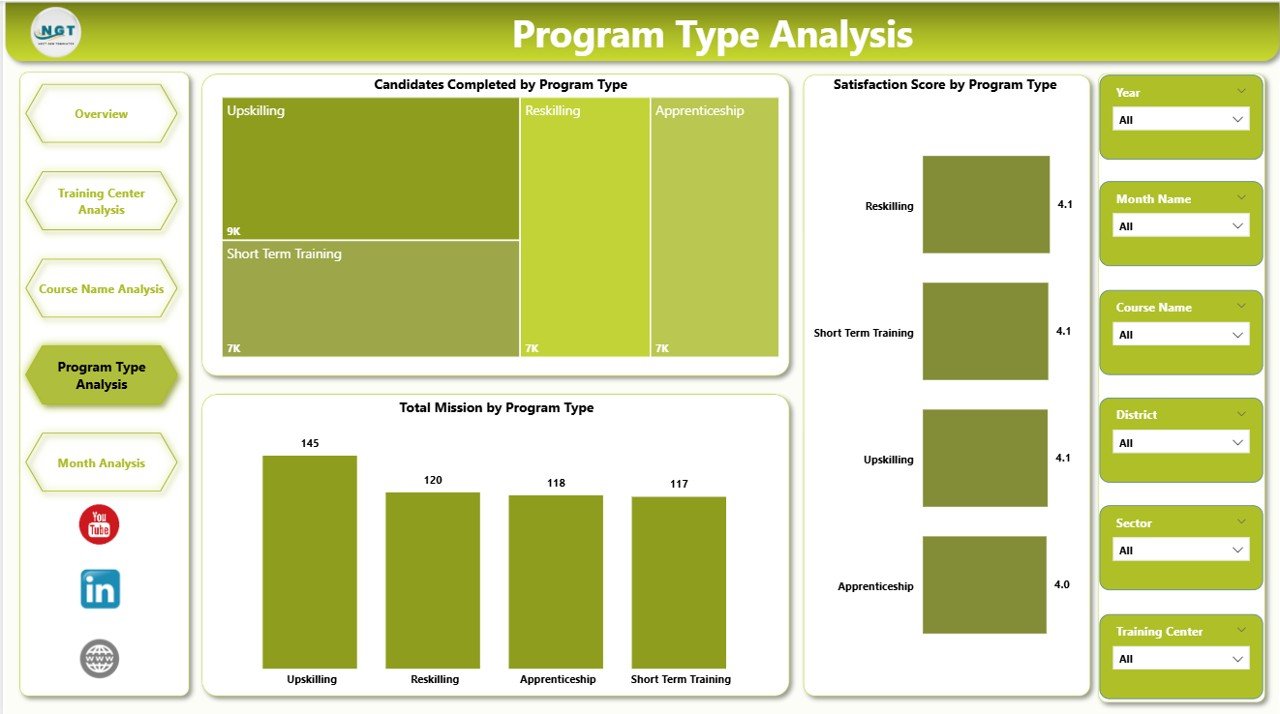
Skill missions often include multiple program categories such as short-term training, certification programs, or specialized courses.
The Program Type Analysis Page evaluates each program category separately.
Charts Included
-
Candidates Completed by Program Type
-
Satisfaction Score by Program Type
-
Total Mission by Program Type
This page helps stakeholders understand:
-
Which programs achieve higher completion rates
-
Participant satisfaction differences
-
Program scalability opportunities
Therefore, leaders can prioritize successful program models.
Click to Purchases Skill Development Missions Dashboard in Power BI
5. Month Analysis – Tracking Progress Over Time
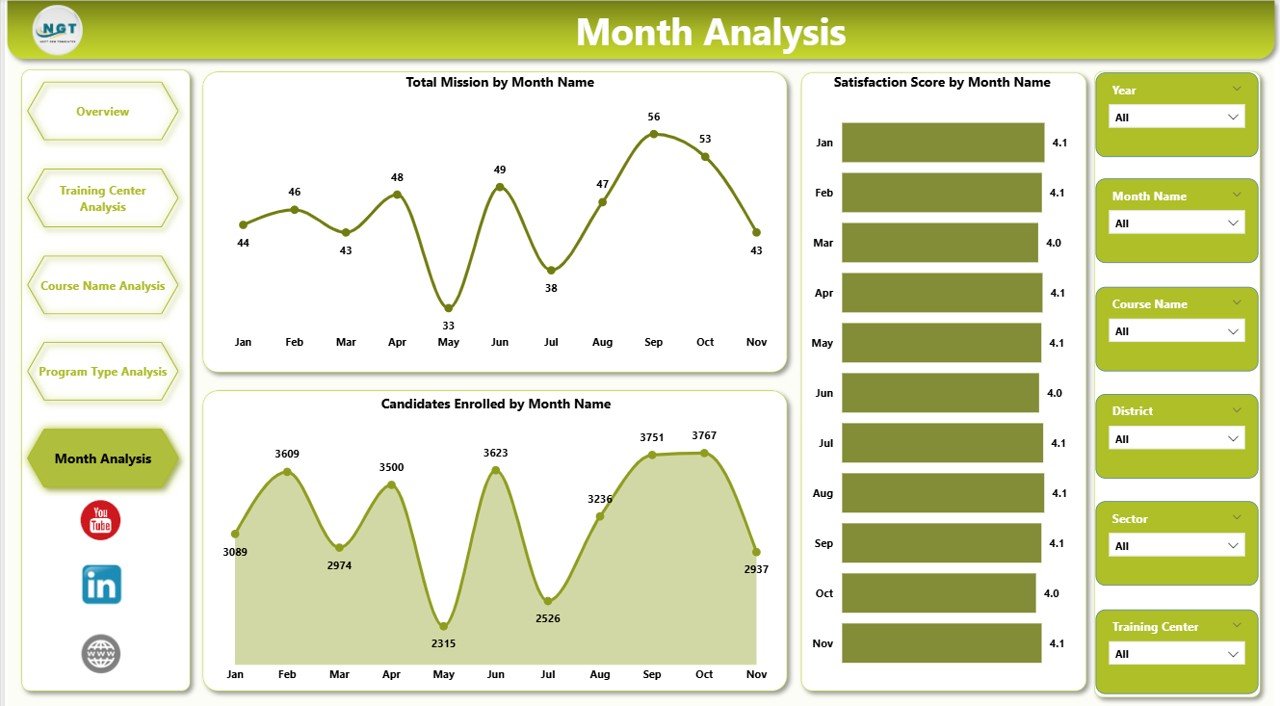
Monitoring monthly progress helps organizations evaluate growth patterns and seasonal trends.
The Month Analysis Page provides time-based insights.
Charts Available
-
Candidates Enrolled by Month
-
Satisfaction Score by Month
-
Total Mission by Month
Using this analysis, managers can:
-
Track enrollment growth
-
Identify seasonal training demand
-
Measure improvement trends
-
Forecast future program performance
Consequently, planning becomes more accurate and proactive.
How Does Power BI Improve Skill Development Mission Management?
Power BI enhances operational efficiency through automation and visualization.
Key Improvements
-
Real-time data monitoring
-
Interactive filtering
-
Automated reporting
-
Faster decision-making
-
Centralized performance tracking
Moreover, Power BI integrates multiple data sources easily. Therefore, organizations maintain a single source of truth.
Advantages of Skill Development Missions Dashboard in Power BI
Implementing this dashboard delivers significant operational and strategic benefits.
✅ Better Decision-Making
Leaders analyze performance instantly and act quickly.
✅ Improved Transparency
Stakeholders clearly see mission progress and outcomes.
✅ Data-Driven Planning
Organizations allocate resources based on insights instead of assumptions.
✅ Enhanced Training Quality
Performance tracking helps improve training effectiveness.
✅ Time Savings
Automated reports eliminate manual analysis.
✅ Performance Accountability
Training centers and programs become measurable.
Who Can Benefit from This Dashboard?
Click to Purchases Skill Development Missions Dashboard in Power BI
Many organizations can use this dashboard effectively.
Government Agencies
They monitor nationwide skill initiatives efficiently.
Training Institutions
They evaluate center and course performance.
NGOs & Development Organizations
They track social impact programs.
Program Managers
They analyze KPIs and improve execution.
Policy Makers
They make strategic decisions using real data.
How to Implement a Skill Development Missions Dashboard in Power BI?
Implementing the dashboard becomes simple when organizations follow a structured approach.
Step 1: Define KPIs
Identify measurable indicators such as enrollment, completion rate, and satisfaction score.
Step 2: Collect Data
Gather data from training centers, MIS systems, and enrollment platforms.
Step 3: Clean the Data
Remove duplicates and standardize formats.
Step 4: Build Data Model
Create relationships between tables in Power BI.
Step 5: Design Visualizations
Add charts, KPI cards, and slicers.
Step 6: Test Dashboard
Validate calculations and filters.
Step 7: Deploy and Share
Publish dashboards to stakeholders.
Best Practices for the Skill Development Missions Dashboard in Power BI
To maximize dashboard effectiveness, organizations should follow proven practices.
✔ Keep Visuals Simple
Avoid overcrowded dashboards.
✔ Use Meaningful KPIs
Track metrics aligned with mission goals.
✔ Enable Interactive Filters
Allow users to explore data easily.
✔ Maintain Data Accuracy
Update datasets regularly.
✔ Use Consistent Color Themes
Improve readability and user experience.
✔ Focus on Actionable Insights
Show information that supports decisions.
✔ Monitor Performance Regularly
Review dashboard insights frequently.
Common Challenges and How to Overcome Them
Click to Purchases Skill Development Missions Dashboard in Power BI
Even powerful dashboards require proper management.
Challenge: Poor Data Quality
Solution: Implement validation rules.
Challenge: Low User Adoption
Solution: Provide training sessions.
Challenge: Overloaded Visuals
Solution: Focus on essential KPIs.
Challenge: Data Update Delays
Solution: Automate refresh schedules.
Future of Skill Development Analytics with Power BI
Skill development programs continue evolving rapidly. Therefore, analytics tools also advance.
Future dashboards may include:
-
AI-driven performance predictions
-
Automated training recommendations
-
Employment outcome tracking
-
Real-time mobile dashboards
-
Integration with learning platforms
As technology grows, organizations will rely more on intelligent dashboards.
Conclusion
Skill development missions require strong monitoring systems to achieve meaningful results. Without proper analytics, organizations struggle to understand performance and optimize programs.
The Skill Development Missions Dashboard in Power BI transforms complex program data into clear, actionable insights. It provides comprehensive analysis across training centers, courses, program types, and monthly trends.
Because of its interactive visuals and automated reporting, decision-makers gain clarity, improve efficiency, and enhance training outcomes.
Therefore, organizations that adopt Power BI dashboards strengthen program management and drive measurable impact in workforce development.
Frequently Asked Questions (FAQs)
What is a Skill Development Missions Dashboard in Power BI?
It is an interactive reporting tool that tracks training programs, candidate performance, and mission progress using visual analytics.
Who should use this dashboard?
Government agencies, training institutions, NGOs, and program managers can use it to monitor skill initiatives.
Can beginners use this dashboard?
Yes. Power BI dashboards provide user-friendly navigation and interactive filters.
Does the dashboard support real-time updates?
Yes, organizations can schedule automatic data refresh for updated insights.
What KPIs are commonly tracked?
Common KPIs include candidate enrollment, completion rate, satisfaction score, and mission performance.
Why is Power BI suitable for skill development analytics?
Power BI offers strong visualization, automation, and data integration capabilities, making analysis faster and more effective.
Can this dashboard improve training outcomes?
Yes. By identifying performance gaps, organizations improve programs and enhance candidate success rates.
Visit our YouTube channel to learn step-by-step video tutorials