Small Business CFO Dashboard in Excel is a powerful, interactive financial analytics template designed for small business owners, CFOs, finance managers, and startup founders who want to monitor their entire financial health from one central dashboard. This template tracks 5 critical KPIs — Total Revenue, Total Cost, Net Profit, Total Transactions, and Total Receivables — and provides 18 dynamic charts spread across 5 dedicated dashboard pages. Whether you need to analyze cash flow, compare budget vs actual costs, evaluate department-level spending, or assess profitability, this dashboard delivers actionable insights that help you make smarter financial decisions every day.
If you are looking for the best CFO dashboard template for small businesses, this Excel-based solution is built to save you hours of manual reporting. It is ideal for anyone managing a startup, a growing SMB, or a freelance consulting practice. You can also explore the Business Valuation Dashboard in Excel and Outsourced Accounting KPI Dashboard in Excel for complementary financial analytics.
Key Features of Small Business CFO Dashboard in Excel
This template is packed with features that make financial reporting effortless for small businesses:
- 5 Interactive Dashboard Pages — Overview, Cash Flow, Budget Analysis, Department Spend, and Profitability provide a 360-degree view of your business finances
- 5 High-Level KPI Cards — Total Revenue, Total Cost, Net Profit, Total Transactions, and Total Receivables displayed prominently on the Overview page
- 18 Dynamic Charts — Revenue trends, cost breakdowns, budget utilization percentages, cash flow movements, and profitability analysis across all 5 pages
- Interactive Slicers and Filters — Quickly filter the dashboard by department, category, payment method, payment status, and more
- Plug-and-Play Data Sheet — Replace sample data with your own business data and the dashboard updates dynamically
- Pivot-Powered Support Sheet — All charts are driven by pivot tables that refresh with a single click using Data → Refresh All in the Excel Ribbon
- No Macros Required — The dashboard works purely with pivot tables, charts, and slicers — no VBA or coding needed
Dashboard Pages Explained
1. Overview Page
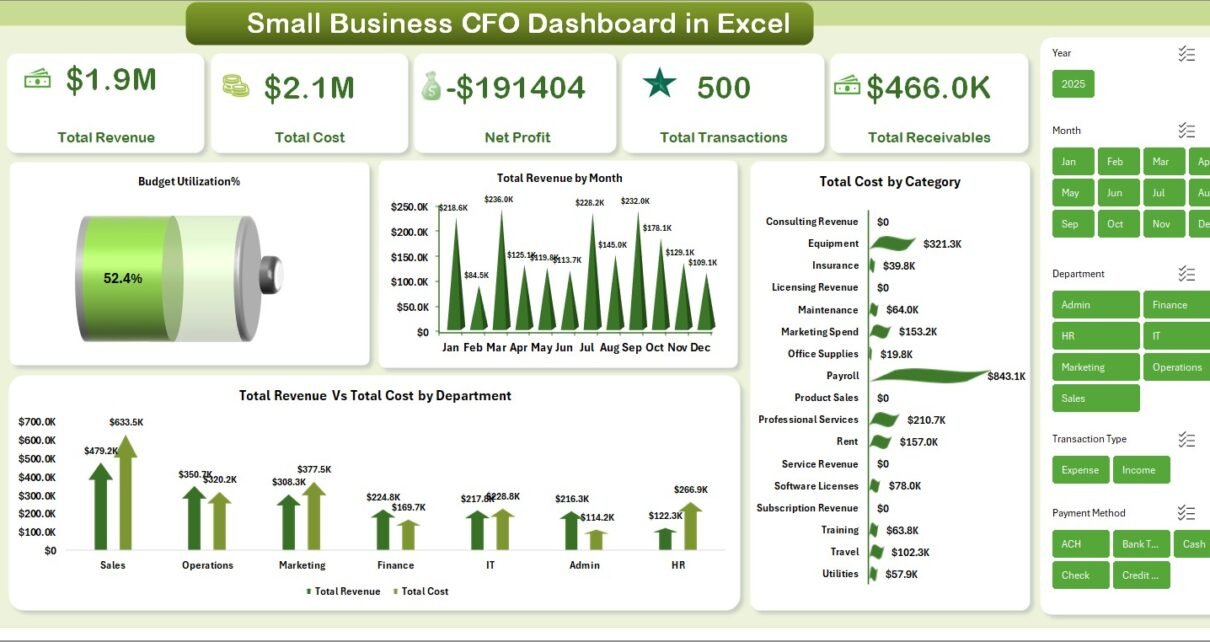
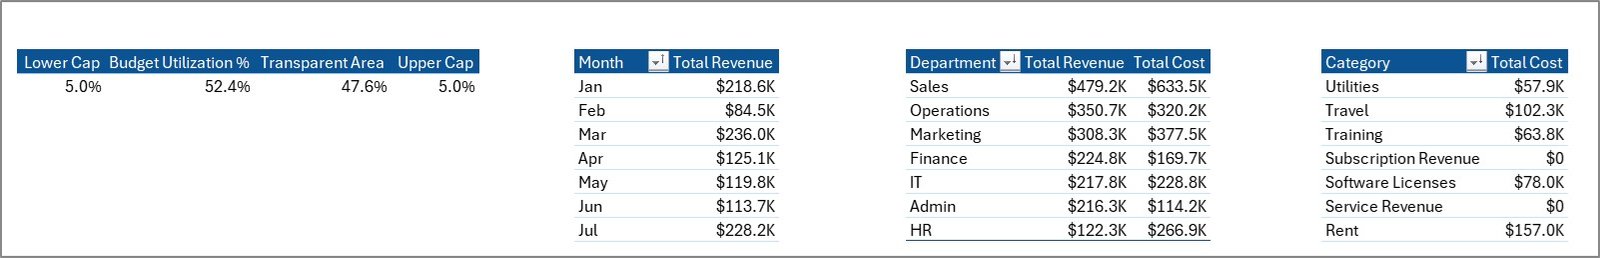
The Overview page is the main landing view of the Small Business CFO Dashboard in Excel. At the top, you will find 5 KPI cards showing Total Revenue, Total Cost, Net Profit, Total Transactions, and Total Receivables. Below the cards, 4 interactive charts provide quick financial analysis: Budget Utilization by Percentage shows how much of your allocated budget has been used, Total Revenue by Month reveals seasonal trends and growth patterns, Total Cost by Category breaks down where your money is being spent, and Total Revenue Vs Total Cost by Department lets you compare financial performance across your organizational structure. Multiple slicers are available to filter the entire page and see filtered results instantly.
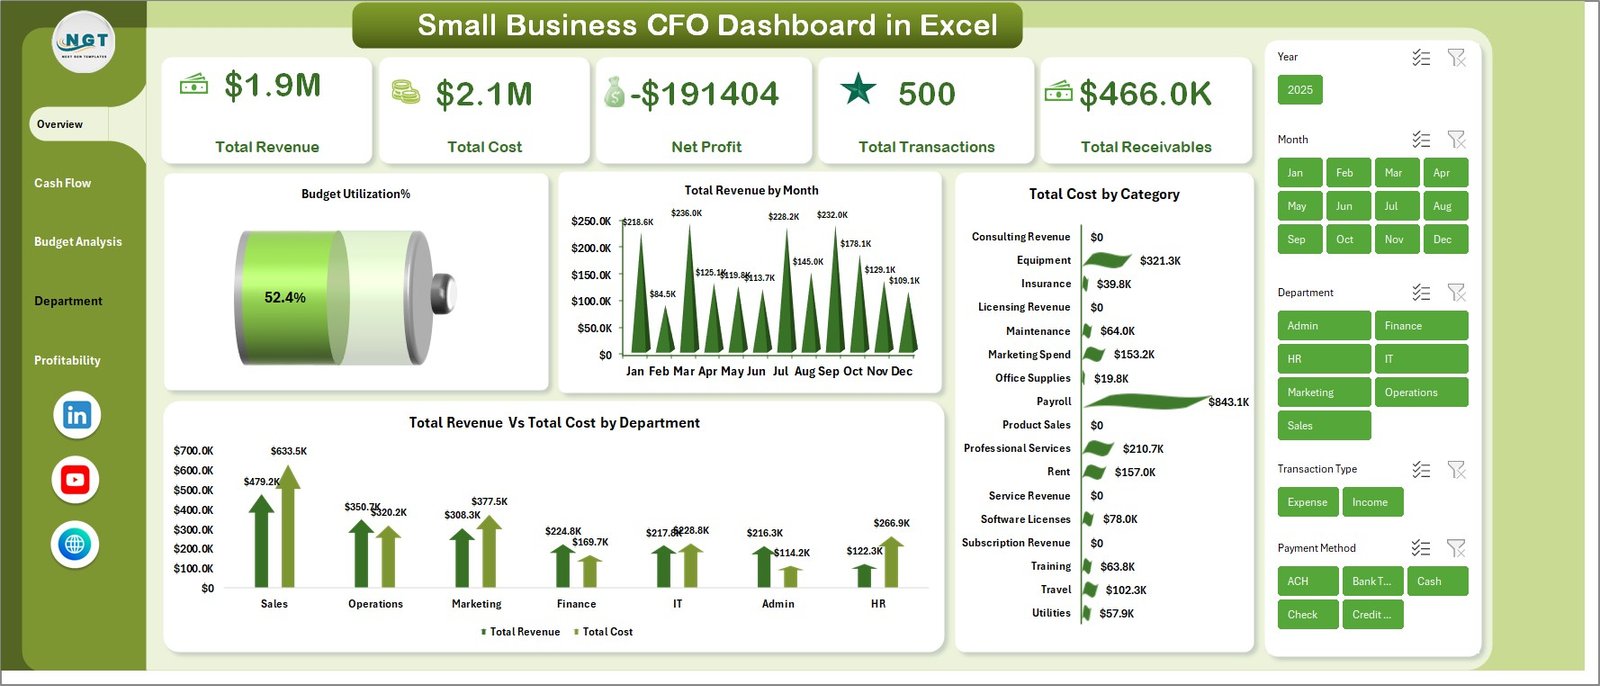
Small Business CFO Dashboard in Excel – Overview Page
2. Cash Flow Page
The Cash Flow page provides a detailed analysis of money flowing in and out of your business. It features 4 powerful charts: Total Revenue by Payment Status helps you track paid vs pending vs overdue amounts, Total Revenue Vs Total Cost by Payment Method compares income and expenses across different payment channels, Total Receivables Vs Total Payables by Department shows outstanding amounts at the department level, and Total Receivables by Month highlights collection trends over time. This page is essential for any CFO managing working capital and ensuring the business stays cash-positive.
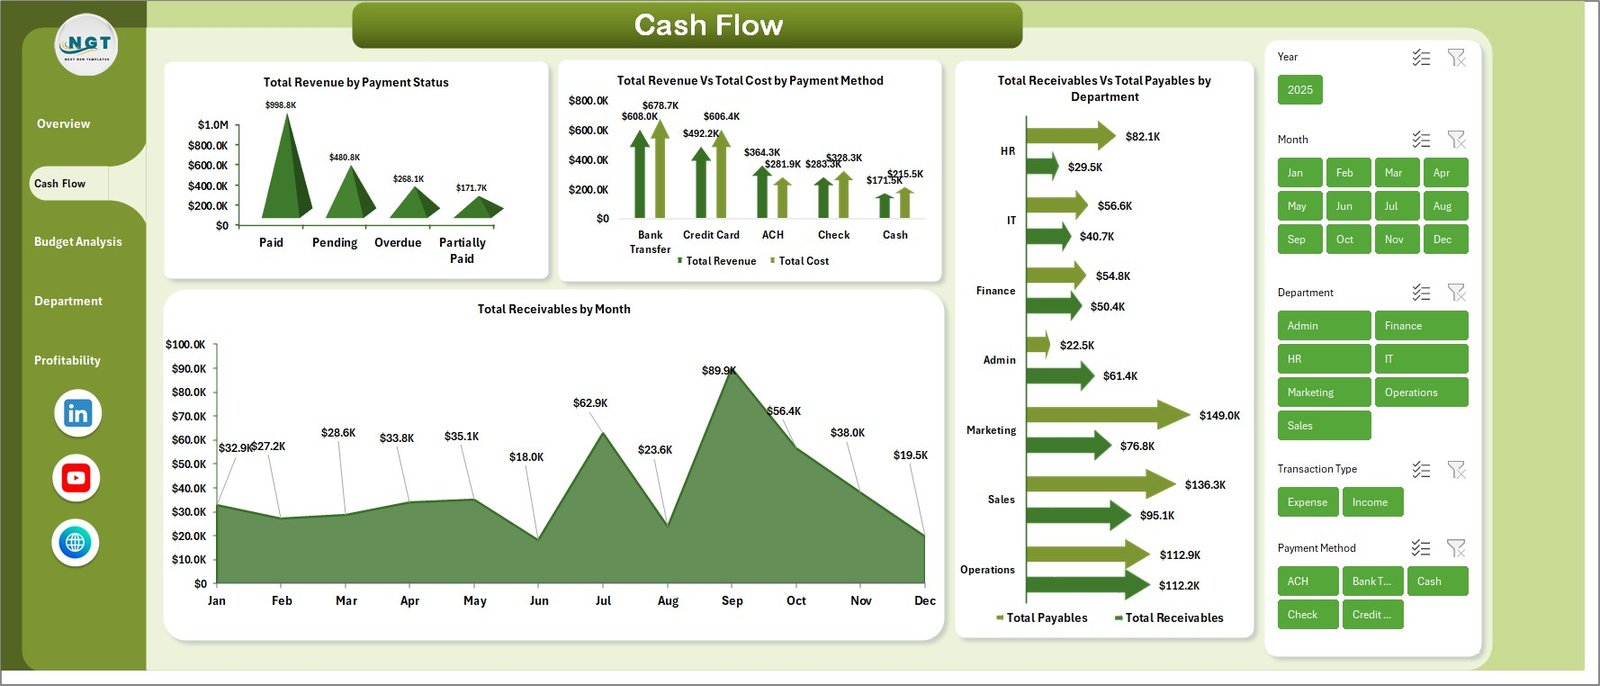
Cash Flow Analysis Page
3. Budget Analysis Page
The Budget Analysis page helps you understand how well your business is sticking to its financial plan. Three insightful charts power this page: Total Budget by Department shows budget allocation across your organization, Total Budget by Payment Status reveals how much of your budget is committed vs available, and Total Budget Vs Total Cost by Month compares planned vs actual spending month over month. This analysis is critical for identifying overspending patterns and optimizing budget allocation for future periods.
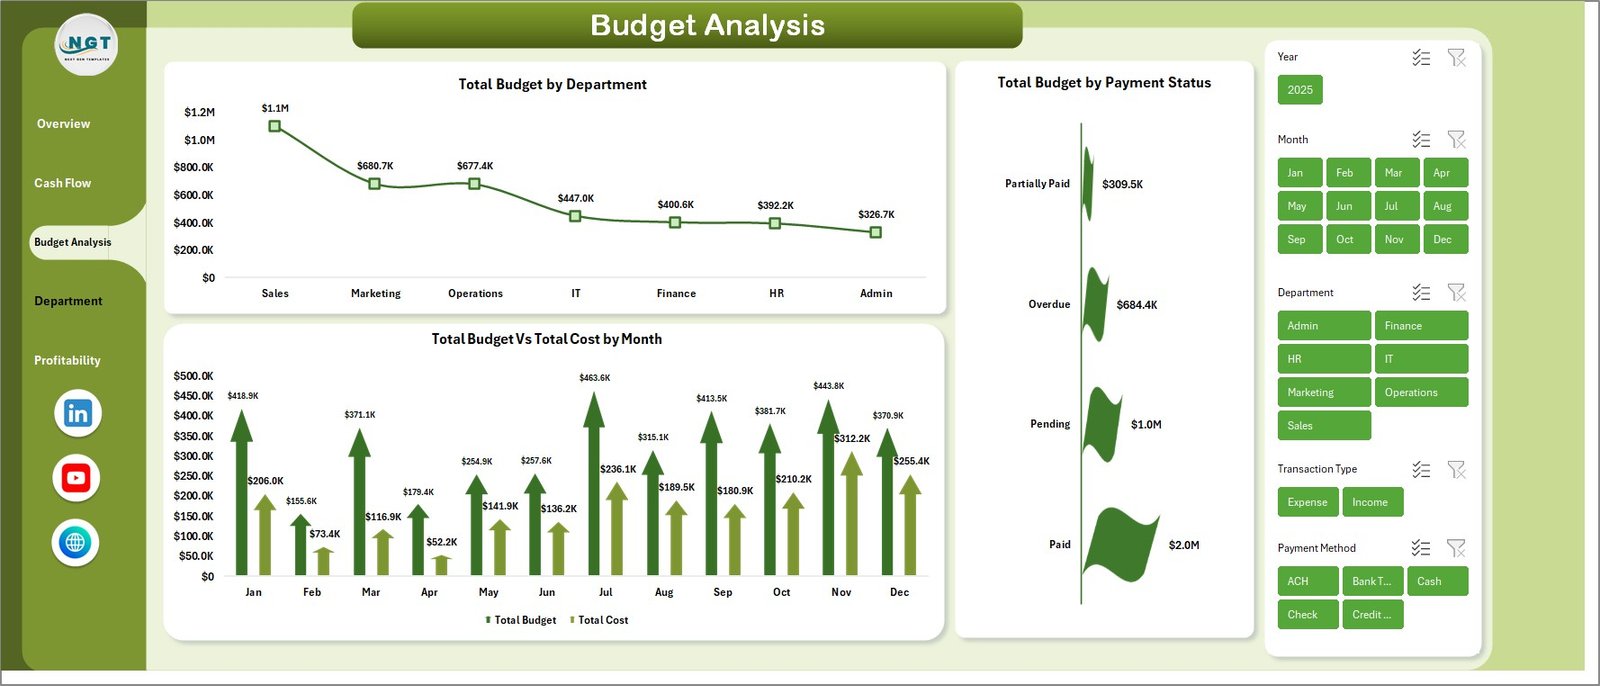
Budget Analysis Page
4. Department Spend Page
The Department Spend page breaks down your financial data at the departmental level with 4 targeted charts: Total Cost by Department identifies the biggest spenders in your organization, Total Transactions by Department shows activity volume per department, Tax Amount by Transaction Type reveals the tax burden across different transaction categories, and Total Revenue by Category highlights which product or service categories are driving the most income. This level of granularity is invaluable for CFOs who need to hold departments accountable for their budgets.
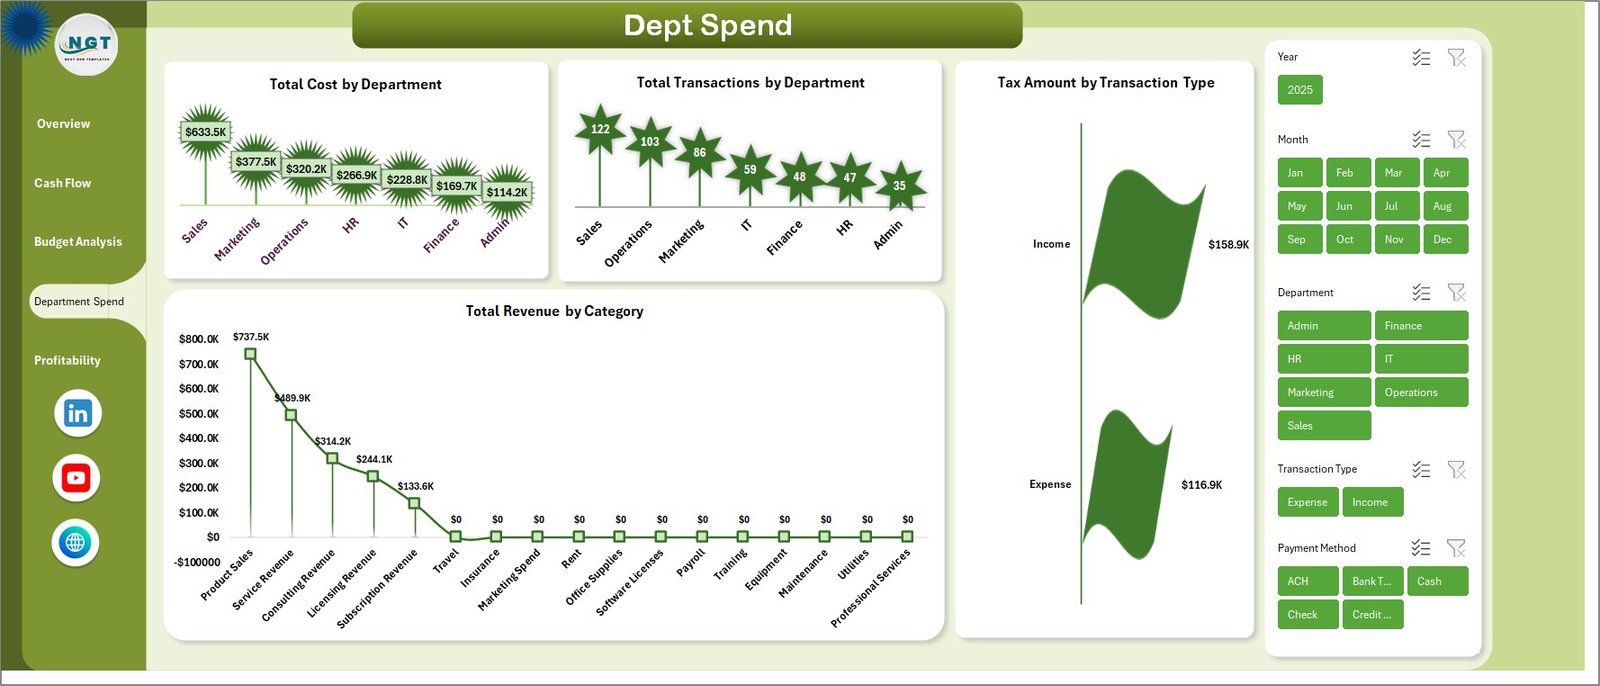
Department Spend Analysis Page
5. Profitability Page
The Profitability page is where you assess your bottom line performance. Three key charts drive this analysis: Over Budget by Category flags spending categories where actual costs exceed budget limits, Net Profit by Department shows which departments are contributing the most to your profit margin, and Total Revenue by Year gives you a long-term perspective on business growth. This page helps CFOs and business owners quickly identify profit drivers and cost centers that need attention.

Profitability Analysis Page
6. Data Sheet
The Data Sheet is where you enter all your business financial data. It is structured in a clean, tabular format with columns for dates, departments, categories, transaction types, payment methods, amounts, costs, budgets, receivables, payables, and more. Simply replace the sample data with your own records in the same format, and every chart and KPI card across all 5 dashboard pages will update dynamically.
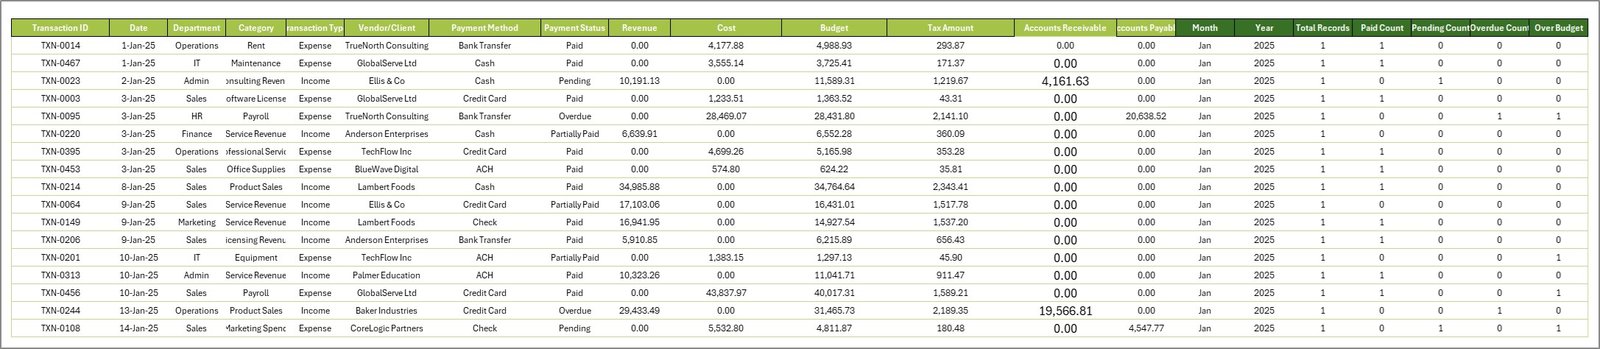
Data Sheet Tab
7. Support Sheet
The Support Sheet contains all the pivot tables that power the entire dashboard. After updating your data in the Data Sheet, navigate to the Data tab in the Excel Ribbon and click Refresh All. Every pivot table will recalculate, and all 18 charts across 5 dashboard pages will refresh automatically. You can keep this sheet hidden to maintain a clean look for your dashboard.
Support Sheet Tab
Advantages of the Small Business CFO Dashboard in Excel
- All-in-One Financial View — Eliminates the need for multiple reports by consolidating revenue, cost, cash flow, budget, and profitability analysis in one file
- Zero Learning Curve — No macros, formulas, or advanced Excel skills needed — just enter data and refresh
- Fully Dynamic — Pivot tables ensure every chart updates automatically when data changes
- Professional Presentation-Ready — Clean design with KPI cards and interactive charts that look great in board meetings and investor presentations
- Cost-Effective — Get CFO-level financial reporting without investing in expensive BI software or hiring data analysts
- Customizable — Add your own departments, categories, and transaction types to match your unique business structure
Opportunities for Improvement
- Adding a dedicated Forecasting page with trend lines and projected revenue could enhance strategic planning capabilities
- Including a Variance Analysis section comparing current period vs previous period would add time-series benchmarking
- A Accounts Receivable Aging summary could further strengthen the cash flow tracking functionality
- Conditional formatting on KPI cards to show red/green indicators based on target thresholds would improve at-a-glance monitoring
Best Practices for Using the Small Business CFO Dashboard
- Update data weekly or monthly — Regular updates ensure your dashboard reflects the latest financial position
- Always click Refresh All after adding data — This updates all pivot tables and charts simultaneously
- Use consistent naming for departments and categories — Consistent labels prevent duplicate slicers and ensure accurate aggregation
- Keep the Support Sheet hidden — This maintains a clean, professional appearance when sharing with stakeholders
- Take a screenshot before board meetings — Use the Overview page as a quick financial summary slide
- Pair with the Finance & Accounting Command Center Bundle — Get additional templates for advanced financial analysis across Excel, Power BI, and Google Sheets
Explore Relevant Templates
If you found the Small Business CFO Dashboard in Excel useful, check out these related financial analytics templates from NextGenTemplates.com:
- Freelancer Business Dashboard in Excel — Track freelance income, expenses, and client revenue
- Subscription Business Dashboard in Excel — Monitor subscription revenue, churn, and recurring metrics
- Finance & Accounting Command Center Bundle — 8 premium finance templates at 46% savings
- Business Valuation Dashboard in Excel — Comprehensive business valuation analytics
- Outsourced Accounting KPI Dashboard in Excel — KPI tracking for accounting service providers
Frequently Asked Questions
What is the best Excel dashboard template for small business CFOs?
The Small Business CFO Dashboard in Excel is one of the best options for small business CFOs. It includes 5 interactive dashboard pages covering overview KPIs, cash flow analysis, budget tracking, department spend, and profitability — all powered by pivot tables that update automatically when you refresh your data.
How many KPIs does the Small Business CFO Dashboard track?
The dashboard tracks 5 key performance indicators on the Overview page: Total Revenue, Total Cost, Net Profit, Total Transactions, and Total Receivables. Additionally, 18 charts across 5 pages provide in-depth analysis of cash flow, budget utilization, department spending, and profitability metrics.
Do I need any special software to use this CFO dashboard?
No. The Small Business CFO Dashboard works in Microsoft Excel. No additional software, plugins, macros, or VBA knowledge is required. Simply open the file, replace the sample data, and click Refresh All to update everything.
Can I customize this dashboard for my specific business?
Yes. The Data Sheet accepts any department names, cost categories, payment methods, and transaction types. When you enter your unique business data and refresh the pivots, all charts and slicers adapt automatically to reflect your specific organizational structure.
How do I track cash flow using this Excel dashboard?
The dedicated Cash Flow page includes 4 charts: Total Revenue by Payment Status, Total Revenue Vs Total Cost by Payment Method, Total Receivables Vs Total Payables by Department, and Total Receivables by Month. Together, these provide complete visibility into money flowing in and out of your business.
Where can I buy the Small Business CFO Dashboard in Excel?
You can purchase this template from NextGenTemplates.com. Click here to Purchase the Small Business CFO Dashboard in Excel.
Conclusion
The Small Business CFO Dashboard in Excel is a must-have financial analytics tool for any small business owner, CFO, or finance manager who wants to move beyond manual spreadsheets and into professional, data-driven financial reporting. With 5 interactive dashboard pages, 18 dynamic charts, 5 KPI cards, and a fully automated pivot table engine, this template delivers enterprise-level insights at a fraction of the cost of traditional BI solutions. Download it today and take control of your business finances.
Click here to Purchase the Small Business CFO Dashboard in Excel
For step-by-step video tutorials, visit our YouTube channel: Youtube.com/@PK-AnExcelExpert