Running a small business requires clarity, speed, and control. However, many small business owners still depend on scattered Excel files, manual reports, and delayed summaries. As a result, they struggle to track performance and make confident decisions. That is exactly where a Small Business KPI Scorecard in Excel becomes a powerful and practical solution.
A Small Business KPI Scorecard in Excel helps business owners track key performance indicators (KPIs) in one centralized place. Instead of guessing results, you clearly see what works and what needs improvement. Moreover, Excel remains affordable, flexible, and easy to use. Therefore, small businesses across industries rely on Excel-based KPI scorecards to manage performance effectively.
In this detailed guide, you will learn everything about the Small Business KPI Scorecard in Excel, including how it works, its worksheet structure, advantages, best practices, and frequently asked questions. Additionally, the language remains simple and actionable so you can implement it immediately.
Click to buy Small Business KPI Scorecard in Excel
What Is a Small Business KPI Scorecard in Excel?
A Small Business KPI Scorecard in Excel is a ready-to-use performance tracking template designed to monitor critical business metrics in one structured dashboard. It converts raw data into meaningful insights using tables, comparisons, and visual indicators.
Instead of checking multiple reports, business owners can quickly review MTD (Month-to-Date) and YTD (Year-to-Date) performance. Moreover, the scorecard compares Actual vs Target values and highlights performance status visually.
Most importantly, this scorecard helps small businesses focus on the KPIs that truly matter. As a result, owners can take corrective actions faster and improve results consistently.
Why Do Small Businesses Need a KPI Scorecard?
Small businesses operate with limited time, budget, and resources. Therefore, they cannot afford poor decisions. However, without structured performance tracking, problems remain hidden.
A KPI scorecard solves this challenge by offering clarity and focus. It answers critical questions such as:
- Are sales targets on track?
- Is profitability improving?
- Are costs under control?
- Are operations efficient?
Because Excel already exists in most businesses, a KPI scorecard becomes a cost-effective and powerful management tool.
How Does a Small Business KPI Scorecard in Excel Work?
A Small Business KPI Scorecard in Excel works by collecting data, calculating performance metrics, and displaying results visually.
First, you enter actual values and targets in the Input Data Sheet. Then, Excel formulas calculate MTD, YTD, and previous year values automatically. After that, the Scorecard Sheet displays results using tables and visual indicators. Finally, the KPI Trend Sheet shows performance trends over time.
As a result, decision-makers get instant insights without complex tools.
What Are the Key Features of a Small Business KPI Scorecard in Excel?
This ready-to-use KPI scorecard includes carefully designed features to support small business needs.
Key Highlights at a Glance
- Tracks up to 10 KPIs in one view
- Supports MTD and YTD analysis
- Compares Actual vs Target and Actual vs Previous Year
- Uses visual indicators and conditional formatting
- Allows easy data updates
- Requires no advanced Excel skills
Because of these features, the scorecard remains practical and user-friendly.
What Are the Worksheets in a Small Business KPI Scorecard in Excel?
This KPI scorecard contains four structured worksheets, each designed for a specific purpose. Let us explore each sheet in detail.
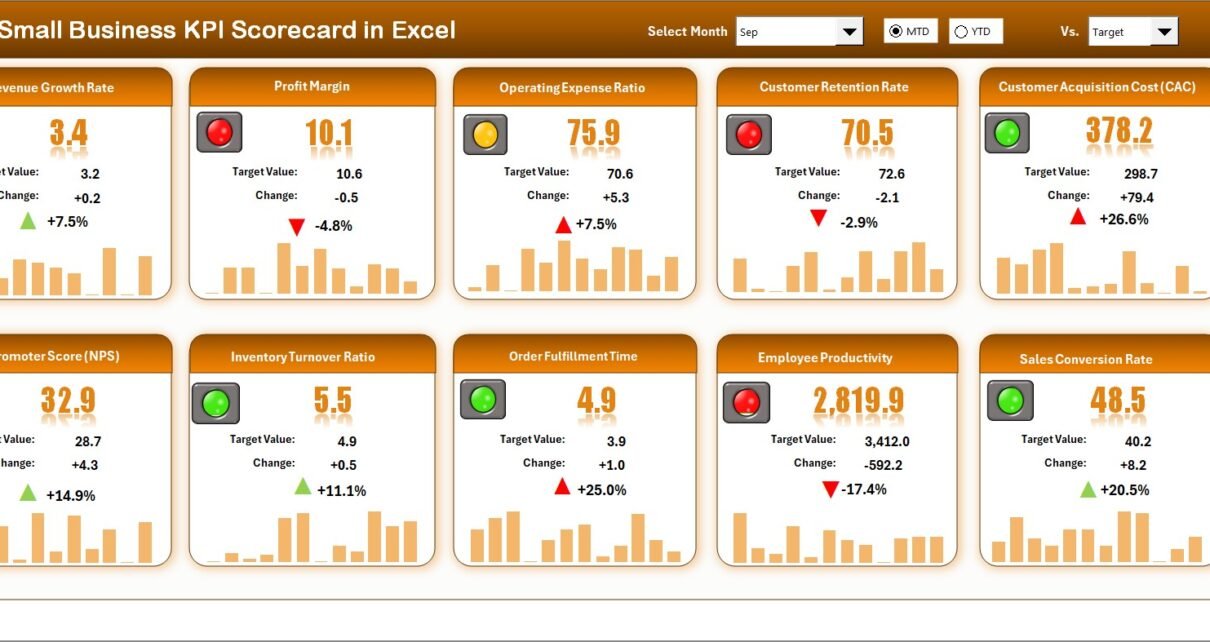
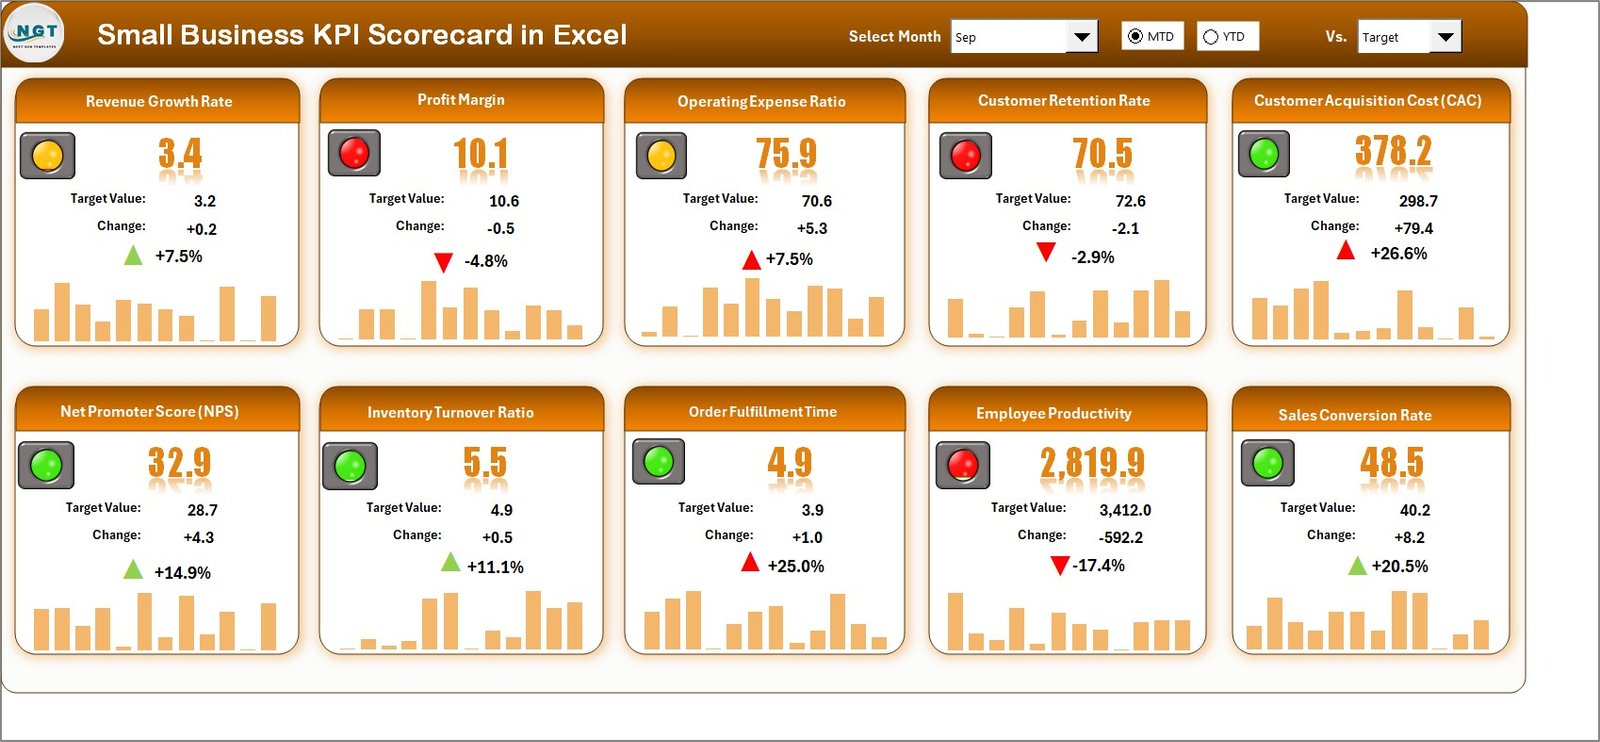
Scorecard Sheet
The Scorecard Sheet acts as the main interface of the KPI scorecard. It presents a consolidated view of all KPIs in one place.
Key Features of the Scorecard Sheet
- Dropdown Menus
You can select the month and choose between MTD or YTD performance. As a result, the entire scorecard updates instantly. - Actual vs Target Comparison
The scorecard displays actual performance alongside target values. Therefore, you quickly see whether KPIs meet expectations. - Visual Indicators
Conditional formatting highlights good and poor performance using colors or icons. Consequently, you identify issues at a glance. - Comprehensive KPI Overview
Each KPI shows relevant details, including MTD and YTD results. Thus, you avoid switching between multiple sheets. - Single-View KPI Tracking
The scorecard displays 10 KPIs in one view, which improves focus and clarity.
Because of these features, the Scorecard Sheet becomes the decision-making hub for small business owners.
Click to buy Small Business KPI Scorecard in Excel
KPI Trend Sheet
The KPI Trend Sheet focuses on performance movement over time. Instead of looking at static numbers, you analyze trends visually.
Features of the KPI Trend Sheet
- KPI Selection Dropdown
You can select a KPI name from the dropdown available in cell C3. As a result, all related information updates dynamically. - KPI Details Display
The sheet shows:
KPI Group
Unit of Measurement
KPI Type (Lower the Better or Upper the Better)
KPI Formula
KPI Definition
- MTD and YTD Trend Charts
The trend chart displays Actual, Target, and Previous Year (PY) values. Therefore, you understand performance direction clearly.
Because trend analysis drives better planning, this sheet plays a crucial role in performance improvement.

Click to buy Small Business KPI Scorecard in Excel
Input Data Sheet
The Input Data Sheet acts as the foundation of the KPI scorecard. All calculations depend on the accuracy of this data.
Key Benefits of the Input Data Sheet
- Simple Data Entry
You record actual values, targets, and other metrics for each KPI. - Easy Updates
Whenever new results become available, you simply update the data. Consequently, the scorecard stays current. - Flexible Structure
The sheet supports future expansion and KPI additions without redesign.
Because accurate data drives accurate insights, this sheet remains critical to scorecard success.

Click to buy Small Business KPI Scorecard in Excel
KPI Definition Sheet
The KPI Definition Sheet ensures that everyone understands each KPI clearly.
Information Captured in the KPI Definition Sheet
- KPI Name
- KPI Group
- Unit of Measurement
- KPI Formula
- KPI Definition
Because definitions remain visible and standardized, teams avoid confusion and misinterpretation. As a result, reporting remains consistent and reliable.

Click to buy Small Business KPI Scorecard in Excel
Which KPIs Can Small Businesses Track Using This Scorecard?
A Small Business KPI Scorecard in Excel supports a wide range of KPIs across departments.
Common KPI Categories
- Sales KPIs: Revenue, Sales Growth %, Conversion Rate
- Finance KPIs: Profit Margin %, Cost Ratio, Cash Flow
- Operations KPIs: Order Fulfillment Rate, Cycle Time
- Customer KPIs: Customer Satisfaction, Retention Rate
- Marketing KPIs: Lead Generation, Campaign ROI
Because the scorecard remains flexible, you can customize KPIs based on your business model.
Advantages of Small Business KPI Scorecard in Excel
A KPI scorecard offers several benefits that directly impact business growth.
- Centralized Performance Monitoring
You track all KPIs in one place. Therefore, you save time and avoid confusion.
- Better Decision-Making
Clear visuals and comparisons help you make faster and smarter decisions.
- Cost-Effective Solution
Excel eliminates the need for expensive BI tools. As a result, small businesses reduce costs.
- Easy Customization
You can add, remove, or modify KPIs without technical help.
- Improved Accountability
Defined targets and clear results encourage responsibility across teams.
How Does a KPI Scorecard Help Improve Business Performance?
A KPI scorecard turns data into action. It highlights gaps, trends, and opportunities clearly.
Because performance becomes visible, you can:
- Identify underperforming areas quickly
- Set realistic targets
- Track progress consistently
- Improve operational efficiency
As a result, businesses grow systematically instead of relying on guesswork.
Best Practices for the Small Business KPI Scorecard in Excel
Following best practices ensures long-term success and accuracy.
- Select Relevant KPIs Only
Focus on KPIs that align with business goals. Too many KPIs reduce clarity.
- Set Realistic Targets
Define achievable targets based on historical data and market conditions.
- Update Data Regularly
Frequent updates keep insights accurate and actionable.
- Review Trends, Not Just Numbers
Trend analysis reveals performance direction and future risks.
- Maintain Clear KPI Definitions
Clear definitions prevent confusion and misinterpretation.
How Often Should Small Businesses Review KPI Scorecards?
Small businesses should review KPIs monthly and quarterly. Monthly reviews support quick corrections, while quarterly reviews help with strategic planning.
Because markets change quickly, frequent reviews keep businesses agile.
Can Non-Technical Users Use This KPI Scorecard?
Yes, absolutely. This KPI scorecard uses simple Excel features such as dropdowns, tables, and charts. Therefore, even non-technical users can operate it confidently.
Conclusion: Why Every Small Business Needs a KPI Scorecard in Excel
A Small Business KPI Scorecard in Excel provides clarity, control, and confidence. It transforms raw numbers into meaningful insights and supports smarter decisions.
Because it remains affordable, flexible, and easy to use, this scorecard suits businesses of all sizes. Moreover, its structured worksheets ensure accuracy, consistency, and transparency.
If you want to improve performance, track goals, and grow systematically, a KPI scorecard becomes an essential management tool.
Frequently Asked Questions (FAQs)
What is the purpose of a Small Business KPI Scorecard in Excel?
The scorecard tracks performance, compares results with targets, and supports data-driven decisions.
How many KPIs should a small business track?
Most small businesses should track 8 to 12 KPIs to maintain focus and clarity.
Can I customize KPIs in the scorecard?
Yes, you can easily add or modify KPIs based on your business needs.
Does the scorecard support MTD and YTD analysis?
Yes, the scorecard displays both MTD and YTD performance for better comparison.
Is Excel sufficient for KPI tracking?
Yes, Excel offers flexibility, affordability, and powerful analysis capabilities for small businesses.
Visit our YouTube channel to learn step-by-step video tutorials
Watch the step-by-step video tutorial:
Click to buy Small Business KPI Scorecard in Excel