Smart city procurement involves large public budgets, multiple vendors, strict compliance rules, and high public accountability. However, without a structured performance monitoring system, procurement teams often face cost overruns, delays, vendor risks, and weak transparency.
Therefore, cities now rely on Smart Cities Procurement KPI Dashboards in Power BI to track performance in real time, measure efficiency, and ensure governance.
A Smart Cities Procurement KPI Dashboard in Power BI converts raw procurement data into clear KPIs, visual indicators, and actionable insights. As a result, decision-makers gain complete visibility into procurement performance without relying on manual reports.
Click to buy Smart Cities Procurement KPI Dashboard in Power BI
What Is a Smart Cities Procurement KPI Dashboard in Power BI?
A Smart Cities Procurement KPI Dashboard in Power BI is a ready-to-use analytical reporting solution designed to monitor, analyze, and evaluate key procurement performance indicators for smart city projects.
Instead of managing scattered Excel sheets and static reports, this dashboard centralizes all procurement KPIs into a single interactive Power BI report. Moreover, it enables procurement teams to track targets, actuals, trends, and year-over-year performance in one place.
Because the dashboard uses Excel as the data source, organizations can implement it quickly without complex integrations.
How Does a Smart Cities Procurement KPI Dashboard Work?
The working logic of this dashboard remains simple and practical.
First, users enter procurement data into structured Excel sheets. Then, Power BI connects to this data and applies predefined calculations and visuals. Finally, users interact with slicers, tables, and charts to analyze performance.
Step-by-Step Flow
- Enter actual procurement values in Excel
- Enter target procurement values in Excel
- Define KPIs and formulas
- Refresh Power BI report
- Analyze procurement performance visually
As a result, procurement teams save time and reduce manual errors.
What Are the Key Pages in the Smart Cities Procurement KPI Dashboard?
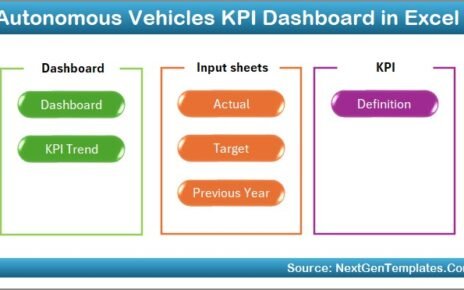
This Power BI dashboard contains three professionally designed pages, each serving a specific analytical purpose.
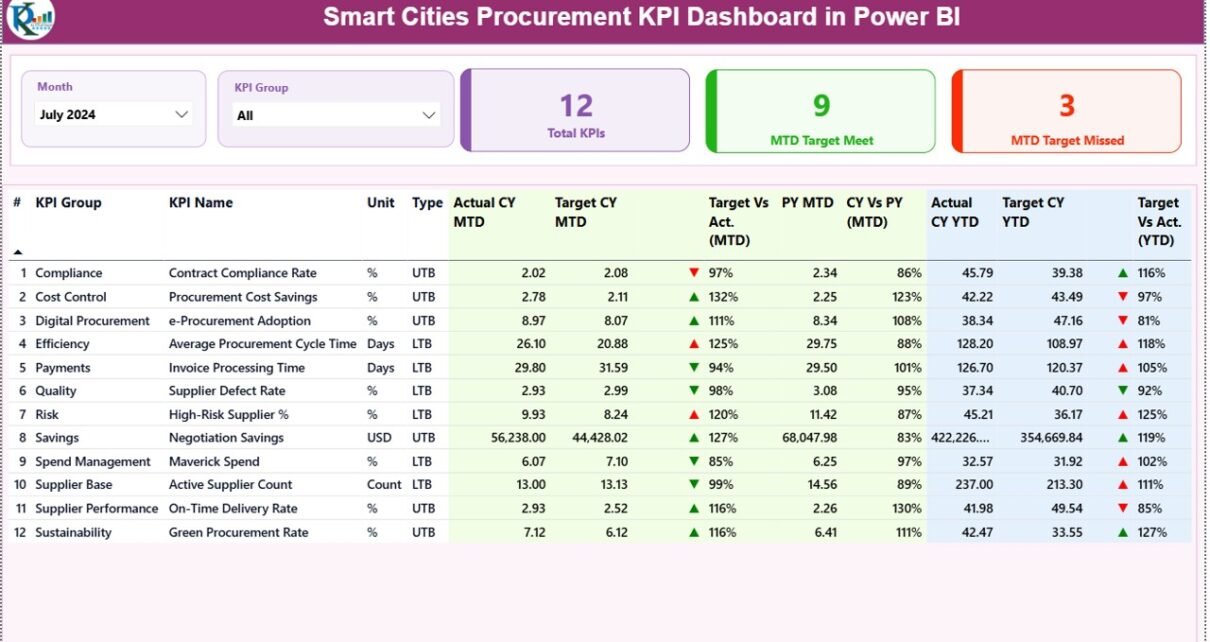
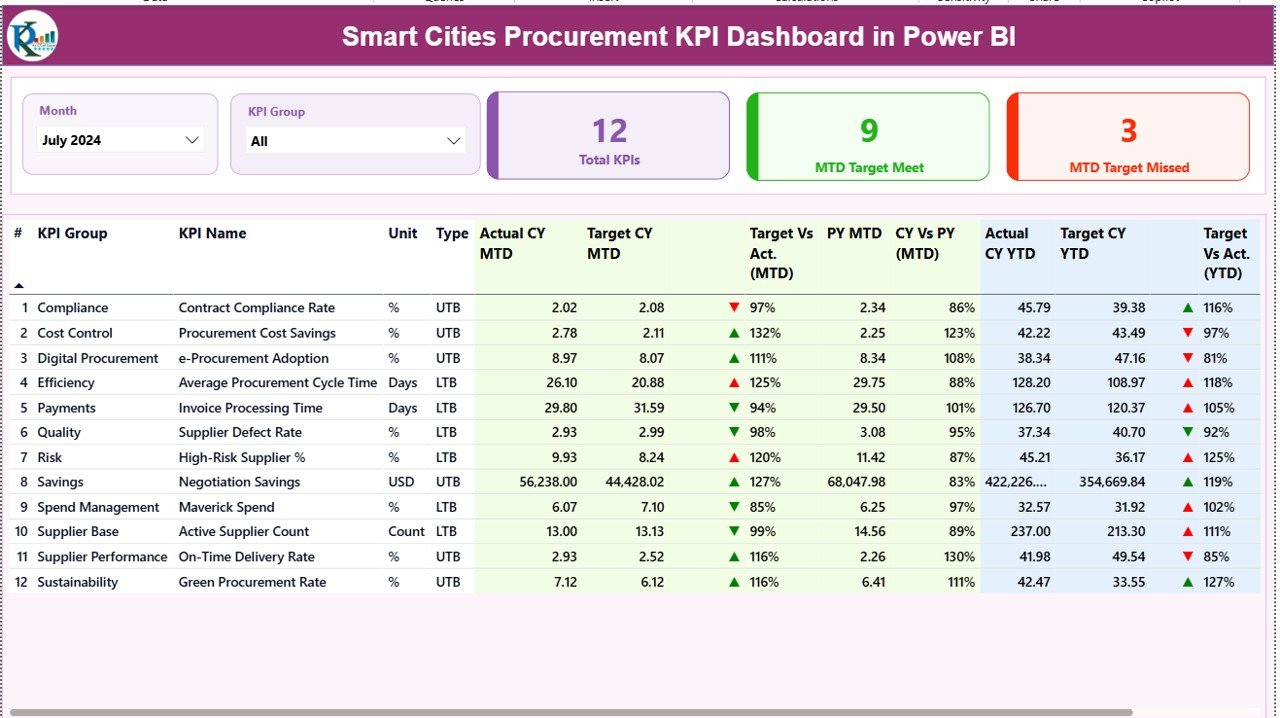
Summary Page – How Do You Monitor Procurement Performance Quickly?
The Summary Page acts as the main control center of the dashboard. It provides a complete overview of procurement KPIs at a glance.
Key Slicers on the Summary Page
- Month Slicer – Filter procurement KPIs by reporting month
- KPI Group Slicer – Analyze KPIs by procurement category
Because these slicers remain dynamic, users can focus on specific time periods or procurement areas instantly.
KPI Cards for Quick Insights
At the top of the page, three KPI cards show:
- Total KPIs Count
- MTD Target Met Count
- MTD Target Missed Count
Therefore, decision-makers instantly understand overall procurement health.
Detailed KPI Table Explained
Below the cards, a detailed table displays all procurement KPIs with advanced metrics.
KPI Structure Columns
- KPI Number – Unique sequence number for each KPI
- KPI Group – Procurement category or KPI classification
- KPI Name – Name of the procurement KPI
- Unit – Measurement unit (%, days, value, count)
- Type –
LTB (Lower the Better)
UTB (Upper the Better)
MTD Performance Metrics
- Actual CY MTD – Current year actual Month-to-Date value
- Target CY MTD – Current year target Month-to-Date value
MTD Icon –
▲ Green arrow = Target met
▼ Red arrow = Target missed
Target vs Actual (MTD) –
Formula:
Actual MTD / Target MTD
- PY MTD – Previous year Month-to-Date value
- CY vs PY (MTD) –
Formula:
CY MTD / PY MTD
These metrics help procurement teams track short-term efficiency.
YTD Performance Metrics
- Actual CY YTD – Current year Year-to-Date actual
- Target CY YTD – Current year Year-to-Date target
- YTD Icon – Visual status indicator
- Target vs Actual (YTD) –
Formula:
Actual YTD / Target YTD - PY YTD – Previous year Year-to-Date value
- CY vs PY (YTD) –
Formula:
CY YTD / PY YTD
Therefore, long-term procurement performance becomes clear.
Click to buy Smart Cities Procurement KPI Dashboard in Power BI
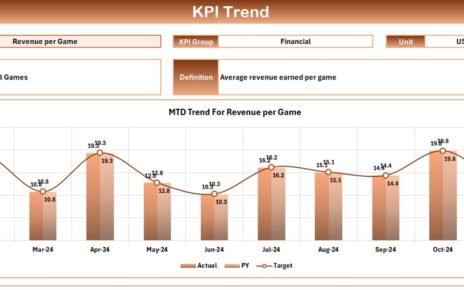
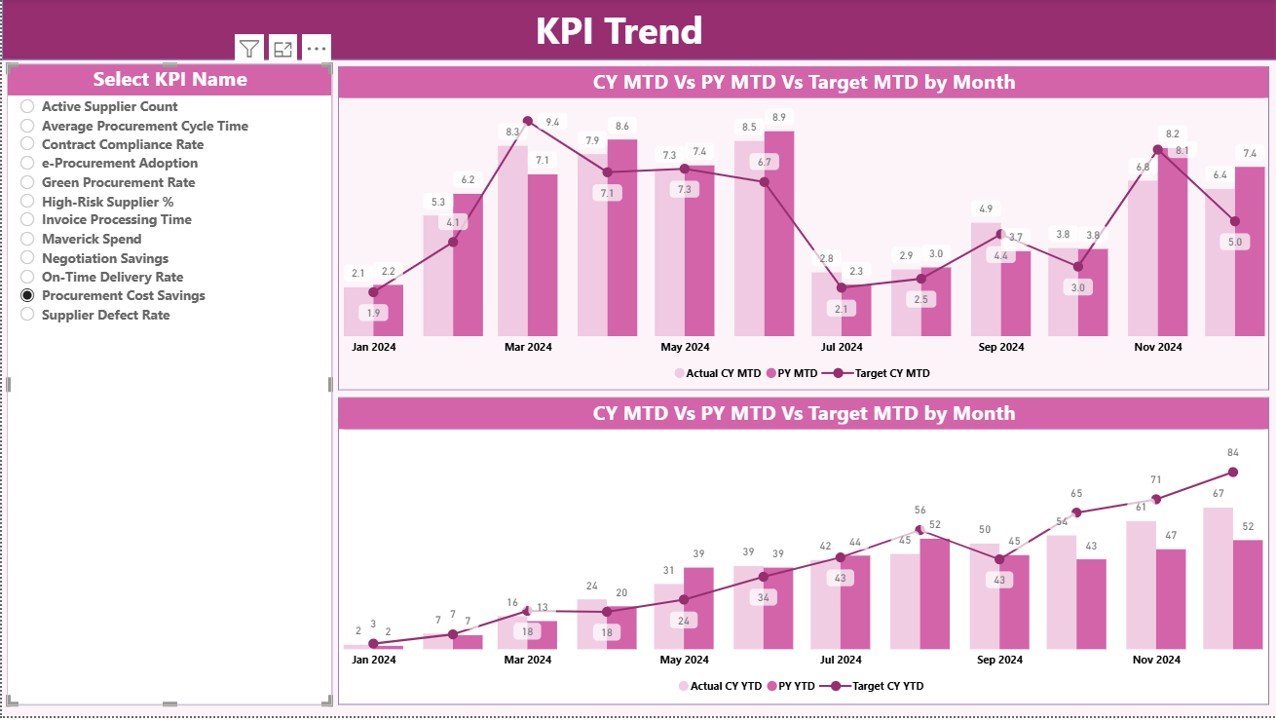
KPI Trend Page – How Do You Analyze Procurement Trends Over Time?
The KPI Trend Page focuses on performance movement across months.
What Does This Page Show?
- Two combo charts
- MTD trend comparison
- YTD trend comparison
Each chart displays:
- Current Year Actual
- Previous Year Actual
- Target Values
Because trends matter in procurement, this page highlights improvements or declines clearly.
KPI Selection Slicer
A slicer on the left allows users to select a specific KPI Name. Once selected, all charts update automatically.
As a result, teams analyze one KPI deeply without distractions.
Click to buy Smart Cities Procurement KPI Dashboard in Power BI
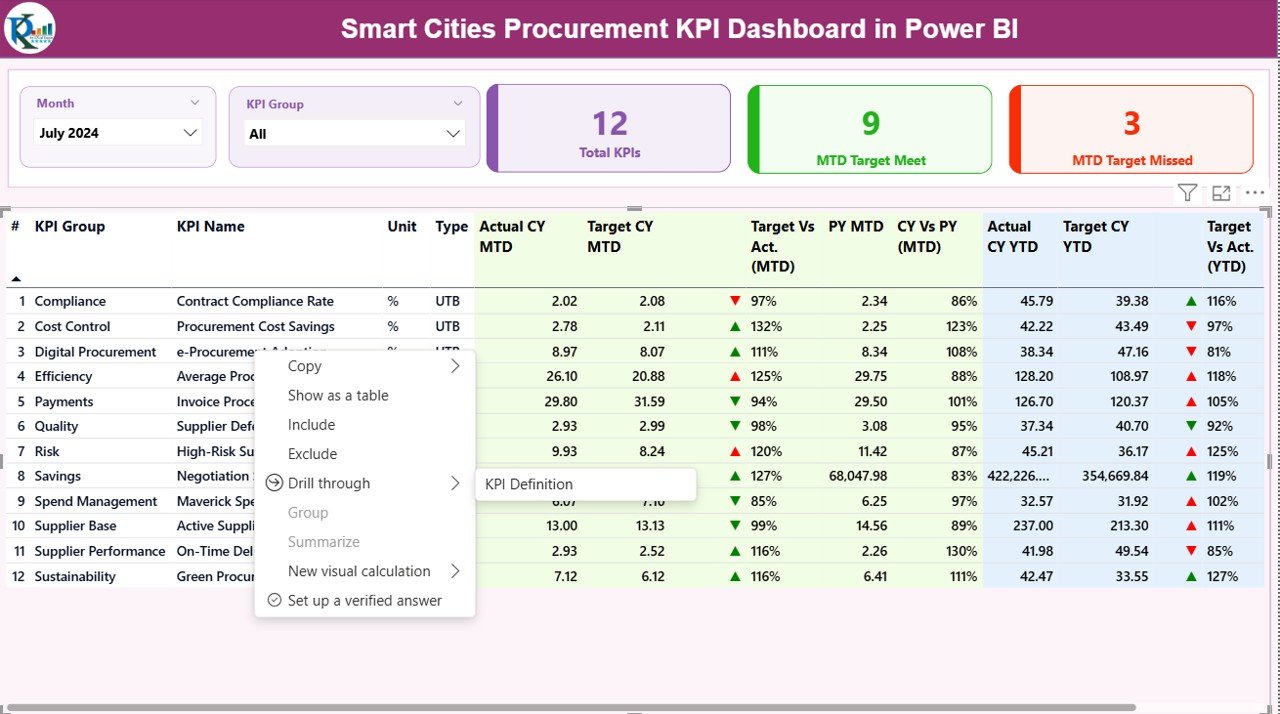
KPI Definition Page – Why Is KPI Transparency Important?
The KPI Definition Page improves governance and clarity.
Key Characteristics
- Hidden drill-through page
- Accessible from Summary Page
- Displays KPI formula and definition
Information Available
- KPI Formula
- KPI Description
- Measurement logic
- KPI Type (LTB or UTB)
Because procurement KPIs often confuse stakeholders, this page ensures transparency.
Click to buy Smart Cities Procurement KPI Dashboard in Power BI
Easy Navigation
Users can return to the Summary Page using the Back button at the top-left corner.
What Excel Data Is Required for This Dashboard?
The dashboard uses a structured Excel file with three worksheets.
Input_Actual Sheet – How Do You Enter Actual Procurement Data?
In this sheet, users enter:
- KPI Name
- Month (use first date of month)
- MTD Actual value
- YTD Actual value
Therefore, monthly updates become simple and consistent.
Input_Target Sheet – How Do You Set Procurement Targets?
In this sheet, users enter:
- KPI Name
- Month (first date of month)
- MTD Target value
- YTD Target value
Because targets remain separate, planning stays clean and flexible.
KPI Definition Sheet – How Do You Define KPIs Properly?
This sheet contains:
- KPI Number
- KPI Group
- KPI Name
- Unit
- Formula
- Definition
- Type (LTB or UTB)
As a result, KPI logic stays documented and standardized.
What Are the Advantages of a Smart Cities Procurement KPI Dashboard in Power BI?
Centralized Procurement Monitoring
Track all procurement KPIs from one dashboard instead of multiple reports.
Improved Transparency
Visual indicators improve accountability and public trust.
Faster Decision-Making
Real-time insights support quick corrective actions.
Excel-Based Data Entry
No complex systems required.
Trend Analysis
Identify procurement risks early.
Standardized KPIs
Ensure consistent performance measurement across departments.
What Challenges Can This Dashboard Solve?
- Manual procurement reporting
- Lack of KPI visibility
- Delayed corrective actions
- Poor vendor accountability
- Inconsistent KPI definitions
Therefore, it becomes a critical tool for smart city governance.
Best Practices for Smart Cities Procurement KPI Dashboard in Power BI
Standardize KPI Definitions
Define KPIs clearly in the KPI Definition sheet.
Update Data Monthly
Ensure MTD and YTD values remain accurate.
Use Correct KPI Types
Set UTB or LTB properly to avoid misinterpretation.
Review Trends Regularly
Analyze trend charts monthly for early warnings.
Train Procurement Teams
Ensure users understand KPIs and visuals.
Who Can Use This Dashboard?
- Smart City Authorities
- Municipal Corporations
- Procurement Departments
- Urban Governance Teams
- Project Monitoring Units
- Public Sector Consultants
How Does This Dashboard Support Smart City Goals?
Smart cities aim for efficiency, transparency, and sustainability. This dashboard supports all three by:
- Reducing procurement delays
- Improving financial discipline
- Strengthening accountability
- Enabling data-driven governance
Conclusion – Is a Smart Cities Procurement KPI Dashboard Worth It?
Absolutely.
A Smart Cities Procurement KPI Dashboard in Power BI transforms procurement monitoring from manual reporting into a data-driven, visual, and transparent system. Because it uses Excel and Power BI, implementation remains simple yet powerful.
As a result, smart cities achieve better control, improved efficiency, and stronger governance.
Frequently Asked Questions (FAQs)
What is a Smart Cities Procurement KPI Dashboard?
It is a Power BI dashboard that tracks procurement KPIs using Excel data.
Does this dashboard require advanced Power BI skills?
No, it uses predefined visuals and Excel input.
Can I customize KPIs?
Yes, users can add or modify KPIs easily.
Is Excel mandatory as a data source?
Yes, this dashboard uses Excel for data entry.
Who benefits most from this dashboard?
Procurement teams, city administrators, and governance bodies.
Click to buy Smart Cities Procurement KPI Dashboard in Power BI
Visit our YouTube channel to learn step-by-step video tutorials
Watch the step-by-step video tutorial: