Cities around the world continue to evolve with the help of technology, data analytics, and sustainable infrastructure. Governments now invest heavily in smart city initiatives to improve transportation systems, energy management, digital governance, environmental sustainability, and citizen services.
However, managing smart city projects requires careful monitoring and coordination. Cities often run dozens of projects simultaneously across departments, regions, and funding sources. Without proper analytics tools, administrators struggle to track budgets, monitor project progress, measure environmental impact, and identify delays.
Therefore, decision-makers need a centralized platform that provides clear insights into project performance. This is where the Smart Cities Project Dashboard in Power BI becomes extremely valuable.
The Smart Cities Project Dashboard in Power BI is a powerful business intelligence tool that helps governments and organizations monitor urban development projects. It enables users to track budgets, project progress, citizen benefits, and sustainability metrics through interactive visualizations.
In this article, we will explore what the Smart Cities Project Dashboard in Power BI is, why organizations need it, how it works, its key features, advantages, best practices, and frequently asked questions.
Click to Purchases Smart Cities Project Dashboard in Power BI
What is a Smart Cities Project Dashboard in Power BI?
A Smart Cities Project Dashboard in Power BI is an interactive analytics tool that visualizes urban development project data.
Smart cities implement projects related to infrastructure development, IoT technology, environmental sustainability, renewable energy, and digital public services. Monitoring these initiatives requires a data-driven approach.
Power BI allows organizations to transform raw project data into interactive dashboards, charts, and performance indicators.
With this dashboard, decision-makers can:
-
Track total smart city projects
-
Monitor budgets and spending
-
Measure citizen benefits
-
Identify project delays
-
Analyze environmental impact
-
Evaluate monthly project trends
Because Power BI provides dynamic filtering and visualization capabilities, administrators can easily analyze project data and make informed decisions.
Why Do Cities Need a Smart Cities Project Dashboard?
Smart city initiatives involve large budgets and multiple stakeholders. Governments must ensure transparency, efficiency, and sustainability while executing these projects.
However, without a proper monitoring system, cities often face several operational challenges.
Common Challenges Without Smart City Dashboards
-
Limited visibility into project progress
-
Difficulty tracking project delays
-
Inefficient budget monitoring
-
Lack of transparency across departments
-
Challenges measuring environmental impact
However, a Power BI dashboard helps solve these issues by providing a centralized analytics platform.
Benefits of Implementing a Smart Cities Dashboard
-
Centralized monitoring of urban development projects
-
Real-time project performance insights
-
Improved budget transparency
-
Faster decision-making
-
Better sustainability tracking
As a result, governments and city administrators can manage development initiatives more effectively.
Key Features of Smart Cities Project Dashboard in Power BI
The Smart Cities Project Dashboard in Power BI provides multiple analytical pages that help users evaluate project performance from different perspectives.
This dashboard includes five interactive pages, each designed to analyze different aspects of city development.
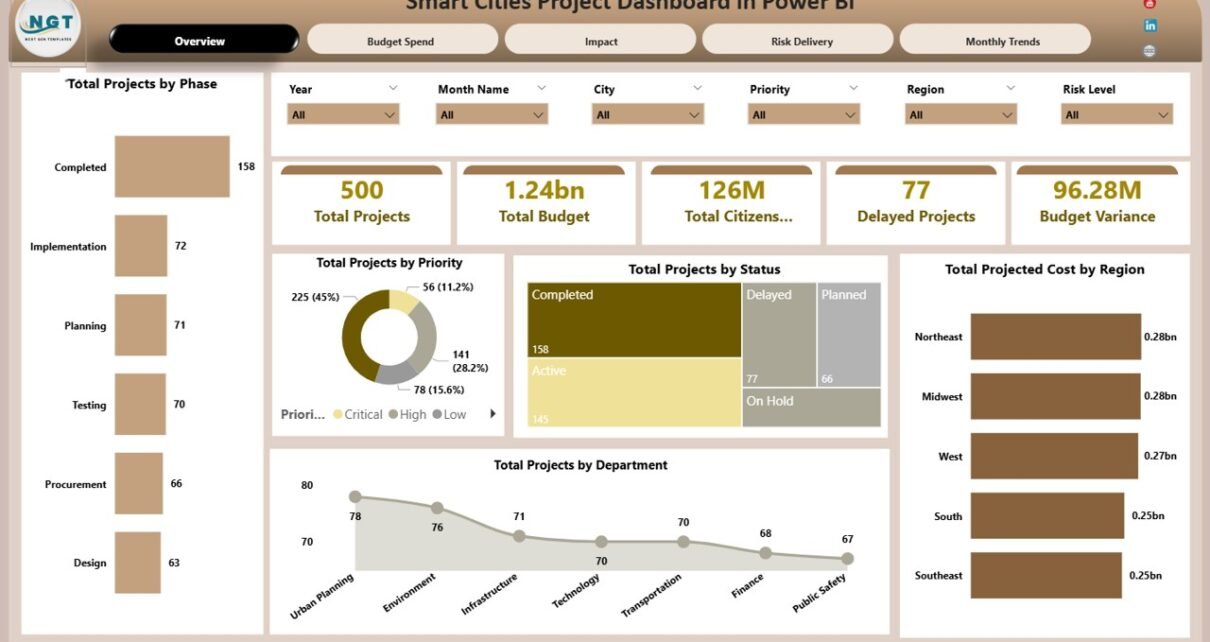
1. Overview Page – Complete Snapshot of Smart City Projects

The Overview Page acts as the primary dashboard where administrators can view the overall status of smart city initiatives.
The page includes interactive slicers, which allow users to filter project data dynamically.
KPI Cards on the Overview Page
The dashboard displays five key performance indicators:
-
Total Projects – Total number of smart city projects
-
Total Budget – Overall project budget allocation
-
Total Citizens Benefited – Number of citizens impacted by the initiatives
-
Delayed Projects – Number of projects that exceed their deadlines
-
Budget Variance – Difference between planned and actual spending
These KPI cards provide a quick overview of project performance.
Charts on the Overview Page
The Overview page also includes five charts:
Total Projects by Phase
This chart categorizes projects based on their development stage such as planning, execution, or completion.
Total Projects by Priority
This chart shows how projects are distributed across priority levels.
Total Projects by Status
This chart helps administrators monitor project progress.
Total Projected Cost by Region
This visualization highlights regional budget allocation.
Total Projects by Department
This chart shows which departments manage the most projects.
These insights allow decision-makers to evaluate project distribution and operational performance quickly.
2. Budget Spend Analysis – Financial Monitoring
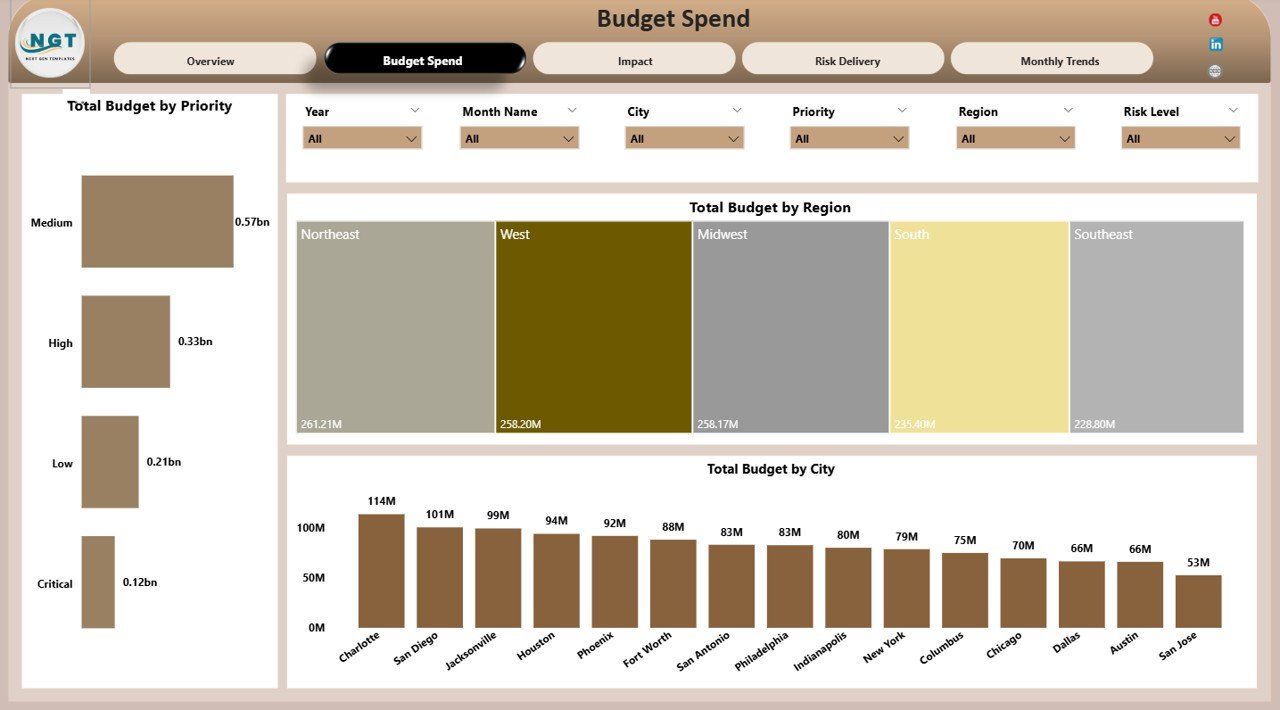
Budget control remains a critical part of smart city management. Therefore, the dashboard includes a Budget Spend Analysis page.
Users can apply slicers to filter data based on different parameters.
Charts Available on This Page
Total Budget by Priority
This chart shows how budgets are distributed across high-priority and low-priority projects.
Total Budget by Region
This chart highlights regional funding allocation.
Total Budget by City
This chart shows how budgets are distributed across cities involved in the program.
Because of these visual insights, financial planners can monitor spending efficiency and ensure responsible allocation of funds.
3. Impact Analysis – Measuring Citizen and Environmental Benefits

Smart city initiatives aim to improve citizen experiences and environmental sustainability.
The Impact Analysis page measures the benefits generated by city development projects.
Charts on the Impact Analysis Page
Total Citizens Benefited by Phase
This chart shows how many citizens benefit from projects in different development phases.
Total Energy Saved (MWh) by Risk Level
Energy savings remain a key sustainability goal. This chart tracks how different projects contribute to energy efficiency.
CO₂ Reduced (Tons) by Department
Reducing carbon emissions plays a major role in smart city strategies. This chart tracks CO₂ reduction across departments.
These insights help governments evaluate the real impact of development initiatives.
Click to Purchases Smart Cities Project Dashboard in Power BI
4. Risk Delivery Analysis – Monitoring Project Risks
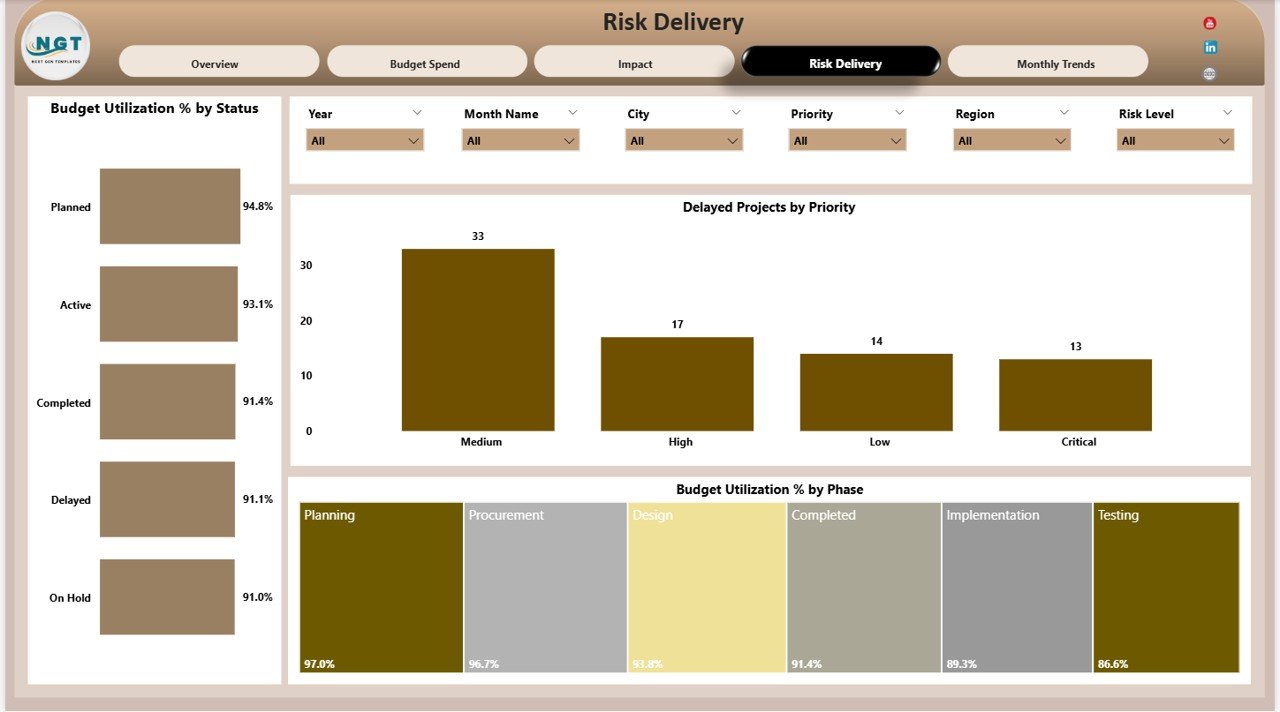
Project delays and operational risks can affect city development plans significantly.
The Risk Delivery Analysis page helps administrators monitor project risks and delivery performance.
Charts Included on This Page
Budget Utilization % by Status
This chart measures how efficiently budgets are used across different project statuses.
Delayed Projects by Priority
This visualization identifies which priority projects experience delays.
Budget Utilization % by Phase
This chart shows how project phases utilize allocated budgets.
Because of these insights, project managers can identify potential risks and take corrective actions early.
5. Monthly Trends Page – Monitoring Project Progress Over Time
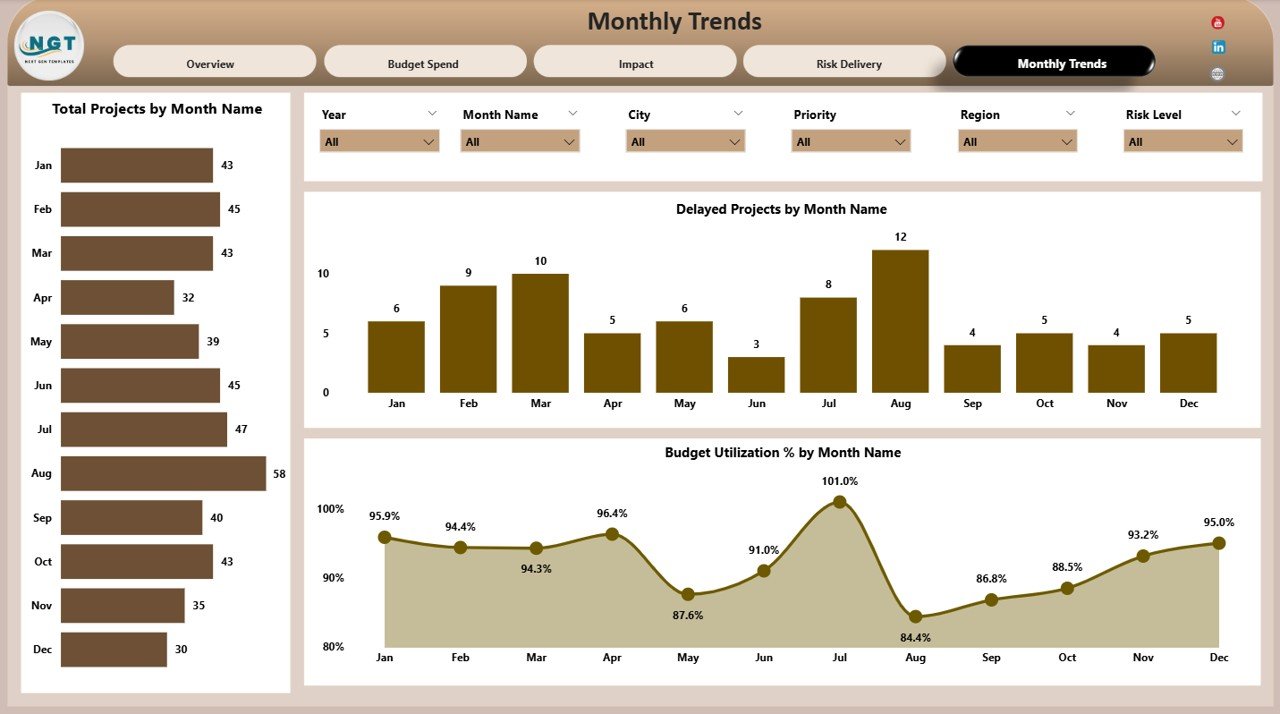
Urban development initiatives evolve over time. Therefore, analyzing monthly performance trends becomes essential.
The Monthly Trends page provides insights into how project metrics change over time.
Charts on the Monthly Trends Page
Total Projects by Month Name
This chart tracks how many projects progress during each month.
Delayed Projects by Month Name
This chart helps identify months when project delays increase.
Budget Utilization % by Month Name
This visualization tracks financial efficiency across months.
These trends help administrators evaluate project progress and improve planning.
Advantages of Smart Cities Project Dashboard in Power BI
Organizations gain many benefits when they implement this dashboard.
Centralized Project Monitoring
All project information remains accessible in one platform.
Better Decision-Making
Interactive dashboards provide quick insights for leaders.
Improved Budget Transparency
Financial analytics improve accountability and resource allocation.
Enhanced Risk Management
Early detection of delays helps prevent project failures.
Sustainability Monitoring
Environmental metrics such as energy savings and CO₂ reduction remain visible.
Improved Collaboration
Departments can align their efforts using shared insights.
Click to Purchases Smart Cities Project Dashboard in Power BI
Best Practices for Using the Smart Cities Project Dashboard
Organizations should follow several best practices to maximize dashboard effectiveness.
Maintain Accurate Data
Always update project data regularly to ensure reliable insights.
Define Clear Performance Indicators
Cities should define KPIs related to sustainability, project completion, and citizen impact.
Monitor Projects Frequently
Regular dashboard reviews help identify risks early.
Train Teams to Use Analytics
Employees should understand how to interpret dashboard insights.
Align Projects with Strategic Goals
Smart city initiatives should support long-term urban development strategies.
How Does a Smart Cities Dashboard Improve Urban Governance?
A Smart Cities dashboard significantly improves city management.
Improves Transparency
Citizens and government leaders can see project progress clearly.
Supports Data-Driven Decisions
Leaders can rely on analytics instead of assumptions.
Enhances Resource Allocation
Cities can distribute budgets and resources more effectively.
Encourages Sustainable Development
Environmental metrics support sustainability goals.
Conclusion
Smart cities rely on advanced technologies and data analytics to manage urban development effectively. With multiple projects running across departments, governments need powerful tools to monitor project performance.
The Smart Cities Project Dashboard in Power BI provides a centralized platform that helps administrators track budgets, evaluate project progress, monitor risks, and measure sustainability impact.
Through interactive visualizations and analytical insights, this dashboard allows city leaders to make informed decisions and ensure successful project delivery.
Therefore, organizations that implement this dashboard can improve transparency, operational efficiency, and long-term urban sustainability.
Click to Purchases Smart Cities Project Dashboard in Power BI
Frequently Asked Questions (FAQs)
What is a Smart Cities Project Dashboard?
A Smart Cities Project Dashboard is an analytics tool used to monitor urban development projects, budgets, and sustainability initiatives.
Why do governments use Power BI dashboards for smart city projects?
Power BI dashboards provide real-time analytics, interactive visualizations, and centralized project monitoring.
What metrics can this dashboard track?
The dashboard can track project budgets, citizen benefits, energy savings, CO₂ reduction, project delays, and budget utilization.
Who should use this dashboard?
City administrators, urban planners, project managers, and government agencies responsible for development initiatives can use this dashboard.
Can this dashboard be customized?
Yes. Organizations can modify charts, KPIs, and filters based on their project requirements.
What industries can use this dashboard?
Government agencies, urban development authorities, infrastructure companies, and sustainability organizations can benefit from this dashboard.
Click to Purchases Smart Cities Project Dashboard in Power BI
Visit our YouTube channel to learn step-by-step video tutorials