Smart cities depend on efficient, transparent, and data-driven purchasing systems. From infrastructure projects to public utilities and digital services, every procurement decision directly impacts budgets, timelines, and citizen satisfaction. Therefore, city administrators must monitor purchasing performance clearly and continuously.
However, when procurement data stays scattered across spreadsheets, emails, and manual reports, teams lose visibility and control. As a result, cost overruns increase, delays become frequent, and vendor accountability weakens.
That is exactly why a Smart Cities Purchasing Dashboard in Excel becomes a powerful and practical solution. This ready-to-use Excel dashboard transforms raw procurement data into clear visuals, performance indicators, and actionable insights—without expensive software or complex implementation.
Click to Purchases Smart Cities Purchasing Dashboard in Excel
In this detailed and SEO-friendly guide, you will learn what a Smart Cities Purchasing Dashboard in Excel is, why it matters, how it works, its page structure, key metrics, advantages, best practices, and frequently asked questions. By the end, you will clearly understand how this dashboard strengthens purchasing governance in smart city environments.
What Is a Smart Cities Purchasing Dashboard in Excel?
A Smart Cities Purchasing Dashboard in Excel is a centralized analytical tool designed to track, analyze, and visualize procurement activities across city departments, vendors, categories, and time periods.
Instead of reviewing multiple static reports, procurement teams use this dashboard to:
-
Monitor planned vs actual costs
-
Track order completion and delays
-
Analyze vendor and department performance
-
Identify cost variances and inefficiencies
Moreover, because the dashboard runs in Microsoft Excel, it remains flexible, familiar, and widely accessible for government teams.
Why Do Smart Cities Need a Purchasing Dashboard in Excel?
Smart city procurement operates at a large scale. Therefore, even small inefficiencies multiply into significant financial and operational risks.
Key Challenges Without a Dashboard
-
Disconnected procurement data across departments
-
Limited visibility into cost overruns
-
Delayed vendor performance tracking
-
Manual and time-consuming reporting
-
Weak accountability and audit readiness
How the Dashboard Solves These Issues
-
Consolidates all purchasing data into one file
-
Provides real-time visual insights
-
Highlights delays and cost variance instantly
-
Improves decision-making speed and accuracy
As a result, city authorities gain control, clarity, and confidence in procurement operations.
How Does the Smart Cities Purchasing Dashboard in Excel Work?
The dashboard uses structured data tables, pivot tables, charts, and slicers to convert raw purchasing data into meaningful insights.
Workflow Overview
-
Data gets entered or imported into the Data Sheet
-
Excel processes the data through calculations and pivots
-
Interactive slicers filter information dynamically
-
Visual charts update instantly across all pages
Consequently, users analyze performance without writing formulas or macros.
Dashboard Structure: Pages and Their Purpose
This Smart Cities Purchasing Dashboard in Excel includes five analytical pages, supported by backend data sheets and navigation tools.
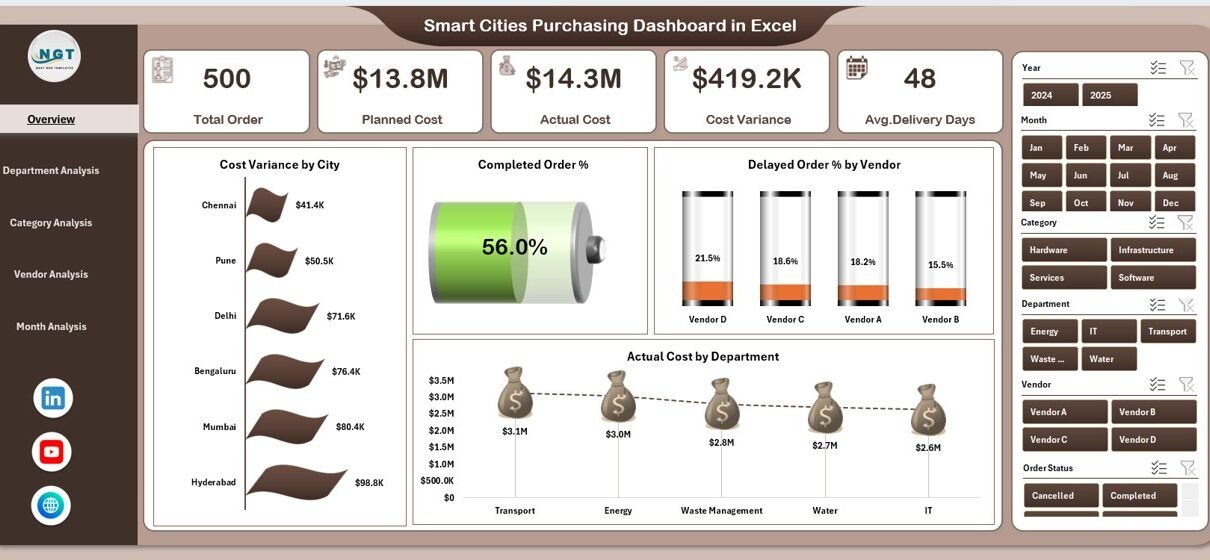
1. Overview Page – How Can City Leaders Get a Quick Snapshot?
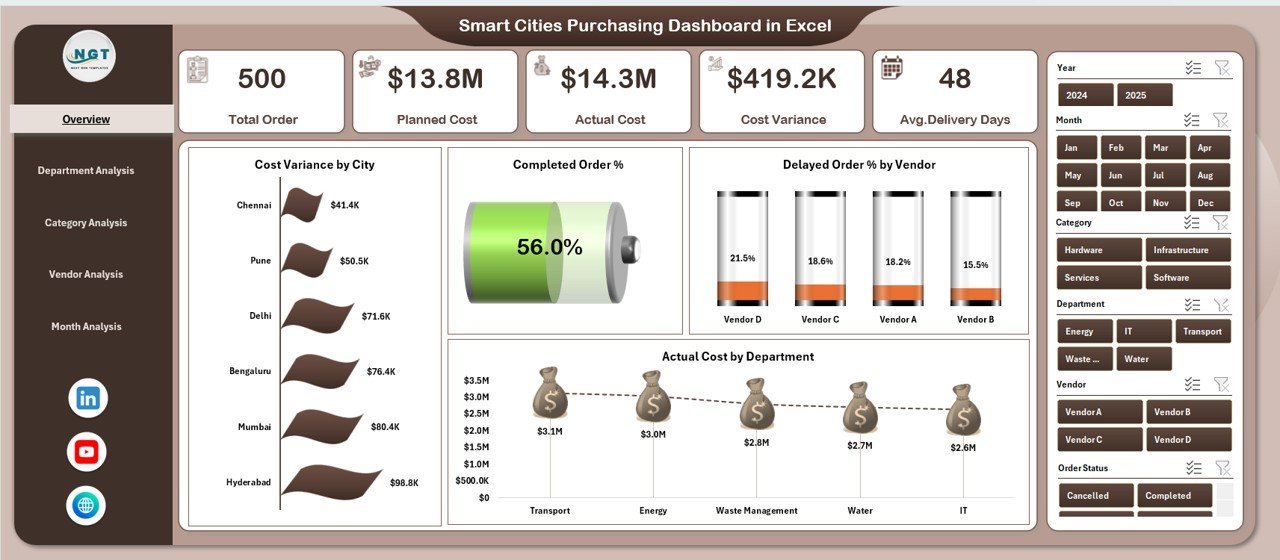
The Overview Page serves as the executive summary of the dashboard. Therefore, decision-makers quickly understand overall procurement health.
Key Elements
-
Right-side slicer for filtering data
-
Four KPI cards for instant performance metrics
-
Four core charts, including:
-
Cost Variance by City
-
Completed Order %
-
Delayed Order % by Vendor
-
Actual Cost by Department
-
Because everything appears on one screen, leaders make faster and better decisions.
2. Department Analysis – Which Departments Perform Better?
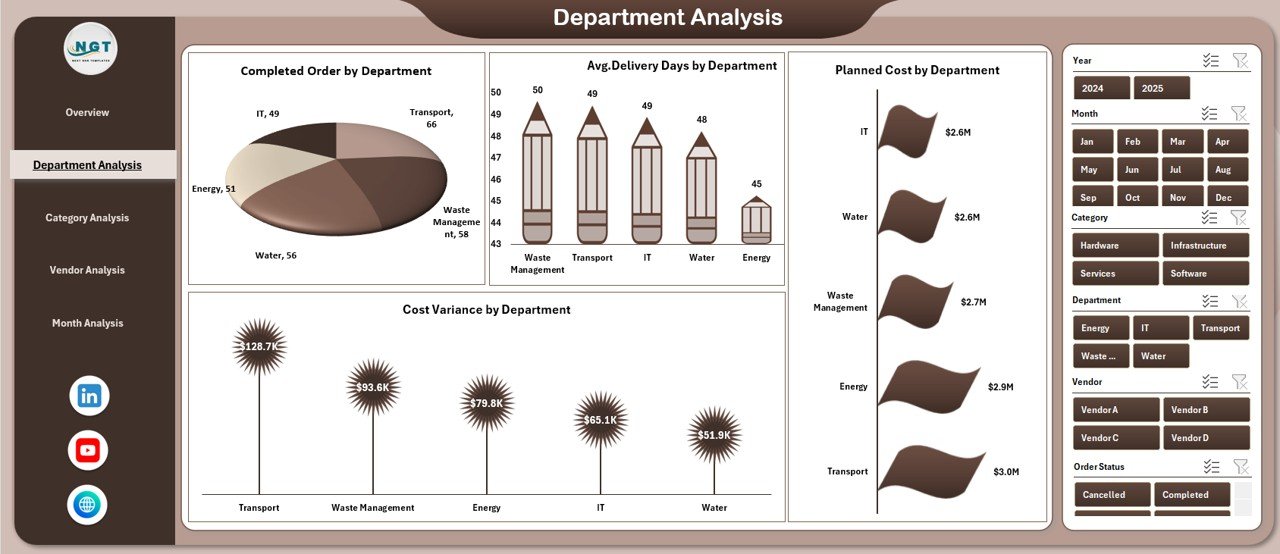
The Department Analysis Page focuses on internal performance across city departments.
Charts Included
-
Completed Orders by Department
-
Average Delivery Days by Department
-
Planned Cost by Department
-
Cost Variance by Department
As a result, procurement managers easily identify:
-
High-performing departments
-
Bottlenecks causing delays
-
Areas with frequent cost overruns
-
Click to Purchases Smart Cities Purchasing Dashboard in Excel
3. Category Analysis – Which Purchase Categories Need Attention?
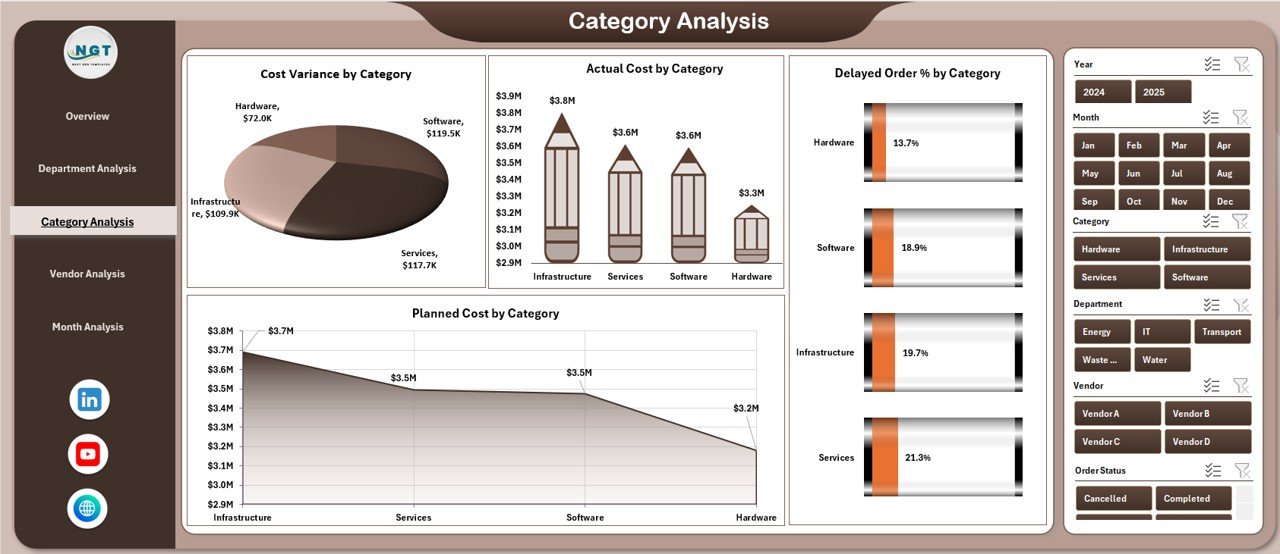
This page analyzes procurement performance by purchase category.
Key Visuals
-
Cost Variance by Category
-
Actual Cost by Category
-
Delayed Order % by Category
-
Planned Cost by Category
Because different categories behave differently, this analysis supports targeted cost control strategies.
4. Vendor Analysis – How Are Vendors Performing?
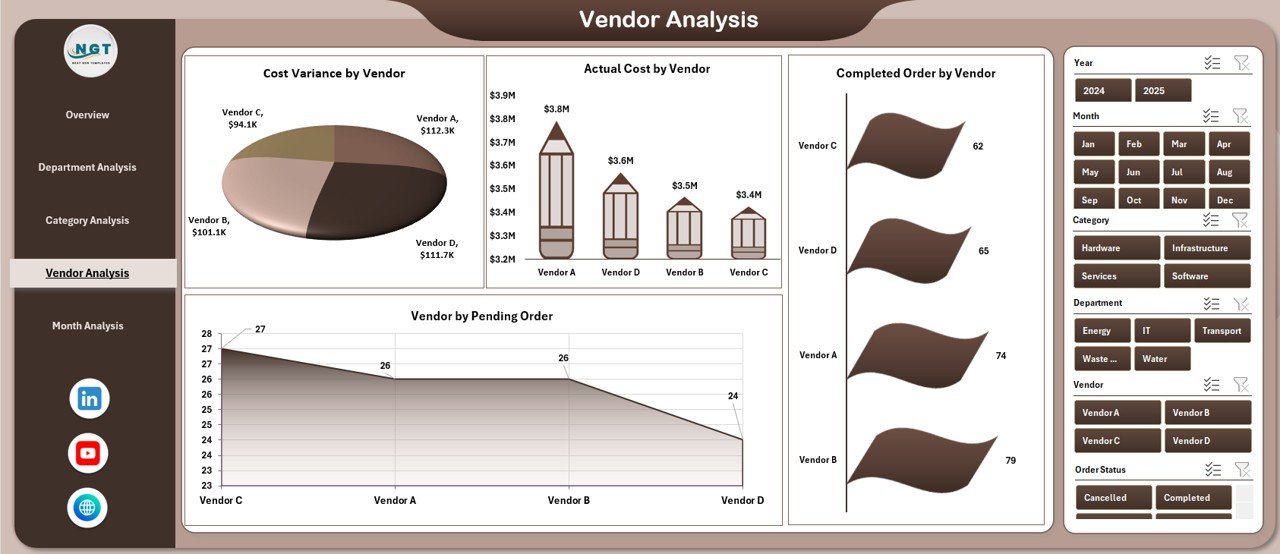
Vendor performance directly impacts project timelines and public services. Therefore, the Vendor Analysis Page becomes essential.
Charts on This Page
-
Cost Variance by Vendor
-
Actual Cost by Vendor
-
Completed Orders by Vendor
-
Pending Orders by Vendor
As a result, procurement teams strengthen:
-
Vendor accountability
-
Contract negotiation strategies
-
Supplier risk management
5. Month Analysis – How Does Purchasing Change Over Time?
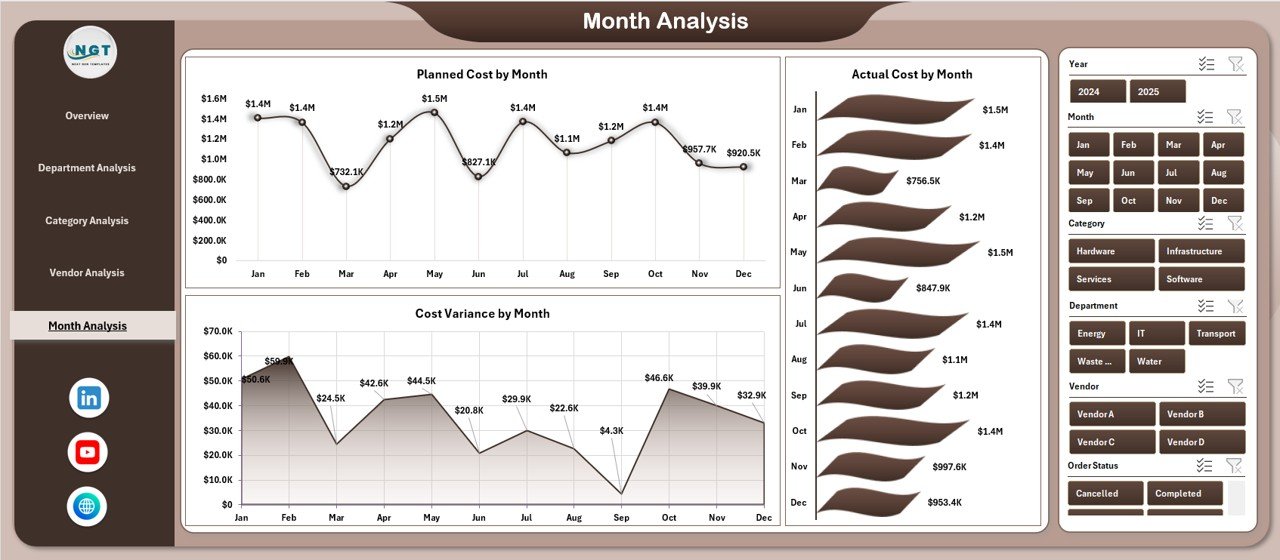
Charts Included
-
Planned Cost by Month
-
Actual Cost by Month
-
Cost Variance by Month
Therefore, city planners identify seasonal patterns, spikes, and long-term trends.
Support Sheets – How Is the Dashboard Powered?
Click to Purchases Smart Cities Purchasing Dashboard in Excel
Data Sheet
-
Stores raw purchasing data
-
Acts as the single source of truth
-
Supports pivot tables and calculations
Support Sheet
-
Holds helper calculations
-
Maintains dashboard logic
-
Ensures smooth performance
Because of this structured design, the dashboard remains scalable and reliable.
Key Metrics Tracked in the Smart Cities Purchasing Dashboard
-
Planned Cost
-
Actual Cost
-
Cost Variance
-
Completed Order %
-
Delayed Order %
-
Average Delivery Days
-
Pending Orders
-
Vendor Performance Indicators
Each metric supports transparent and accountable procurement governance.
Advantages of Smart Cities Purchasing Dashboard in Excel
1. Centralized Procurement Visibility
-
One dashboard replaces multiple reports
-
Consistent data across departments
2. Better Cost Control
-
Instant identification of overruns
-
Improved budget discipline
3. Improved Vendor Management
-
Clear performance comparisons
-
Faster corrective actions
4. Faster Decision-Making
-
Visual insights reduce analysis time
-
Leaders act with confidence
5. Excel-Based Flexibility
-
No new software required
-
Easy customization and scaling
Best Practices for the Smart Cities Purchasing Dashboard in Excel
1. Maintain Clean Data
-
Use standardized formats
-
Avoid manual errors
2. Update Data Regularly
-
Weekly or monthly refresh cycles
-
Keep insights current
3. Use Slicers Wisely
-
Focus analysis on one dimension at a time
-
Avoid information overload
4. Review Trends, Not Just Numbers
-
Look for patterns over time
-
Act before problems grow
5. Align KPIs With City Goals
-
Match procurement metrics with smart city objectives
-
Support sustainability and transparency
How Does This Dashboard Support Smart City Objectives?
Smart cities aim for:
-
Financial transparency
-
Efficient service delivery
-
Data-driven governance
This dashboard supports all three by turning procurement data into clear, actionable intelligence.
Who Can Use the Smart Cities Purchasing Dashboard in Excel?
-
Municipal Procurement Teams
-
City Finance Departments
-
Smart City Program Managers
-
Public Works Authorities
-
Audit and Compliance Teams
Because Excel remains widely adopted, any team can start using it immediately.
Conclusion: Why Is the Smart Cities Purchasing Dashboard in Excel Essential?
Modern smart cities demand clarity, accountability, and efficiency in purchasing operations. Manual reports and fragmented data no longer meet these expectations.
The Smart Cities Purchasing Dashboard in Excel delivers a structured, visual, and reliable solution. It empowers city leaders to control costs, monitor performance, manage vendors, and improve procurement outcomes—all within a familiar Excel environment.
As cities continue to grow and digitize, this dashboard becomes not just helpful, but essential.
Frequently Asked Questions (FAQs)
1. What data is required for the Smart Cities Purchasing Dashboard in Excel?
You need procurement data such as department, vendor, category, planned cost, actual cost, order status, and dates.
2. Can this dashboard handle large datasets?
Yes. With proper structuring, Excel can handle thousands of procurement records efficiently.
3. Does this dashboard require macros or VBA?
No. The dashboard works using pivot tables, charts, and slicers.
4. Can the dashboard be customized for specific city needs?
Absolutely. You can add KPIs, pages, or charts as required.
5. How often should the dashboard be updated?
Most cities update it monthly, while high-activity departments prefer weekly updates.
Visit our YouTube channel to learn step-by-step video tutorials