Managing social services effectively requires continuous performance monitoring and clear data insights. The Social Services KPI Scorecard in Excel offers a structured, easy-to-use solution for organizations that want to evaluate their impact, track efficiency, and improve accountability. This ready-to-use template helps non-profits, government bodies, and community organizations measure how well they achieve their goals.
In this article, we’ll explore what this scorecard is, its structure, how to use it, and the best practices for managing social service performance metrics efficiently.
Click to Purchases Social Services KPI Scorecard in Excel
What Is a Social Services KPI Scorecard in Excel?
A Social Services KPI Scorecard is a performance management tool designed in Excel that tracks key performance indicators (KPIs) related to service delivery, community engagement, resource utilization, and operational efficiency.
This tool allows organizations to:
-
Monitor performance trends over time
-
Compare actual outcomes with planned targets
-
Identify areas that need improvement
-
Make informed decisions based on real data
With this Excel-based scorecard, you don’t need complex BI software to gain deep insights — everything is accessible in a simple, well-structured spreadsheet.
Click to Purchases Social Services KPI Scorecard in Excel
Why Use Excel for Social Services KPI Tracking?
Many social service organizations operate with limited resources. Excel provides:
-
Affordability: No additional software costs
-
Flexibility: Customizable layout and formulas
-
Accessibility: Easy to share and collaborate on
-
Automation: Built-in calculations and conditional formatting
-
Visual Analysis: Charts, color indicators, and progress bars
Excel becomes the perfect solution for both small and mid-sized organizations that want a reliable, easy-to-update KPI system.
Key Features of the Social Services KPI Scorecard in Excel
This scorecard contains four main worksheets, each designed for a specific purpose to keep your data organized and analysis smooth.
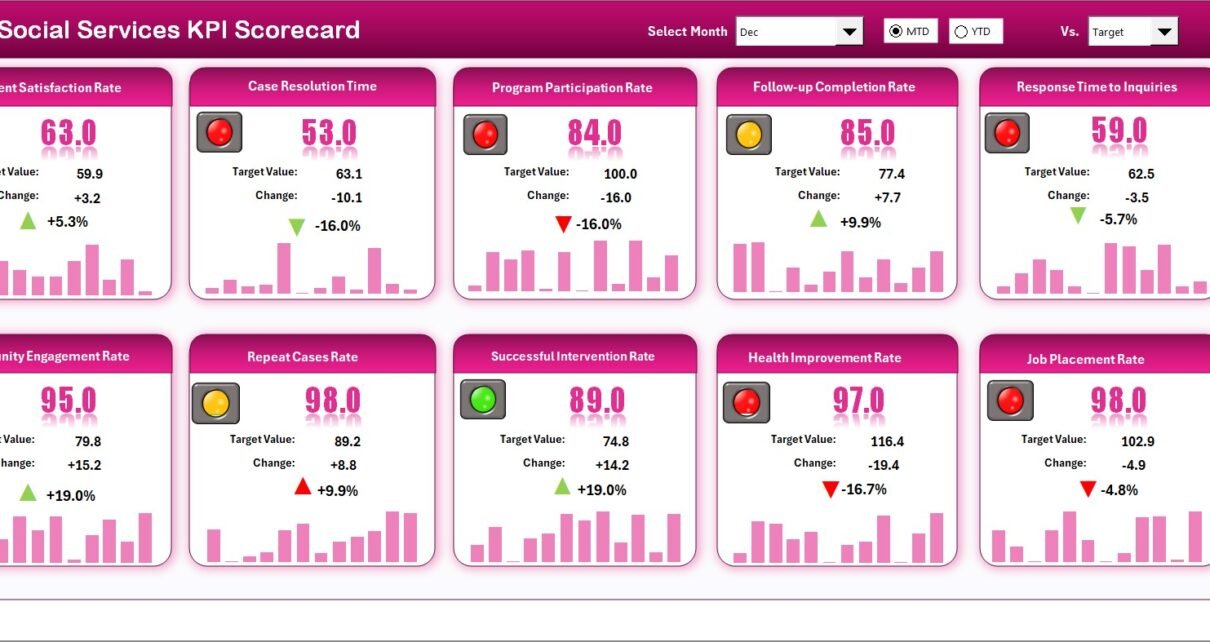
1. Scorecard Sheet – The Main Dashboard
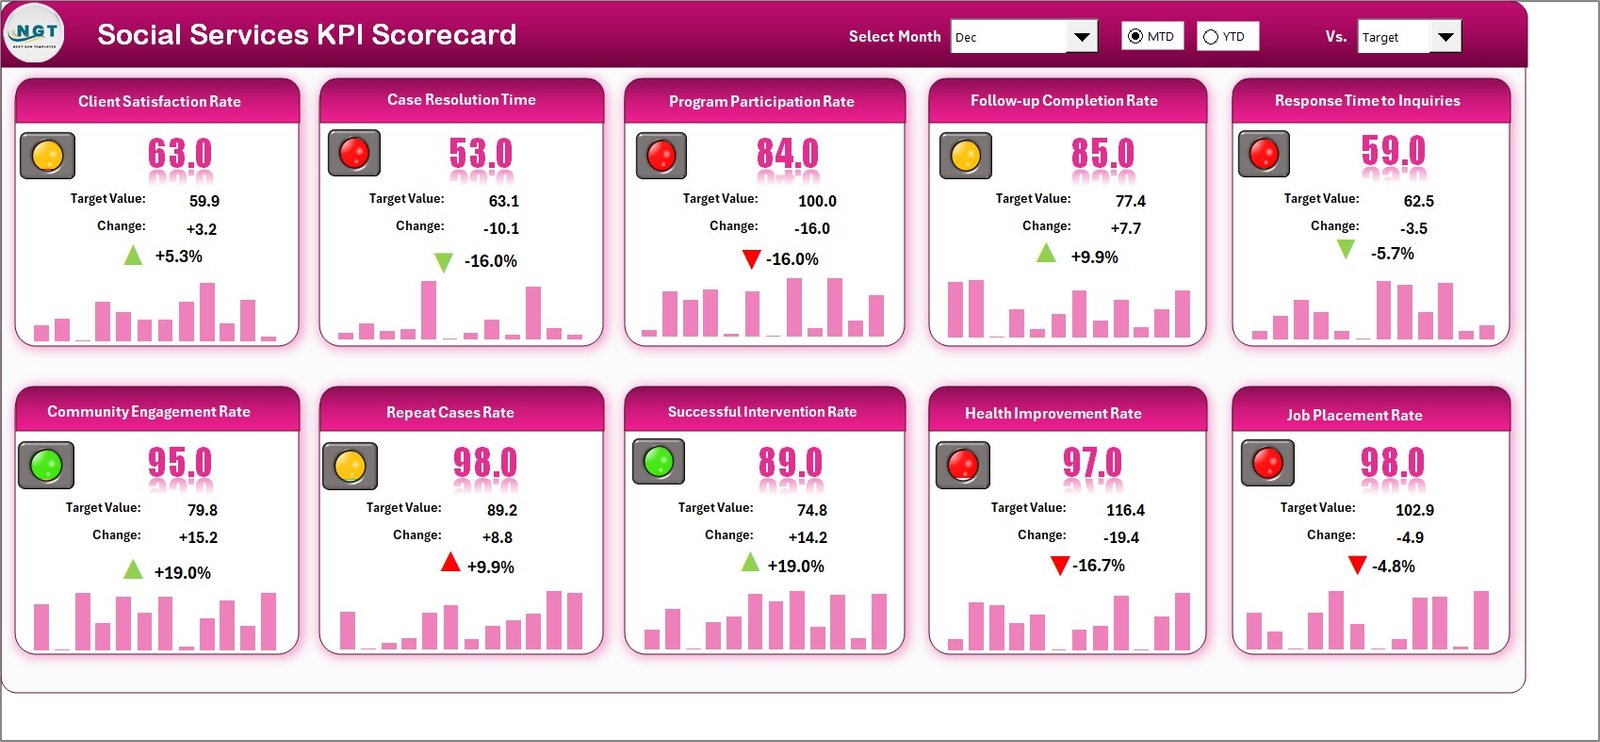
The Scorecard sheet acts as the central dashboard. It visually displays the overall performance for selected months and provides an instant overview of results.
Main Features:
-
Dropdown Menus: Choose the Month, and toggle between MTD (Month-to-Date) or YTD (Year-to-Date) performance.
-
Actual vs Target Comparison: See whether your results meet, exceed, or fall short of the targets.
-
Color-Coded Indicators: Conditional formatting uses green, yellow, and red highlights to mark KPIs as On Target, At Risk, or Below Target.
-
Comprehensive Overview: Each KPI row includes MTD and YTD values for a complete performance summary.
This sheet helps you understand how well your organization performs at any given time without deep data digging.
2. KPI Trend Sheet – Analyze Performance Over Time
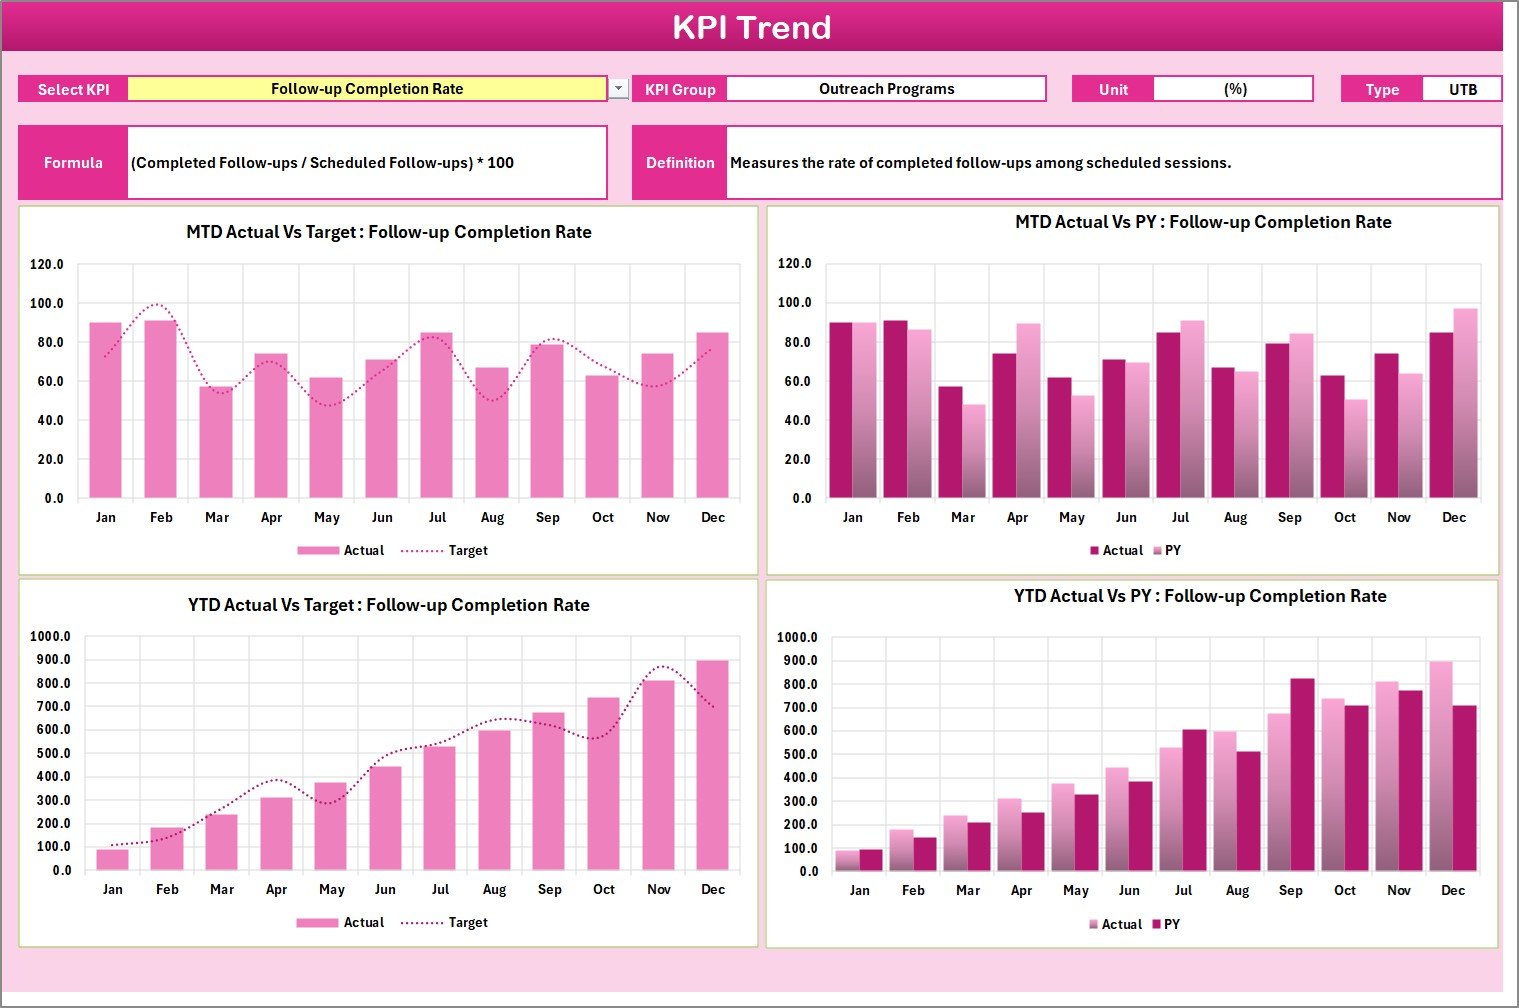
The KPI Trend sheet provides a deeper analytical view. You can analyze how each KPI has performed month by month and track its direction.
Features and Components:
-
Dynamic Dropdown (Cell C3): Select any KPI to view its details.
-
KPI Metadata Display: Automatically shows KPI Group, Unit, Formula, and Type (UTB – Upper the Better / LTB – Lower the Better).
-
MTD & YTD Trend Charts: Line and bar charts visually compare Actual, Target, and Previous Year values for trend analysis.
This visualization makes it easier to pinpoint whether performance is improving or declining over time.
3. Input Data Sheet – Centralized Data Entry
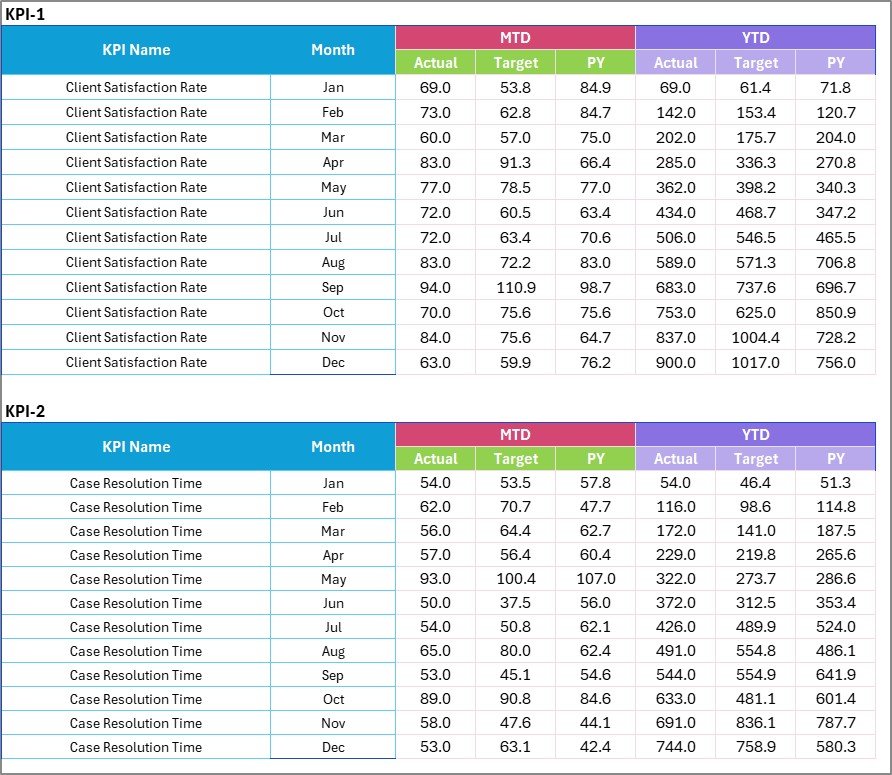
The Input Data Sheet is the foundation of this template. It captures all KPI data month by month.
How It Works:
-
Enter Actual, Target, and Previous Year data for each KPI.
-
The sheet automatically feeds information into the Scorecard and Trend pages.
-
You can easily add new KPIs or modify existing ones without breaking formulas.
This sheet ensures data consistency and simplifies updates whenever new results become available.
4. KPI Definition Sheet – Documentation and Clarity
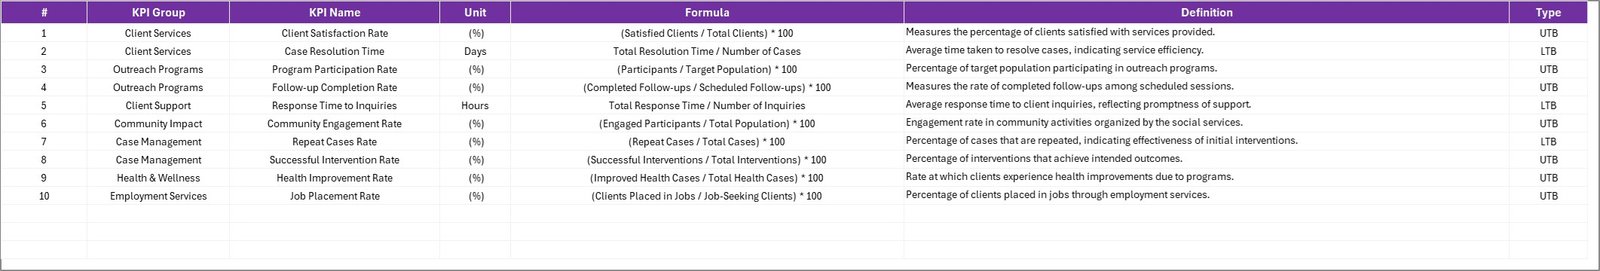
Every KPI should have a clear definition, and this sheet helps maintain that clarity.
Columns Include:
-
KPI Name – The specific performance indicator.
-
KPI Group – The category it belongs to (e.g., Beneficiary Support, Operations, Funding).
-
Unit – The measurement unit such as %, Count, or USD.
-
Formula – The calculation logic used for the KPI.
-
Definition – A short explanation of what the KPI measures.
This sheet acts as your reference manual, ensuring everyone in the organization understands what each KPI means.
Click to Purchases Social Services KPI Scorecard in Excel
How to Use the Social Services KPI Scorecard in Excel
Here’s a step-by-step guide to getting started:
-
Open the Template: Begin by downloading the Social Services KPI Scorecard file.
-
Update the KPI Definition Sheet: Add your organization’s KPIs, units, and formulas.
-
Enter Data in the Input Sheet: Populate Actual, Target, and Previous Year data for each KPI.
-
Navigate to the Scorecard Sheet: Choose the desired Month and Time Period (MTD/YTD).
-
Analyze Results: Use the Scorecard and Trend visuals to identify progress or areas needing improvement.
-
Review Insights Regularly: Update data monthly to keep the report relevant.
Advantages of Using the Social Services KPI Scorecard
Implementing this scorecard in your organization brings several benefits:
✅ 1. Real-Time Monitoring
You can instantly see whether your organization is meeting its monthly or yearly goals.
✅ 2. Improved Accountability
Each KPI can be assigned to a responsible team, improving ownership and follow-up.
✅ 3. Data-Driven Decision Making
With real data at your fingertips, you can make informed, evidence-based decisions.
✅ 4. Visual Insights
Color coding and charts simplify interpretation, even for non-technical users.
✅ 5. Time Efficiency
The automated Excel formulas eliminate manual calculations and repetitive tasks.
✅ 6. Transparency
Clearly defined KPIs and open reporting increase transparency within teams and stakeholders.
How Does the Scorecard Improve Organizational Impact?
Social service organizations often struggle to demonstrate their impact effectively. The KPI Scorecard bridges that gap by:
-
Providing quantifiable performance metrics
-
Highlighting underperforming areas
-
Demonstrating ROI to funders and partners
-
Enabling continuous improvement cycles
By regularly updating and reviewing the scorecard, organizations can ensure every activity aligns with their mission and goals.
Best Practices for the Social Services KPI Scorecard in Excel
To maximize the effectiveness of your scorecard, follow these best practices:
🟩 1. Choose Actionable KPIs
Select metrics that directly influence your mission and can be measured reliably.
🟩 2. Maintain Data Consistency
Ensure that your data entry format remains the same each month to prevent calculation errors.
🟩 3. Set Realistic Targets
Targets should challenge but not discourage your team. Base them on historical performance.
🟩 4. Review Monthly
Hold monthly review meetings using the scorecard to discuss achievements and gaps.
🟩 5. Update Definitions
Regularly revisit the KPI Definition sheet to ensure relevance as programs evolve.
🟩 6. Protect Data Integrity
Lock formulas and protect sheets to prevent accidental overwriting.
🟩 7. Use Charts and Visuals
Visual representations communicate trends faster than tables — use charts for key KPIs.
🟩 8. Backup Data
Keep backups of your KPI scorecard every month to maintain historical performance data.
Tips for Customizing the KPI Scorecard
If you want to tailor this scorecard to your organization:
-
Add additional KPI categories such as Community Outreach or Training Programs.
-
Use drop-downs for department filters.
-
Add conditional icons (✔ / ✘) for quick success tracking.
-
Incorporate pivot tables for deeper trend analysis.
-
Link it with Power BI for advanced visual dashboards.
These modifications make the template adaptable for both local and large-scale NGOs.
Common Mistakes to Avoid
While using this Excel template, be mindful of these common issues:
-
Entering inconsistent date formats.
-
Forgetting to update target values.
-
Using undefined KPIs without clear definitions.
-
Ignoring the trend data while analyzing performance.
-
Failing to share updates with the wider team.
Avoiding these mistakes keeps your scorecard accurate and impactful.
Conclusion
The Social Services KPI Scorecard in Excel empowers organizations to turn data into decisions. With its structured layout, automation, and visual appeal, it helps you track performance, identify challenges, and enhance impact — all in one place.
Whether you manage community programs, educational services, or welfare initiatives, this tool ensures your organization remains focused on measurable, mission-driven outcomes.
By adopting this Excel-based solution, you can transform routine reporting into a dynamic performance monitoring process.
Click to Purchases Social Services KPI Scorecard in Excel
Frequently Asked Questions (FAQs)
1. What is the purpose of the Social Services KPI Scorecard?
It helps organizations measure, track, and improve their performance using data-driven KPIs. It ensures accountability and efficiency in service delivery.
2. How often should I update the scorecard?
It’s best to update the scorecard monthly for MTD data and quarterly or annually for YTD summaries.
3. Can I add more KPIs to the template?
Yes, the Excel file is fully customizable. You can add or modify KPIs without affecting the existing calculations.
4. Is it suitable for small NGOs?
Absolutely. This scorecard is designed for all types of social service organizations, regardless of size or budget.
5. What skills are required to use it?
You only need basic Excel knowledge. The formulas and visuals are automated, so minimal manual setup is needed.
6. Can I connect this scorecard to other software?
Yes, you can link the Input Data Sheet with other databases or import it into Power BI for advanced visualization.
Visit our YouTube channel to learn step-by-step video tutorials
Click to Purchases Social Services KPI Scorecard in Excel