The renewable energy industry continues to expand at an unprecedented pace. Solar panel manufacturers now operate in a highly competitive environment where efficiency, quality, and production performance directly impact profitability. Solar Panel Manufacturing KPI Dashboard in Power BI As production volumes increase, organizations must track operational metrics accurately and make faster data-driven decisions.
Solar Panel Manufacturing KPI Dashboard in Power BI However, many manufacturing companies still depend on manual Excel reports and disconnected data sources. Consequently, managers struggle to evaluate performance trends, compare targets, and identify operational gaps in real time.
So, how can solar panel manufacturers monitor KPIs dynamically and gain actionable insights without building complex enterprise systems?
The answer lies in the Solar Panel Manufacturing KPI Dashboard in Power BI.
This article provides a complete guide to understanding, implementing, and using a Solar Panel Manufacturing KPI Dashboard in Power BI. Moreover, you will learn its features, benefits, implementation process, best practices, and frequently asked questions.
Click to Purchases Solar Panel Manufacturing KPI Dashboard in Power BI
What Is a Solar Panel Manufacturing KPI Dashboard in Power BI?
A Solar Panel Manufacturing KPI Dashboard in Power BI is an interactive analytics solution designed to track manufacturing performance using visual dashboards, automated calculations, and dynamic filters.
Instead of reviewing static spreadsheets, decision-makers analyze KPIs through real-time visualizations. Therefore, teams gain clear visibility into operational efficiency, production targets, and performance trends.
Power BI transforms raw manufacturing data into:
-
Interactive charts
-
KPI performance indicators
-
Trend comparisons
-
Automated calculations
-
Drill-through insights
As a result, organizations make faster and more accurate decisions.
Why Do Solar Panel Manufacturers Need a Power BI KPI Dashboard?
Solar panel production includes several complex processes such as silicon processing, cell manufacturing, module assembly, testing, and packaging. Each stage generates critical performance data.
Without structured analytics, teams face several challenges.
Common Operational Problems
-
Data scattered across multiple files
-
Manual performance tracking
-
Delayed reporting cycles
-
Limited visibility into trends
-
Difficulty comparing targets vs actuals
Therefore, companies require a centralized dashboard that converts data into actionable insights instantly.
Click to Purchases Solar Panel Manufacturing KPI Dashboard in Power BI
Key Features of Solar Panel Manufacturing KPI Dashboard in Power BI
This ready-to-use dashboard includes three powerful pages within the Power BI Desktop application.
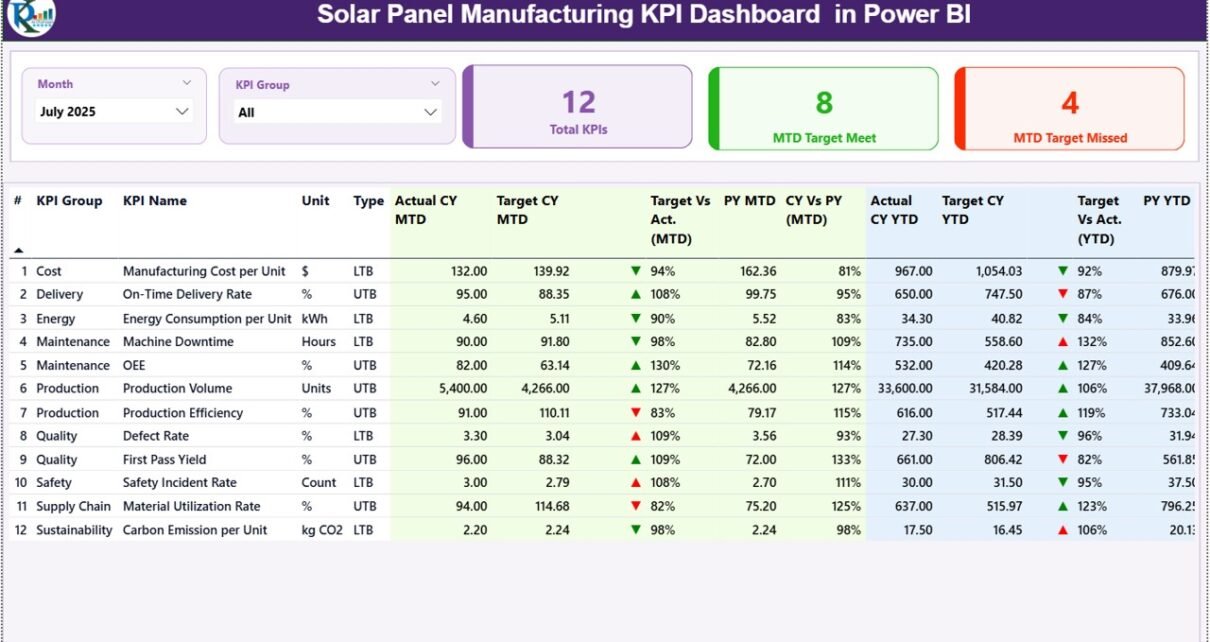
1. Summary Page – Complete KPI Overview
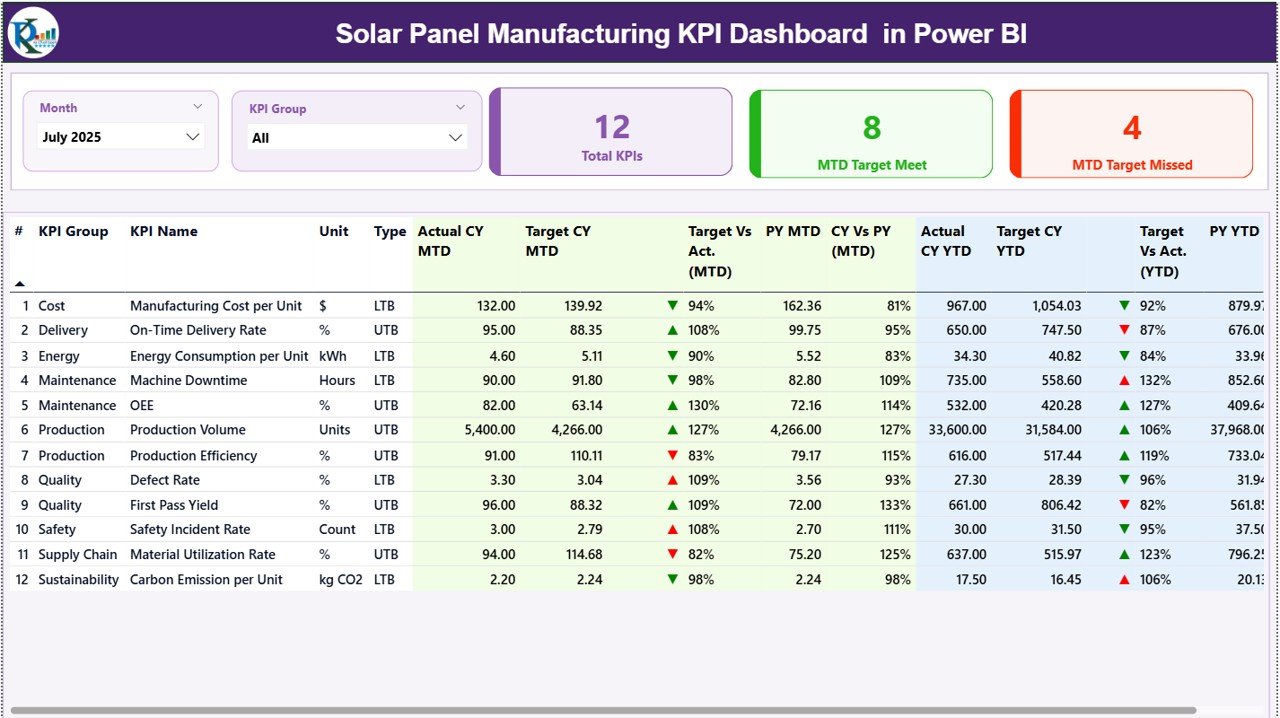
The Summary Page acts as the main control center of the dashboard.
Interactive Filters
At the top, users can select:
-
Month slicer
-
KPI Group slicer
These filters instantly update all visuals across the dashboard.
KPI Performance Cards
Three KPI cards display high-level performance:
-
Total KPI Count
-
MTD Target Meet Count
-
MTD Target Missed Count
Because of these indicators, management quickly understands overall performance status.
Detailed KPI Performance Table
The summary page includes a comprehensive KPI table containing detailed performance metrics.
KPI Information Columns
-
KPI Number – Sequential identifier
-
KPI Group – KPI category
-
KPI Name – Performance metric
-
Unit – Measurement unit
-
Type – LTB (Lower the Better) or UTB (Upper the Better)
MTD Performance Metrics
-
Actual CY MTD
-
Target CY MTD
-
MTD Status Icon (▲ / ▼ with color indicators)
-
Target vs Actual %
-
Previous Year MTD
-
CY vs PY Comparison %
The dashboard calculates performance automatically using formulas such as:
Actual ÷ Target (MTD)
Therefore, users instantly evaluate monthly performance.
YTD Performance Metrics
Additionally, the dashboard displays yearly cumulative performance:
-
Actual CY YTD
-
Target CY YTD
-
YTD Status Icon
-
Target vs Actual %
-
Previous Year YTD
-
CY vs PY Comparison %
These comparisons help organizations measure long-term progress.
Click to Purchases Solar Panel Manufacturing KPI Dashboard in Power BI
2. KPI Trend Page – Performance Trend Analysis
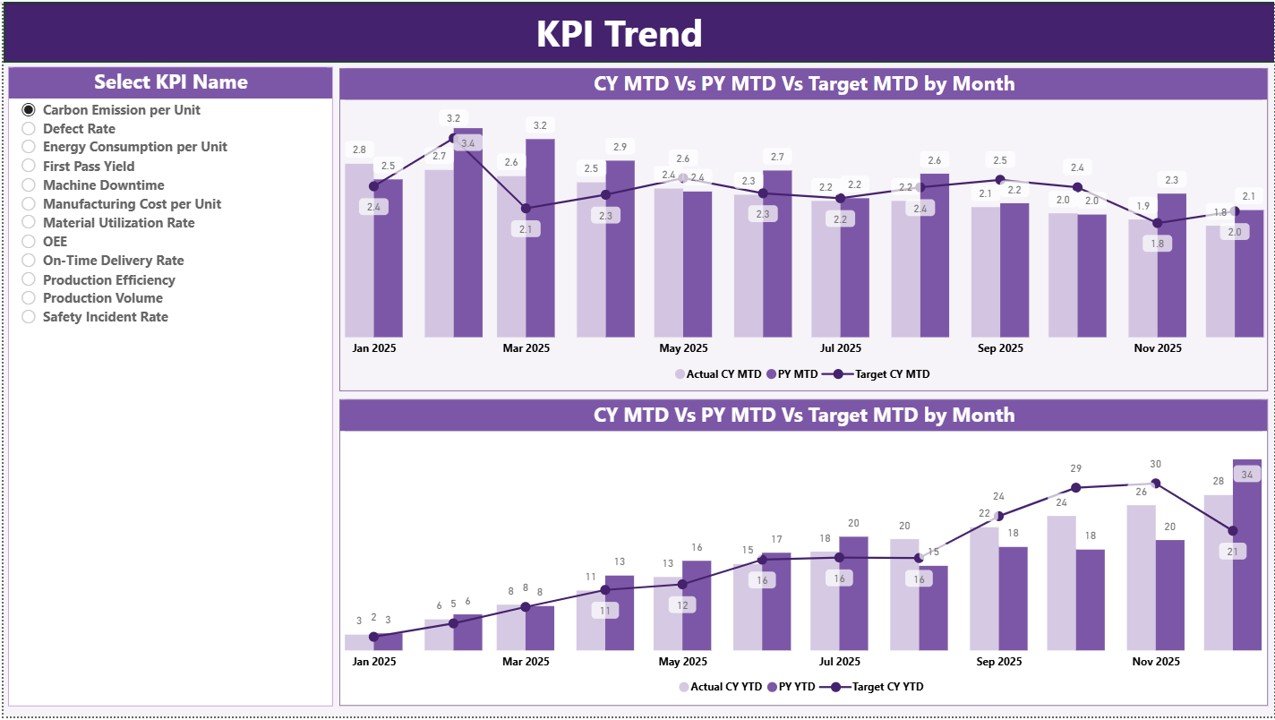
The KPI Trend Page focuses on performance visualization.
Interactive KPI Selection
A slicer on the left allows users to select any KPI.
Once selected, charts update automatically.
Combo Charts Display
Two combo charts visualize:
-
Current Year Actuals
-
Previous Year Values
-
Target Numbers
Charts available:
-
MTD Trend Analysis
-
YTD Trend Analysis
Because visual trends highlight patterns, managers easily identify improvement areas.
3. KPI Definition Page – Drill-Through Insights
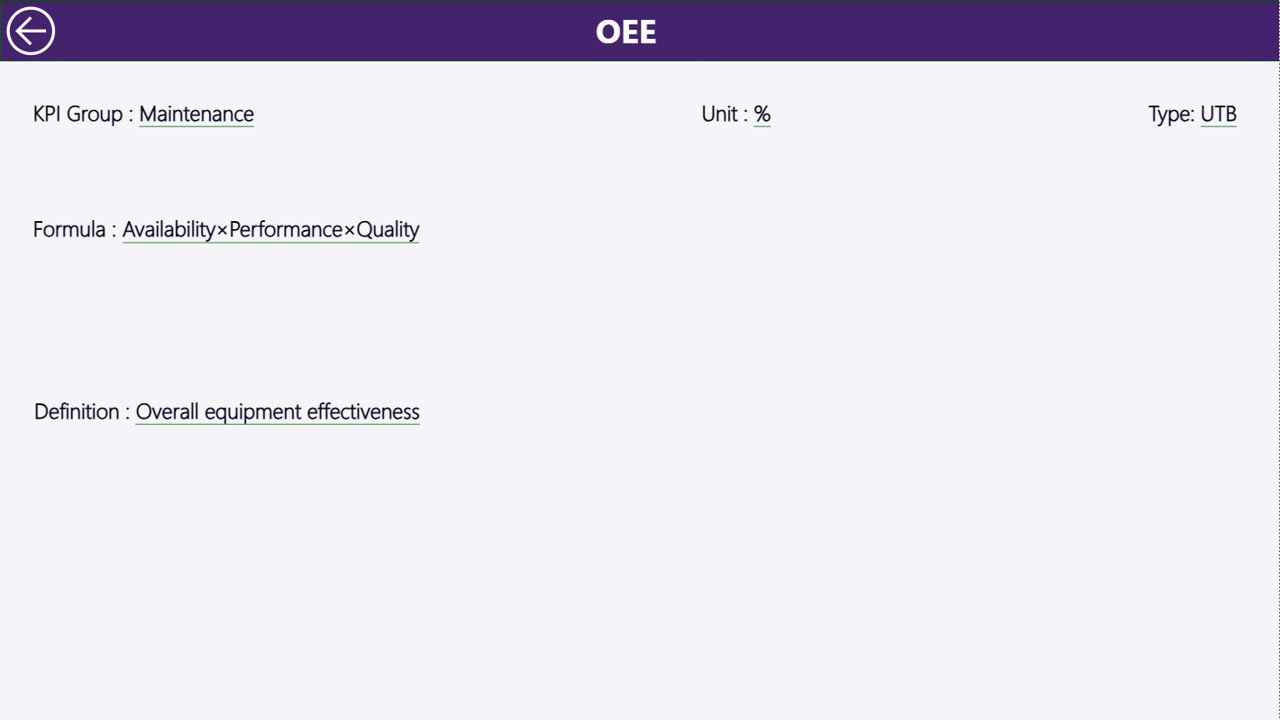
The KPI Definition Page works as a hidden drill-through page.
Users access it directly from the summary page.
Information Available
-
KPI Formula
-
KPI Definition
-
Measurement logic
-
KPI Type (LTB or UTB)
A back button allows users to return to the main page instantly.
Therefore, stakeholders clearly understand KPI calculations without confusion.
Excel Data Source Structure
This dashboard uses an Excel file as the data source, which makes implementation simple and flexible.
Users must populate three worksheets.
1. Input_Actual Sheet
Enter:
-
KPI Name
-
Month (First date of month)
-
MTD values
-
YTD values
This sheet captures operational performance data.
2. Input_Target Sheet
Enter target values:
-
KPI Name
-
Month
-
MTD Targets
-
YTD Targets
Power BI compares these numbers automatically with actual performance.
3. KPI Definition Sheet
Define KPIs by entering:
-
KPI Number
-
KPI Group
-
KPI Name
-
Unit
-
Formula
-
Definition
-
KPI Type (LTB or UTB)
Because definitions remain centralized, reporting stays consistent.
Click to Purchases Solar Panel Manufacturing KPI Dashboard in Power BI
Which KPIs Should Solar Panel Manufacturers Track?
A well-designed dashboard tracks operational, quality, and financial performance.
Production KPIs
-
Production Output
-
Line Efficiency
-
Capacity Utilization
-
Cycle Time
-
Machine Availability
Quality KPIs
-
Defect Rate
-
Yield Percentage
-
Failure Rate
-
Inspection Pass Ratio
Operational KPIs
-
Downtime Hours
-
Energy Consumption
-
Labor Productivity
-
Scrap Rate
Financial KPIs
-
Cost per Panel
-
Production Cost Variance
-
Revenue per Unit
Tracking these KPIs ensures continuous improvement.
How Does Power BI Improve Manufacturing Analytics?
Power BI offers several advantages compared to manual reporting.
Real-Time Insights
Dashboards update instantly when data changes.
Interactive Exploration
Users filter data dynamically using slicers.
Visual Storytelling
Charts make complex data easy to understand.
Centralized Reporting
All performance metrics appear in one platform.
Therefore, leadership makes faster decisions.
Click to Purchases Solar Panel Manufacturing KPI Dashboard in Power BI
Advantages of Solar Panel Manufacturing KPI Dashboard in Power BI
✅ Interactive Analytics
Users explore performance through filters and visuals.
✅ Automated Calculations
Power BI handles complex calculations automatically.
✅ Performance Visibility
Instantly identify target achievements and gaps.
✅ Historical Comparison
Evaluate performance against previous year data.
✅ Scalable Solution
Add KPIs without redesigning the dashboard.
✅ Improved Decision-Making
Data-driven insights support strategic planning.
Because of these benefits, organizations improve operational efficiency significantly.
How to Implement the Dashboard Step-by-Step?
Step 1: Define Manufacturing KPIs
Identify metrics aligned with production goals.
Step 2: Prepare Excel Data
Populate Actual, Target, and Definition sheets.
Step 3: Connect Power BI
Import Excel data into Power BI Desktop.
Step 4: Refresh Data Model
Ensure relationships update correctly.
Step 5: Analyze Summary Page
Review KPI performance indicators.
Step 6: Explore Trends
Use KPI Trend page for analysis.
Implementation usually takes minimal time because the template remains ready to use.
Click to Purchases Solar Panel Manufacturing KPI Dashboard in Power BI
Best Practices for the Solar Panel Manufacturing KPI Dashboard in Power BI
To maximize results, follow these practices.
Maintain Clean Data
Ensure consistent naming conventions.
Update Data Regularly
Refresh monthly performance numbers.
Focus on Actionable KPIs
Avoid unnecessary metrics.
Use Drill-Through Features
Understand KPI definitions clearly.
Monitor Trends Continuously
Identify performance changes early.
Train Users
Ensure teams understand dashboard usage.
Consistent usage improves long-term performance monitoring.
Click to Purchases Solar Panel Manufacturing KPI Dashboard in Power BI
Common Mistakes to Avoid When Using KPI Dashboards
Avoid these issues for better results:
-
Entering inconsistent data formats
-
Ignoring KPI definitions
-
Tracking too many metrics
-
Skipping regular updates
-
Misinterpreting trend comparisons
Instead, maintain structured data governance.
Future of Solar Manufacturing Analytics
As Industry 4.0 expands, dashboards will evolve further.
Future capabilities may include:
-
IoT machine integration
-
Real-time sensor analytics
-
AI forecasting models
-
Predictive maintenance insights
-
Automated alerts
Organizations adopting analytics today prepare for digital transformation tomorrow.
Who Should Use This Dashboard?
This dashboard benefits:
-
Manufacturing Managers
-
Operations Heads
-
Quality Engineers
-
Plant Supervisors
-
Business Analysts
-
Renewable Energy Companies
Because it simplifies analytics, both technical and non-technical users can operate it easily.
Conclusion
Solar panel manufacturing demands precision, efficiency, and continuous monitoring. Manual reporting methods no longer meet modern operational requirements.
The Solar Panel Manufacturing KPI Dashboard in Power BI provides an intelligent and scalable solution. It centralizes KPI tracking, automates performance calculations, and delivers interactive insights that improve decision-making.
Moreover, its structured summary page, trend analysis, and drill-through definitions ensure complete performance visibility.
Therefore, manufacturers can enhance productivity, improve quality, and achieve strategic goals using data-driven analytics powered by Power BI.
Click to Purchases Solar Panel Manufacturing KPI Dashboard in Power BI
Frequently Asked Questions (FAQs)
1. What is a Solar Panel Manufacturing KPI Dashboard in Power BI?
It is an interactive Power BI dashboard used to monitor manufacturing KPIs using visual analytics.
2. Do I need Power BI expertise to use this dashboard?
No. Basic Power BI knowledge is sufficient because the dashboard remains ready to use.
3. Can I modify KPIs?
Yes. You can add or customize KPIs through the Excel data source.
4. How often should data be refreshed?
You should refresh data monthly or whenever performance updates occur.
5. Why compare current year with previous year?
Comparisons help measure improvement and identify performance trends.
6. Is Excel required for this dashboard?
Yes. Excel acts as the primary data source for inputs.
7. Can this dashboard scale for large manufacturing plants?
Yes. Power BI supports large datasets and advanced analytics.
Click to Purchases Solar Panel Manufacturing KPI Dashboard in Power BI
Visit our YouTube channel to learn step-by-step video tutorials