Managing a Sovereign Wealth Fund (SWF) involves balancing complex financial data, analyzing investment performance, and ensuring long-term returns for future generations. With billions under management, these funds demand accurate, timely, and transparent reporting systems.
That’s where the Sovereign Wealth Funds Dashboard in Excel comes in — a powerful, interactive, and ready-to-use analytical tool designed to help investment professionals visualize, monitor, and optimize fund performance efficiently.
In this detailed guide, we’ll explore everything you need to know about this Excel-based dashboard — including its structure, features, benefits, and best practices for effective use.
Click to Purchases Sovereign Wealth Funds Dashboard in Excel
🌍 What Is a Sovereign Wealth Fund?
A Sovereign Wealth Fund (SWF) is a state-owned investment fund that manages national savings for investment purposes. These funds are typically created from surplus revenues such as oil exports, trade surpluses, or foreign currency reserves.
Governments use SWFs to diversify their portfolios, stabilize their economies, and ensure future financial security for their citizens.
Common examples include:
-
Norway’s Government Pension Fund Global
-
Abu Dhabi Investment Authority
-
China Investment Corporation
-
Kuwait Investment Authority
Each of these funds handles massive portfolios — often across sectors like energy, real estate, infrastructure, and technology — which makes tracking their performance extremely important.
💡 What Is a Sovereign Wealth Funds Dashboard in Excel?
A Sovereign Wealth Funds Dashboard in Excel is a data-driven reporting solution built entirely in Microsoft Excel. It allows users to monitor investment portfolios, analyze sectoral performance, assess fund risks, and visualize key financial metrics in one interactive view.
This dashboard transforms raw data into actionable insights through visual charts, KPIs, and analytical summaries — helping fund managers and analysts make data-informed investment decisions.
Unlike static spreadsheets, this dashboard is dynamic, visually engaging, and built to handle real-time updates.
Click to Purchases Sovereign Wealth Funds Dashboard in Excel
⚙️ Key Features of the Sovereign Wealth Funds Dashboard in Excel
This Excel-based tool is designed with powerful analytics and intuitive navigation to make complex financial monitoring simple and effective.
🧭 Page Navigator
Located on the left side, the Page Navigator helps you switch between analytical pages quickly. You can jump between pages like Overview, Fund Name Analysis, Sector Analysis, Asset Class Analysis, and Monthly Trends with a single click.
📄 Dashboard Structure
The dashboard includes five analytical pages and supporting sheets that make it easy to manage, update, and visualize all aspects of the Sovereign Wealth Fund.
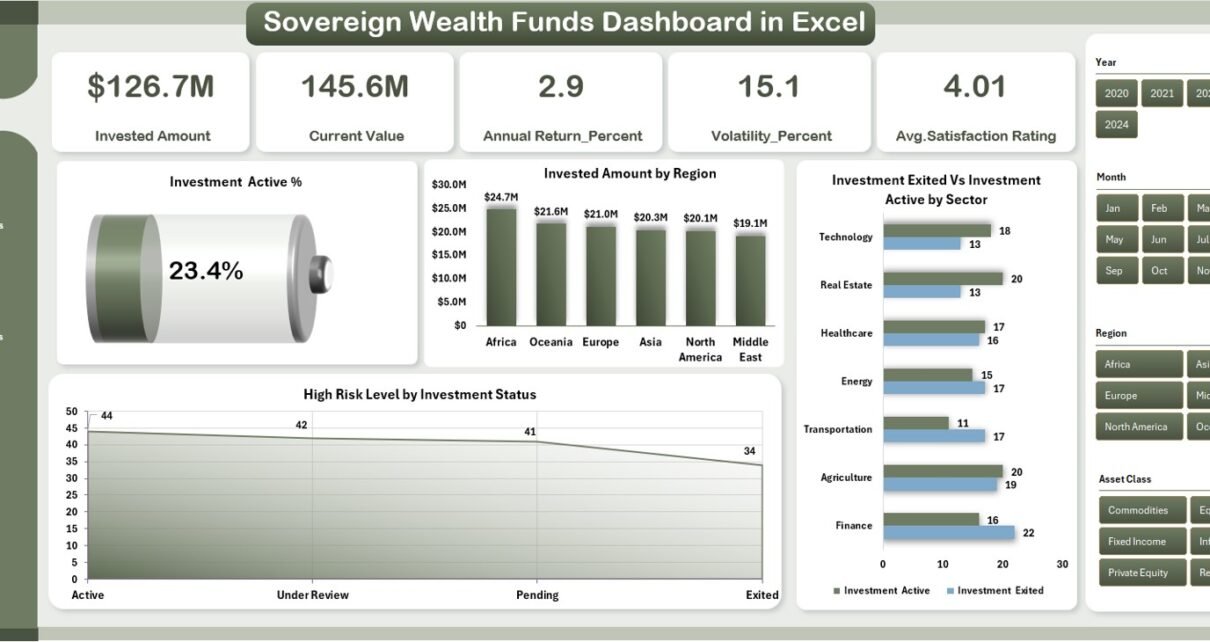
📊 1. Overview Page — The Command Center
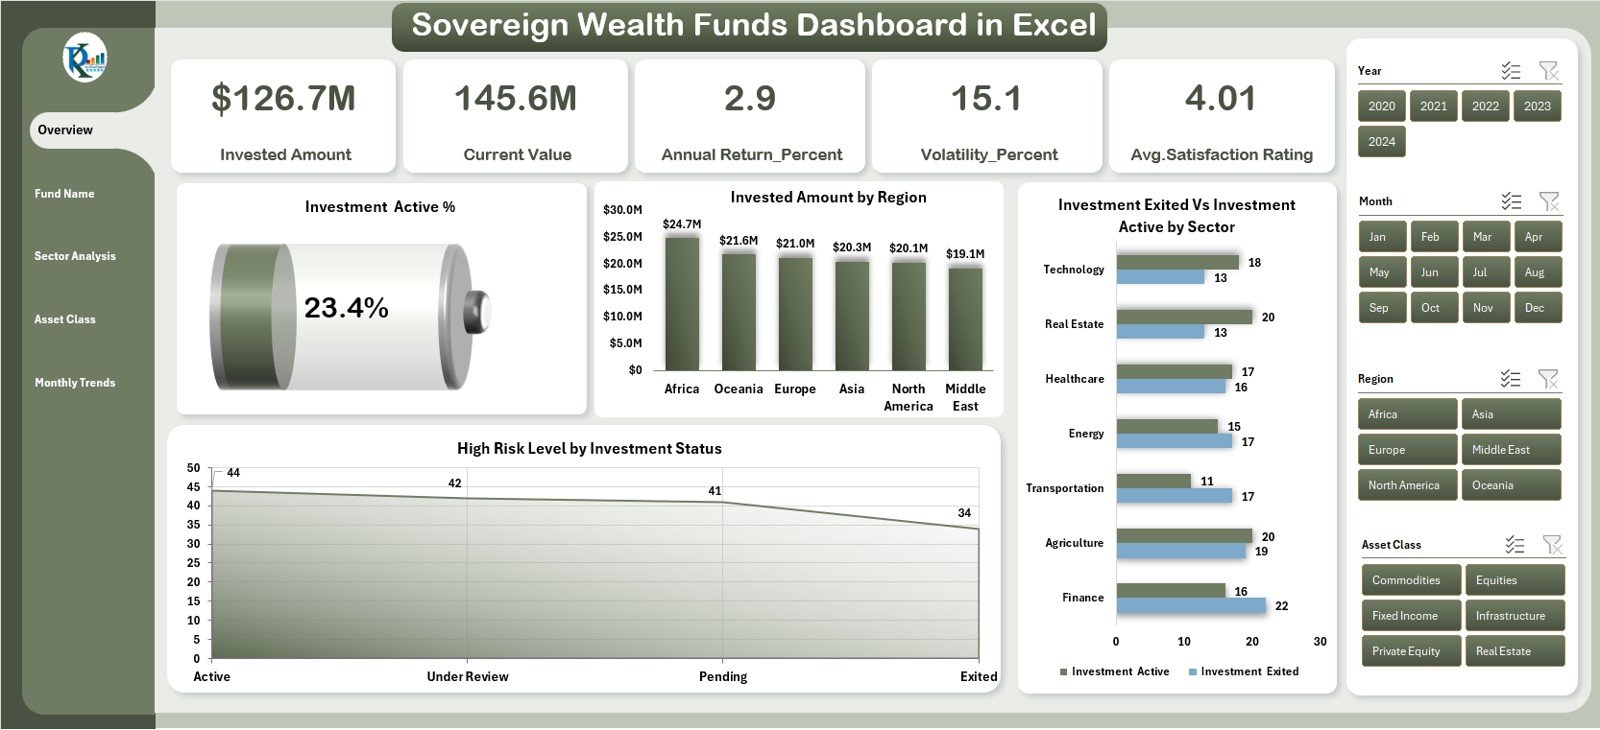
The Overview Page serves as the main summary page of the dashboard. It provides a high-level snapshot of fund performance using KPIs and interactive visuals.
Main Highlights:
-
Five key cards displaying performance summaries.
-
Four core charts:
-
Investment Active %
-
Invested Amount by Region
-
High-Risk Level by Investment Status
-
Investment Exited vs. Investment Active by Sector
-
This page gives executives and analysts a quick glance at the overall health of the sovereign wealth fund, helping identify which regions or sectors are performing best and where risks are concentrated.
💰 2. Fund Name Analysis — Deep Dive into Individual Funds
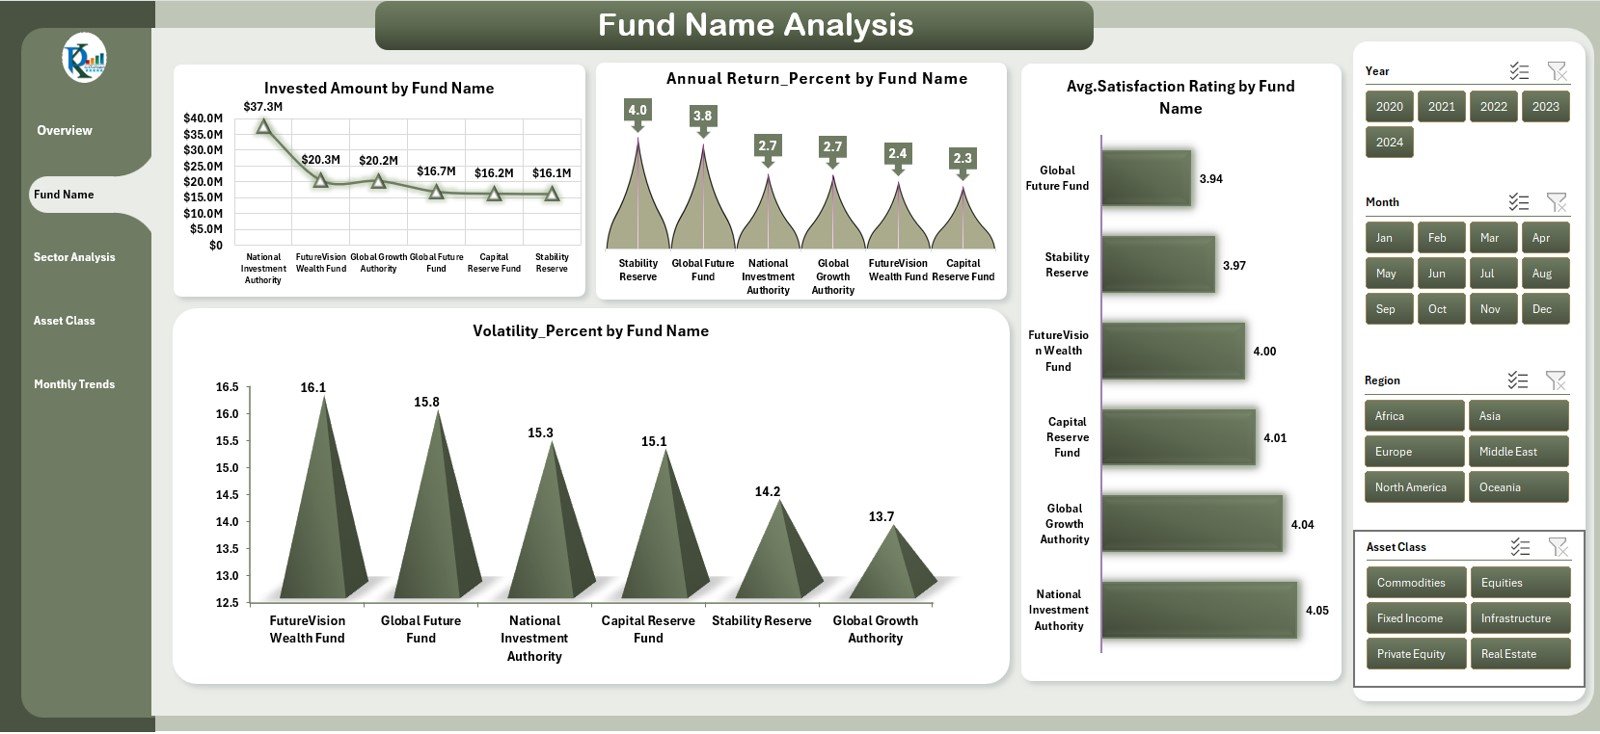
The Fund Name Analysis Page allows users to assess the performance of each fund within the portfolio.
This section focuses on fund-specific KPIs that measure returns, satisfaction, and risk levels.
Key Visuals and Metrics:
-
Invested Amount by Fund Name
-
Annual Return % by Fund Name
-
Volatility % by Fund Name
-
Average Satisfaction Rating by Fund Name
With these insights, managers can easily identify top-performing funds and those requiring closer attention.
Click to Purchases Sovereign Wealth Funds Dashboard in Excel
🏢 3. Sector Analysis — Measuring Sectoral Performance
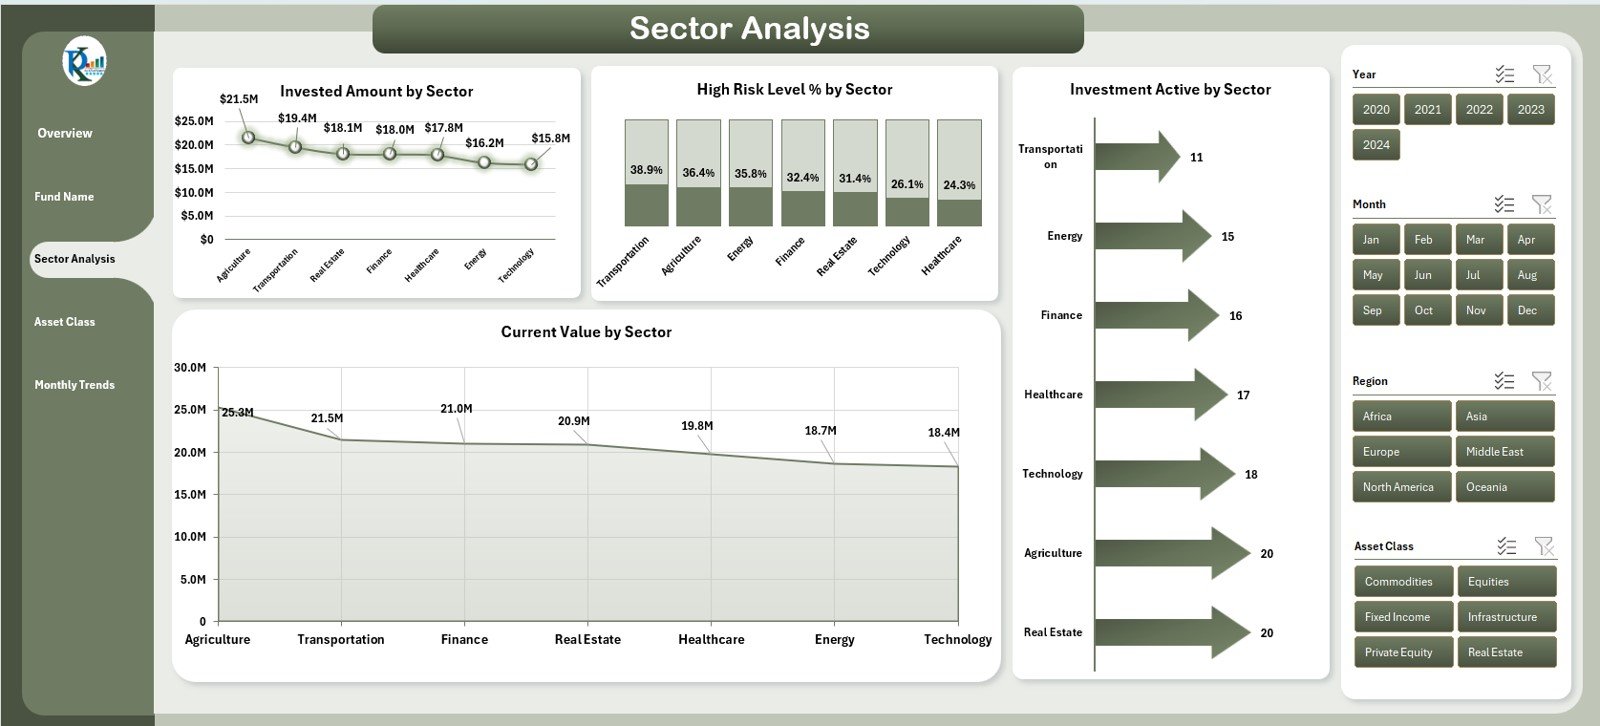
The Sector Analysis Page gives a breakdown of investment performance across various industry sectors such as energy, infrastructure, healthcare, and technology.
Charts Included:
-
Invested Amount by Sector
-
High-Risk Level % by Sector
-
Current Value by Sector
-
Investment Active by Sector
This page helps analysts understand which sectors contribute most to the fund’s growth and which ones are prone to volatility or underperformance.
💼 4. Asset Class Analysis — Balancing Portfolio Diversity
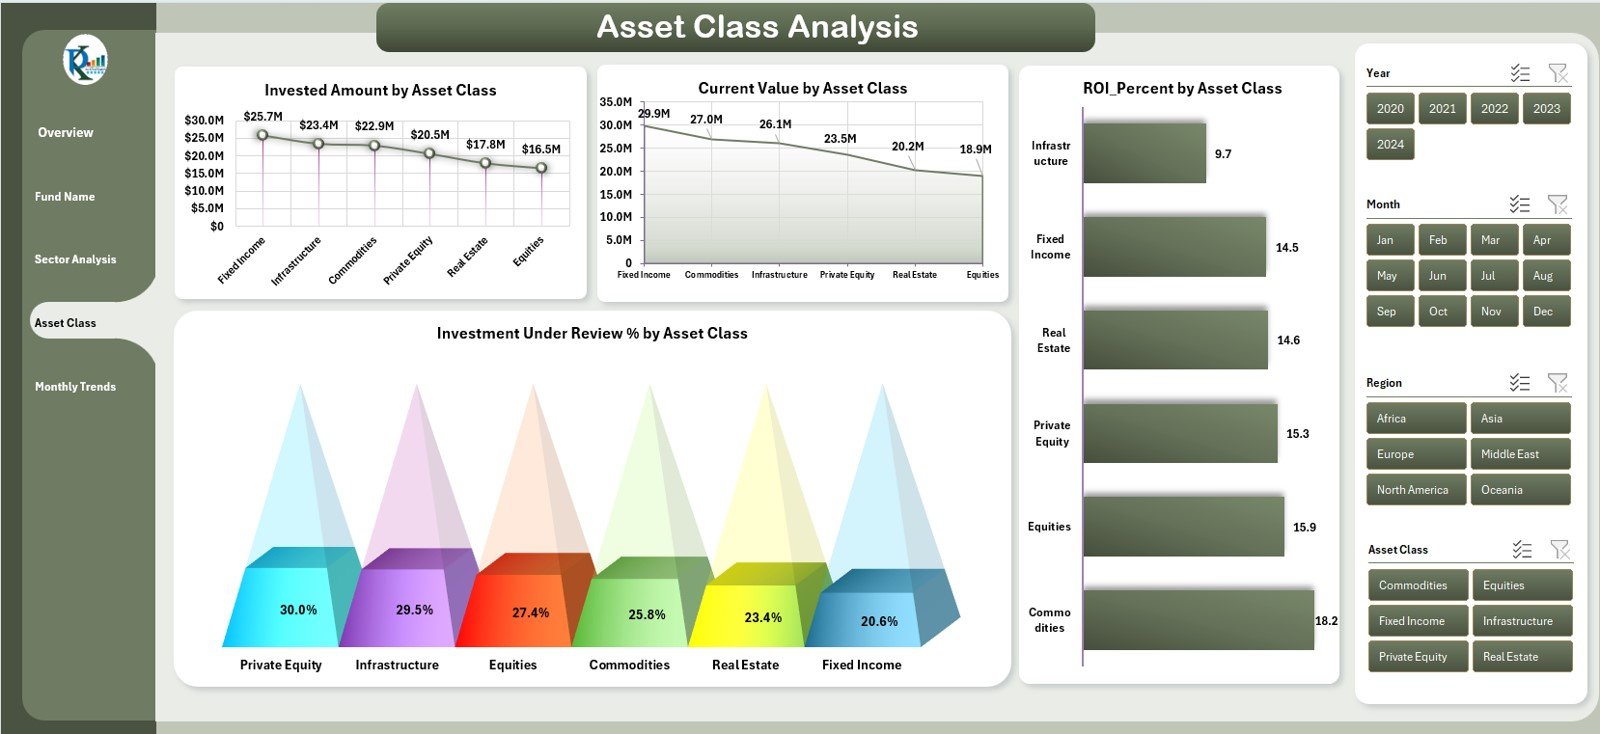
The Asset Class Analysis Page provides insights into different asset types — such as equities, bonds, real estate, commodities, and alternative assets.
It helps in evaluating diversification and asset-level performance.
Charts Included:
-
Invested Amount by Asset Class
-
Current Value by Asset Class
-
Investment Under Review % by Asset Class
-
ROI % by Asset Class
This analysis ensures that the fund maintains a balanced allocation and adjusts exposure based on risk and return expectations.
📅 5. Monthly Trends — Tracking Performance Over Time
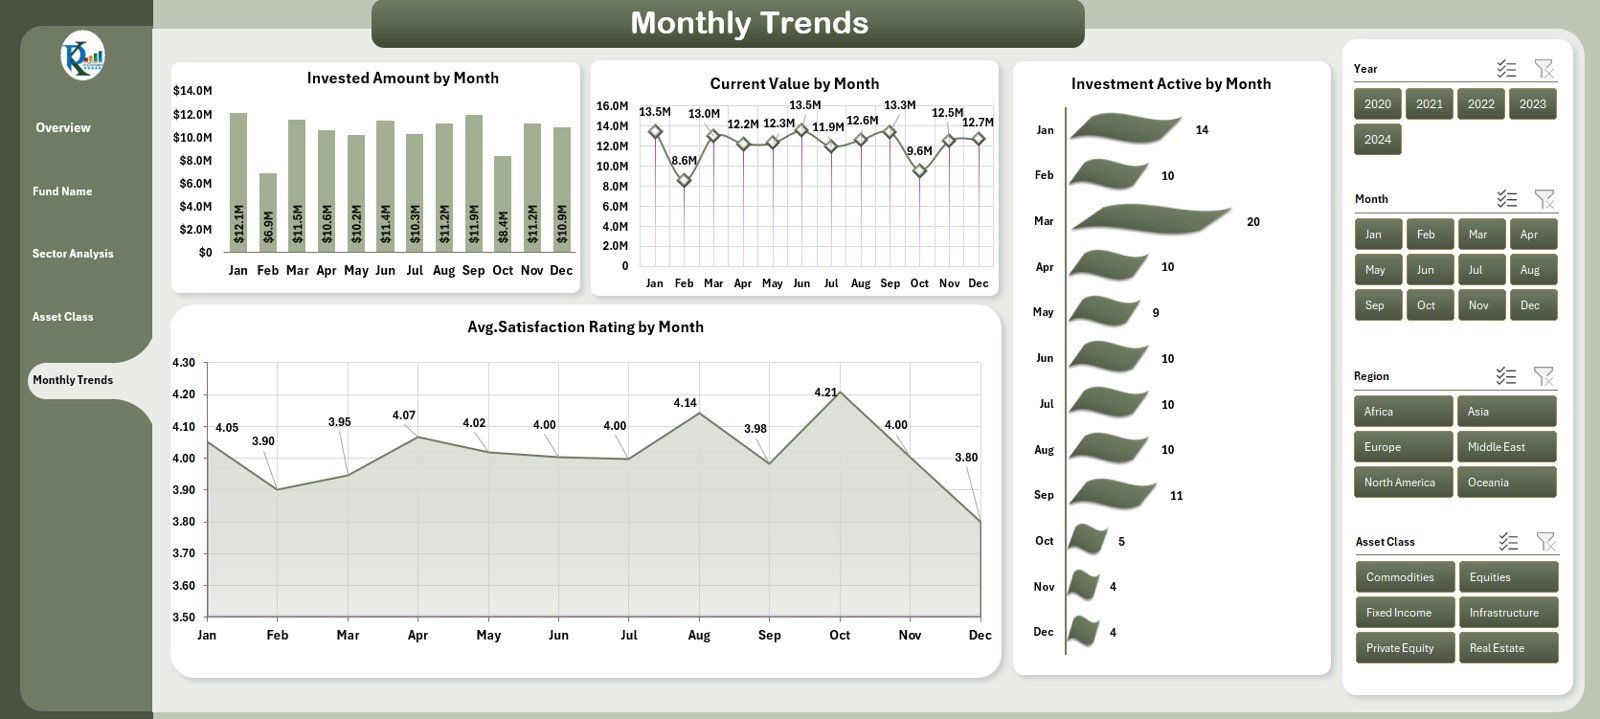
The Monthly Trends Page visualizes how investments and key indicators change month over month.
It’s essential for tracking consistency, identifying growth trends, and spotting early warning signals.
Charts Included:
-
Invested Amount by Month
-
Current Value by Month
-
Average Satisfaction Rating by Month
-
Investment Active by Month
By analyzing these monthly patterns, decision-makers can forecast performance and plan future investment strategies more effectively.
🧾 Supporting Sheets — The Backbone of Data
1. Support Sheet
This sheet contains the necessary setup data, mapping fields, and lookup tables for drop-downs and slicers. It ensures the dashboard runs smoothly and all formulas are correctly linked.
2. Data Sheet
The Data Sheet stores all raw input values such as fund names, investment categories, regions, and performance metrics. Users can easily update or import new data each period to refresh the dashboard automatically.
Click to Purchases Sovereign Wealth Funds Dashboard in Excel
🎯 Why Use a Sovereign Wealth Funds Dashboard in Excel?
Managing a Sovereign Wealth Fund involves thousands of data points — across currencies, time periods, and sectors. Without an organized system, analysis becomes time-consuming and error-prone.
Here’s why Excel remains a reliable platform for SWF analytics:
✅ Flexibility
You can customize it according to fund structure, investment regions, or asset classes.
✅ Automation
Excel formulas and pivot tables automate calculations, saving time and improving accuracy.
✅ Visualization
Charts, KPIs, and conditional formatting provide a quick understanding of performance at a glance.
✅ Accessibility
No need for expensive software — Excel is widely available and easy to share across teams.
Click to Purchases Sovereign Wealth Funds Dashboard in Excel
🌟 Advantages of the Sovereign Wealth Funds Dashboard in Excel
1. Centralized Data Management
All your investment information — from fund details to asset performance — lives in one unified location.
2. Improved Decision-Making
Interactive visuals help fund managers identify growth opportunities and potential risks faster.
3. Real-Time Tracking
Users can update the data periodically and immediately see the impact on all visualizations.
4. Transparency and Accountability
Clear reporting builds trust among stakeholders and government agencies monitoring fund performance.
5. Cost Efficiency
Unlike specialized BI tools, Excel offers a low-cost yet powerful analytics environment.
📈 How to Use the Sovereign Wealth Funds Dashboard Effectively
Step 1: Input the Data
Enter your investment details — including fund names, sectors, regions, and asset values — into the Data Sheet.
Step 2: Set Targets and Thresholds
Define performance targets such as return rates, risk levels, or satisfaction ratings.
Step 3: Review KPIs
Use the Overview Page to compare Actual vs. Target values, highlighting overperforming or underperforming segments.
Step 4: Analyze Specific Dimensions
Navigate to pages like Sector or Asset Class Analysis for deeper insights.
Step 5: Update Monthly
Keep data updated each month to ensure trends and analytics remain current.
🔍 Opportunities for Improvement
While Excel dashboards offer flexibility, users can enhance efficiency and scalability through a few upgrades:
-
Integration with Power BI: For advanced visualization and automated updates.
-
Macro Automation: To refresh data and generate reports with a single click.
-
Cloud Collaboration: Using Excel Online or Google Sheets for real-time teamwork.
-
Performance Benchmarks: Adding peer comparison metrics for better strategic insights.
🧩 Best Practices for Using the Sovereign Wealth Funds Dashboard
1. Keep Data Clean
Regularly verify data accuracy and avoid duplicate entries.
2. Define Clear KPIs
Ensure every metric aligns with organizational goals.
3. Use Conditional Formatting
Highlight deviations from targets using colors and symbols.
4. Update Regularly
Schedule monthly updates to maintain relevance and reliability.
5. Protect Sensitive Data
Implement password protection for sheets containing confidential investment information.
6. Visualize Key Trends
Focus on charts that provide strategic insights — not just numbers.
7. Backup Data
Maintain historical versions to analyze long-term performance patterns.
🏁 Conclusion
The Sovereign Wealth Funds Dashboard in Excel is more than just a reporting tool — it’s a complete investment intelligence solution. It empowers sovereign fund managers, analysts, and financial administrators to track investments, evaluate risk, and improve decision-making with ease.
With interactive visuals, automated analytics, and a structured layout, this dashboard provides a 360° view of fund performance. Whether you manage billions or millions, this Excel template ensures transparency, accuracy, and insight — all within your control.
Click to Purchases Sovereign Wealth Funds Dashboard in Excel
❓ Frequently Asked Questions (FAQs)
1. What is the purpose of a Sovereign Wealth Funds Dashboard in Excel?
It helps visualize and analyze investment data, ensuring better financial decision-making and reporting accuracy.
2. Can this dashboard handle large datasets?
Yes. With efficient formula design and pivot tables, it can handle thousands of investment records smoothly.
3. Who should use this dashboard?
Fund managers, financial analysts, government agencies, and institutional investors benefit most from this tool.
4. Is this dashboard customizable?
Absolutely. You can modify charts, KPIs, and layouts to match specific fund structures or reporting requirements.
5. Can I connect this Excel dashboard to external data sources?
Yes. Using Power Query or Excel Data Connections, you can link it to SQL databases, CSV files, or APIs for automatic data refresh.
6. Does it require advanced Excel skills?
Not necessarily. The template is pre-built and intuitive. Basic Excel knowledge is enough to operate it.
7. How often should I update the data?
Ideally, update it monthly to ensure trend charts and performance summaries remain accurate.
8. What makes this dashboard unique?
Its design combines clarity, automation, and interactivity — offering the depth of BI tools at a fraction of the cost.
Click to Purchases Sovereign Wealth Funds Dashboard in Excel
Visit our YouTube channel to learn step-by-step video tutorials