The sporting goods industry moves fast. Trends change quickly. Customer demand shifts with seasons. Moreover, sales fluctuate during tournaments, holidays, and fitness campaigns. Therefore, sporting goods retailers, wholesalers, and manufacturers must track performance carefully.
However, many businesses still rely on scattered spreadsheets. As a result, they miss sales patterns. They fail to monitor inventory properly. They struggle to compare targets with actual results.
So, how can you monitor sales growth, inventory turnover, profit margin, seasonal demand, and performance trends in one structured system?
Click to buy Sporting Goods KPI Dashboard in Excel
You need a Sporting Goods KPI Dashboard in Excel.
In this comprehensive guide, you will learn:
- What a Sporting Goods KPI Dashboard in Excel is
- Why sporting goods businesses need it
- Detailed explanation of all 7 worksheets
- Important KPIs for sporting goods management
- Advantages of Sporting Goods KPI Dashboard in Excel
- Best Practices for the Sporting Goods KPI Dashboard
- Frequently Asked Questions with Answers
Let us explore everything step by step.
What Is a Sporting Goods KPI Dashboard in Excel?
A Sporting Goods KPI Dashboard in Excel is a ready-to-use performance tracking template designed specifically for sporting goods businesses.
It helps you:
- Track monthly and yearly performance
- Compare actual results with targets
- Analyze previous year performance
- Monitor MTD (Month-To-Date) and YTD (Year-To-Date) results
- Make faster and smarter business decisions
Moreover, this dashboard works fully in Excel. Therefore, you do not need any external software. You can customize it easily. You can scale it as your business grows.
In addition, the dashboard uses structured worksheets. Consequently, it keeps data clean and organized.
Why Do Sporting Goods Businesses Need a KPI Dashboard?
Sporting goods businesses operate in a dynamic market. For example, cricket equipment demand increases during tournaments. Similarly, gym equipment sales rise during fitness trends. Therefore, you must monitor performance continuously.
Without a dashboard:
- Managers rely on manual calculations
- Teams waste time preparing reports
- Decision-makers lack real-time visibility
- Businesses miss profit opportunities
On the other hand, a KPI dashboard:
- Shows performance clearly
- Highlights growth trends
- Identifies weak areas
- Supports strategic planning
Therefore, every sporting goods business should use a structured KPI dashboard.
What Are the 7 Worksheets in the Sporting Goods KPI Dashboard in Excel?
This dashboard includes 7 structured worksheets. Each sheet plays a specific role. Let us understand them in detail.
Summary Page – How Does It Help You Navigate Easily?
The Summary Page works as an index page.
Here, you will find:
- 6 navigation buttons
- Quick access to all worksheets
- Clean and simple design
Therefore, you can jump to any sheet instantly. This structure improves user experience. Moreover, it reduces confusion.

Click to buy Sporting Goods KPI Dashboard in Excel
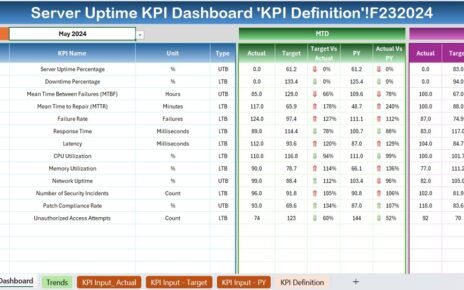
Dashboard Sheet Tab – How Does It Show Overall Performance?
The Dashboard Sheet acts as the main reporting page.
Key Features:
- Month selection drop-down in cell D3
- Automatic update of dashboard values
- MTD Actual, Target, and Previous Year comparison
- YTD Actual, Target, and Previous Year comparison
- Conditional formatting arrows (Up/Down indicators)
What Happens When You Change the Month?
When you select a month from D3:
- All numbers update automatically
- Charts reflect the selected month
- Performance indicators adjust instantly
Therefore, you can analyze any month within seconds.
Why Use Conditional Formatting?
Conditional arrows show:
- Green Up Arrow → Positive growth
- Red Down Arrow → Negative performance
As a result, managers can identify issues quickly.

Click to buy Sporting Goods KPI Dashboard in Excel
Trend Sheet Tab – How Can You Analyze KPI Trends?
The Trend Sheet provides deep KPI analysis.
In cell C3, you can select the KPI name from a drop-down.
What Information Does It Show?
- KPI Group
- KPI Unit
- KPI Type (Lower the Better / Upper the Better)
- KPI Formula
- KPI Definition
Moreover, it shows:
- MTD Trend Chart (Actual, Target, PY)
- YTD Trend Chart (Actual, Target, PY)
Therefore, you can analyze growth patterns month by month.
For example:
If Sales Revenue increases steadily, you can identify consistent growth.
However, if Inventory Holding Days increase, you can detect slow-moving stock.

Actual Numbers Input Sheet – Where Do You Enter Data?
This sheet captures actual performance data.
How Does It Work?
- Enter the first month of the year in cell E1
- Input MTD and YTD actual values
- Update numbers monthly
Because this sheet stores raw data, it drives the entire dashboard.
Therefore, accurate data entry becomes critical.

Click to buy Sporting Goods KPI Dashboard in Excel
Target Sheet Tab – How Do You Set Performance Goals?
In this sheet, you enter:
- Monthly MTD Targets
- Monthly YTD Targets
Managers set targets based on:
- Sales forecasts
- Seasonal demand
- Marketing campaigns
- Business expansion plans
Once you enter targets, the dashboard compares them automatically.

Click to buy Sporting Goods KPI Dashboard in Excel
Previous Year Number Sheet – Why Compare Historical Data?
This sheet stores last year’s data.
By entering previous year numbers:
- You track growth percentage
- You analyze seasonal patterns
- You evaluate year-over-year improvement
For example:
If Basketball Sales grew from ₹5,00,000 last year to ₹6,50,000 this year, you clearly see 30% growth.
Therefore, historical comparison supports strategic planning.

KPI Definition Sheet – Why Is It Important?
This sheet stores:
- KPI Name
- KPI Group
- Unit
- Formula
- Definition
Because every KPI has a clear formula and definition, confusion reduces.
Moreover, new team members understand metrics quickly.

Click to buy Sporting Goods KPI Dashboard in Excel
Which KPIs Should You Track in a Sporting Goods KPI Dashboard?
Let us explore important KPIs.
Sales KPIs
- Total Sales Revenue
- Gross Profit Margin (%)
- Net Profit Margin (%)
- Sales Growth Rate (%)
Inventory KPIs
- Inventory Turnover Ratio
- Stock Holding Days
- Slow-Moving Inventory (%)
- Stock-Out Rate (%)
Customer KPIs
- Customer Retention Rate (%)
- Average Order Value
- Repeat Purchase Rate (%)
Operational KPIs
- Order Fulfillment Time
- Return Rate (%)
- Supplier Lead Time
These KPIs help you monitor complete business performance.
Advantages of Sporting Goods KPI Dashboard in Excel
Using this dashboard provides multiple benefits.
Centralized Data Management
You store everything in one Excel file. Therefore, you avoid scattered reports.
Real-Time Analysis
Once you update numbers, dashboard values change instantly.
Better Decision Making
Because you compare Actual vs Target vs Previous Year, you make informed decisions.
Improved Accountability
Teams see performance clearly. Therefore, they focus on targets.
Easy Customization
You can:
- Add new KPIs
- Modify formulas
- Adjust charts
- Change design
Cost-Effective Solution
Excel does not require expensive software. Therefore, small businesses benefit greatly.
Best Practices for the Sporting Goods KPI Dashboard
To get the best results, follow these practices:
Update Data Regularly
Enter MTD data monthly. Avoid delays.
Keep KPI Definitions Clear
Define formulas properly. Avoid confusion.
Use Consistent Units
Do not mix percentages and currency formats incorrectly.
Focus on Actionable KPIs
Track KPIs that drive decisions. Avoid unnecessary metrics.
Review Trends Monthly
Do not only see one month. Always analyze trends.
Protect Formula Cells
Lock calculation cells to prevent accidental changes.
How Can You Use This Dashboard for Strategic Growth?
You can use this dashboard to:
- Identify best-selling product categories
- Detect underperforming sports segments
- Optimize inventory planning
- Improve marketing strategies
- Monitor seasonal demand
For example:
If Cricket Bat sales spike before tournaments, you can increase stock early.
Similarly, if Gym Equipment demand drops, you can run discount campaigns.
Therefore, the dashboard supports proactive planning.
How Does MTD and YTD Analysis Improve Performance Tracking?
MTD shows short-term performance.
YTD shows long-term growth.
For example:
If January MTD looks weak, you adjust marketing quickly.
However, if YTD growth remains strong, you stay confident.
Therefore, combining MTD and YTD gives balanced insight.
Why Does Conditional Formatting Matter?
Visual indicators reduce analysis time.
Instead of reading numbers:
- Green arrow shows improvement
- Red arrow shows decline
Therefore, managers understand performance within seconds.
How Can Sporting Goods Retailers Benefit Specifically?
Retailers can:
- Monitor store-wise sales
- Track product category performance
- Measure seasonal demand
- Analyze discount impact
As a result, they increase profitability.
How Can Manufacturers Use This Dashboard?
Manufacturers can:
- Track production efficiency
- Monitor supplier performance
- Compare regional demand
- Improve distribution planning
Therefore, both retailers and manufacturers benefit.
Conclusion
The Sporting Goods KPI Dashboard in Excel provides a structured and powerful solution for performance tracking.
It includes 7 well-designed worksheets. It allows month selection. It compares Actual, Target, and Previous Year numbers. It displays MTD and YTD analysis. Moreover, it uses conditional formatting for instant insights.
Therefore, sporting goods businesses can:
- Improve sales strategy
- Control inventory
- Increase profitability
- Strengthen decision-making
If you want organized reporting, clear performance visibility, and faster business decisions, this dashboard gives you exactly what you need.
Frequently Asked Questions (FAQs)
What is a Sporting Goods KPI Dashboard in Excel?
It is a ready-to-use Excel template that tracks sales, inventory, and performance metrics for sporting goods businesses.
Can I customize the KPIs?
Yes. You can modify KPI names, formulas, and groups in the KPI Definition sheet.
Do I need advanced Excel skills?
No. Basic Excel knowledge works. However, advanced users can customize further.
How often should I update the dashboard?
You should update it monthly. However, you can also update it weekly if required.
Can small sporting goods stores use this dashboard?
Yes. Small, medium, and large businesses can use it.
Does the dashboard support year-over-year comparison?
Yes. It compares current year data with previous year numbers automatically.
Why should I use Excel instead of other tools?
Excel offers flexibility, low cost, and easy customization. Therefore, many businesses prefer it.
Visit our YouTube channel to learn step-by-step video tutorials
Watch the step-by-step video tutorial:
Click to buy Sporting Goods KPI Dashboard in Excel