Sportswear retail chains operate in a fast-moving environment where customer preferences change quickly, competition continues to grow, and margins stay tight. To stay ahead, retail chains must track sales performance, analyze customer behavior, monitor store-wise performance, and improve product category planning. When this information sits across multiple spreadsheets or systems, teams struggle to understand performance clearly.
A Sportswear Chains Dashboard in Excel solves this challenge. It gives retailers a structured and visual way to track sales, cost, profit margins, store performance, brand analytics, and monthly trends—all in one place. Because the dashboard uses Excel, you can update data easily, analyze insights instantly, and manage operations faster.
This detailed article explains everything about the dashboard—its pages, features, benefits, best practices, and answers to common questions.
Click to Purchases Sportswear Chains Dashboard in Excel
What Is a Sportswear Chains Dashboard in Excel?
A Sportswear Chains Dashboard in Excel is a ready-to-use reporting template designed for retail chains that sell athletic wear, footwear, sports accessories, and related merchandise. It provides a complete performance analysis across multiple stores, product categories, and brands.
This dashboard helps retailers track:
-
Total sales
-
Cost and profit
-
Profit margin %
-
Return order %
-
Quantity sold
-
Store-wise performance
-
City-wise trends
-
Brand-wise contribution
-
Product category insights
-
Monthly performance changes
Using Excel makes this dashboard easy to update, simple to navigate, and convenient for teams who do not use advanced BI tools.
Click to Purchases Sportswear Chains Dashboard in Excel
Why Do Sportswear Retail Chains Need a Dashboard?
Sportswear chains generate daily data from stores, online sales, returns, payments, and customer interactions. Without a proper dashboard:
-
You lose track of store-wise performance.
-
You cannot compare brands or categories effectively.
-
You miss monthly profit trends.
-
You struggle to measure return rate impact.
-
You fail to understand customer buying behavior.
-
You spend hours preparing manual reports.
However, when you use a dashboard:
-
You see real-time sales patterns.
-
You understand margin performance.
-
You analyze store and brand contribution.
-
You discover which product categories drive profit.
-
You track returns and payment mode cost quickly.
The result is better decisions, faster insights, and stronger business growth.
Click to Purchases Sportswear Chains Dashboard in Excel
Key Features of the Sportswear Chains Dashboard in Excel
This dashboard contains five analytical pages, along with supporting sheets. It also includes a Page Navigator on the left side, allowing easy movement across pages.
Let’s explore each page and its insights.
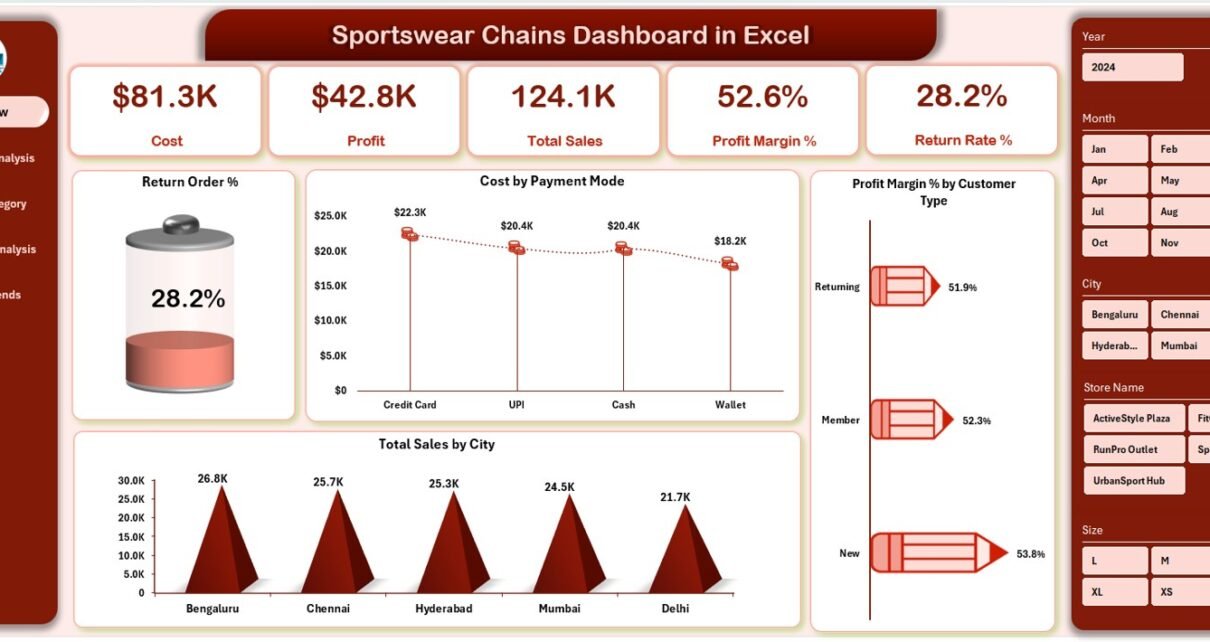
1. Overview Page – The Main Dashboard View

The Overview Page presents the most important KPIs and charts that describe the health of the business.
✔ This page includes 5 KPI Cards:
These cards may include indicators such as:
-
Total Sales
-
Total Profit
-
Profit Margin %
-
Total Quantity Sold
-
Return Order %
These cards help retail leaders understand overall business performance immediately.
✔ The page includes 4 powerful charts:
1. Return Order %
Shows how many orders were returned and helps identify quality or customer expectations issues.
2. Cost by Payment Mode
Analyzes how different payment sources contribute to transaction cost.
3. Total Sales by City
Shows which cities contribute the most revenue.
4. Profit Margin % by Customer Type
Identifies which customer segments are most profitable.
This page is ideal for CEOs, retail managers, and financial teams who want a quick summary of store-wide performance.
Click to Purchases Sportswear Chains Dashboard in Excel
2. Store Name Analysis Page – Compare Store-Wise Performance

This page gives deep insights into the performance of each store in the sportswear chain.
✔ It contains 4 store-specific charts:
1. Total Orders by Store Name
Shows which stores generate the highest order volume.
2. Profit by Store Name
Helps identify high-performing and low-performing stores.
3. Cost by Store Name
Shows cost distribution across stores.
4. Return Rate % by Store Name
Helps track stores with high return rates, indicating possible quality or service issues.
This page is extremely useful for regional managers and store supervisors.
Click to Purchases Sportswear Chains Dashboard in Excel
3. Product Category Analysis Page – Analyze Category Performance

Product categories play a major role in sportswear retail—footwear, apparel, fitness accessories, team sports, outdoor gear, etc.
✔ This page includes 4 category-focused charts:
1. Profit by Product Category
Shows which categories generate the highest profit.
2. Cost by Product Category
Tracks category-wise cost structure.
3. Profit Margin % by Product Category
Helps identify high-margin and low-margin categories.
4. Quantity Sold by Product Category
Shows customer demand patterns.
This page helps merchandise planners and category managers enhance inventory and pricing decisions.
4. Brand Name Analysis Page – Understand Brand Contribution

Sportswear retail chains carry multiple international and domestic brands.
This page includes 4 major charts:
✔ 1. Total Sales by Brand Name
Shows which brands drive the most revenue.
✔ 2. Cost by Brand Name
Helps track expenditure on each brand.
✔ 3. Profit by Brand Name
Helps compare brand profitability.
✔ 4. Profit Margin % by Brand Name
Shows which brands deliver higher returns.
This page helps marketing, buying teams, and brand managers evaluate brand performance.
Click to Purchases Sportswear Chains Dashboard in Excel
5. Monthly Trends Page – Track Performance Month-by-Month

This page reveals how the business performs throughout the year.
It includes 3 charts:
✔ 1. Profit by Month
Shows seasonal profit patterns.
✔ 2. Quantity Sold by Month
Helps track sales demand across months.
✔ 3. Profit Margin % by Month
Shows how margin performance changes over time.
This helps retail planners prepare promotions, discounts, and inventory based on sales cycles.
Support Sheet and Data Sheet
✔ Support Sheet
Used for dropdowns, slicers, and structured references.
✔ Data Sheet
Stores raw sales, cost, quantity, return, customer, store, and category information.
This sheet acts as the backend data source for all dashboards.
Click to Purchases Sportswear Chains Dashboard in Excel
Advantages of the Sportswear Chains Dashboard in Excel
1. You get all retail insights in one place
Store, category, brand, and monthly insights appear in one dashboard.
2. You improve decision-making
Leaders can make better pricing, inventory, and discount decisions.
3. You track high-performing stores and categories
This improves resource allocation and planning.
4. You control return rate %
High returns affect profit. Tracking them helps reduce losses.
5. You enhance brand strategy
Brand-wise profit and margin help you negotiate better with vendors.
6. You monitor customer behavior
Customer type margin insights help in targeted promotions.
7. You identify monthly patterns
This helps prepare for peak and slow seasons.
8. You reduce manual reporting
Excel automation allows faster updates with minimal effort.
Click to Purchases Sportswear Chains Dashboard in Excel
Best Practices for Using the Sportswear Chains Dashboard
1. Update data regularly
Daily or weekly updates improve dashboard accuracy.
2. Validate data before uploading
Clean data ensures correct analysis.
3. Track return rates weekly
High returns indicate quality or service issues.
4. Compare profit margin % across brands
This strengthens negotiation and sourcing decisions.
5. Use city-wise analysis for store expansions
Understand which cities show strong growth potential.
6. Use category trends for inventory planning
Helps improve stock availability and reduce dead inventory.
7. Train teams to use slicers and filters
Better dashboard usage leads to better results.
8. Monitor monthly trends for better forecasting
Seasonal insights help shape marketing and pricing strategies.
Conclusion
A Sportswear Chains Dashboard in Excel is an essential tool for retail chains looking to improve sales, optimize inventory, understand customer behavior, and increase profit margins. With its five powerful pages—Overview, Store Name Analysis, Product Category Analysis, Brand Name Analysis, and Monthly Trends—it gives complete visibility into all major KPIs.
Retailers who use this dashboard regularly gain deeper insights, make smarter decisions, and improve both revenue and profitability.
Click to Purchases Sportswear Chains Dashboard in Excel
Frequently Asked Questions (FAQs)
1. Who should use the Sportswear Chains Dashboard?
Retail managers, store managers, category planners, brand managers, and finance teams.
2. Do I need advanced Excel knowledge?
No. Basic Excel skills are enough to use the dashboard.
3. Can I add more categories or brands?
Yes. You can update the Data Sheet and add new items.
4. Does the dashboard show profitability?
Yes. Profit and profit margin % appear across all pages.
5. Can I use this dashboard for multiple stores?
Yes. It includes store-wise and city-wise analysis.
6. How often should I update the data?
Weekly or monthly updates provide accurate insights.
7. Can I customize the charts?
Yes. Excel allows full customization.
8. Will this dashboard help reduce returns?
Yes. Return rate % analysis helps detect root causes.
Click to Purchases Sportswear Chains Dashboard in Excel
Visit our YouTube channel to learn step-by-step video tutorials