Startup Burn Rate Dashboard in Excel is a professionally designed, pivot-powered analytics template that gives startup founders, CFOs, and finance teams complete visibility into cash burn, revenue performance, expense breakdown, department-level spending, runway trends, and growth metrics — all from one dynamic Excel workbook. This Excel dashboard template includes 5 interactive analysis pages plus a Data Sheet and Support Sheet, tracking 4 key performance indicators including Total Burn, Total Revenue, Net Burn Amount, and Avg. Cash Balance. Whether you are running a seed-stage company or preparing a board deck for your Series B, this dashboard delivers instant clarity on where your money is going and how long your runway will last.
Managing startup finances is one of the most critical challenges founders face. Without clear visibility into burn rate patterns, expense categories, and department-level costs, startups risk running out of cash before achieving product-market fit. This Startup Burn Rate Dashboard in Excel solves that problem by putting all your key financial metrics into one interactive, pivot-driven workbook that updates automatically when you refresh your data. Explore more Excel Dashboard Templates for every business need.
Key Features of Startup Burn Rate Dashboard in Excel
This dashboard includes 5 interactive analysis pages, 4 high-level KPI cards, dynamic pivot-powered charts with interactive slicers, budget vs actual variance analysis, department-level burn tracking, cash runway forecasting, and growth metrics monitoring. It is 100% formula and pivot-table driven with no VBA or macros required, and works on Excel 2016 and later including Microsoft 365. The dashboard tracks Total Burn, Total Revenue, Net Burn Amount, and Avg. Cash Balance across multiple dimensions including region, expense category, department, funding stage, status, and month.
Dashboard Pages Explanation
1 — Overview Page
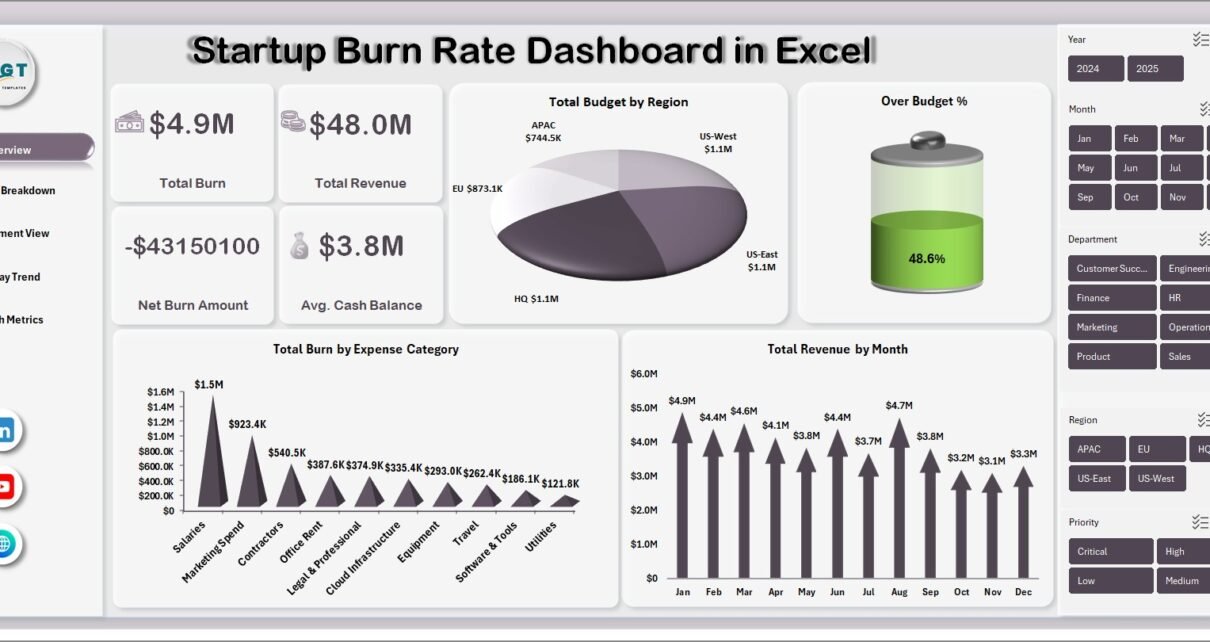
The Overview page is your startup’s financial command center. At the top, four high-level KPI cards display Total Burn, Total Revenue, Net Burn Amount, and Avg. Cash Balance — giving you an instant pulse check on your startup’s financial health. Below the cards, interactive charts show Total Budget by Region highlighting regional spending patterns, Over Budget % identifying areas where spending exceeds planned budgets, Total Burn by Expense Category revealing which categories consume the most cash, and Total Revenue by Month tracking your income trajectory over time. Multiple slicers let you filter the entire dashboard by region, expense category, department, funding stage, and more with a single click.
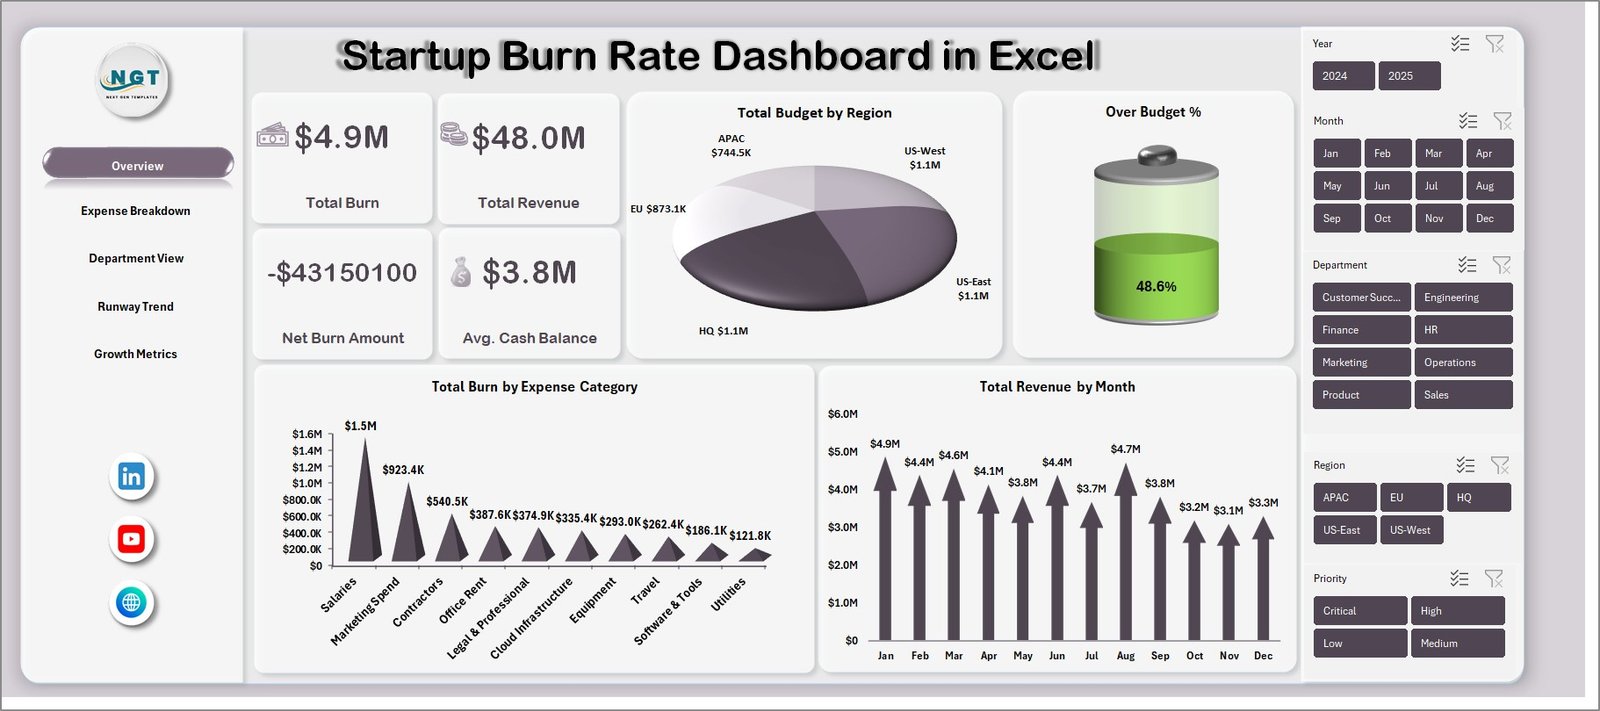
Startup Burn Rate Dashboard in Excel
2 — Expense Breakdown
The Expense Breakdown page provides a deep dive into where your startup’s money is being spent. It includes Total Budget Vs Total Burn by Expense Category comparing planned budgets against actual spending for each expense line, Budget Variance % by Expense Category showing which categories are over or under budget as a percentage, and Total Burn by Priority helping you understand whether high-priority or low-priority items are consuming the most resources. This page is essential for identifying overspending patterns and making informed decisions about where to cut costs or reallocate budget.
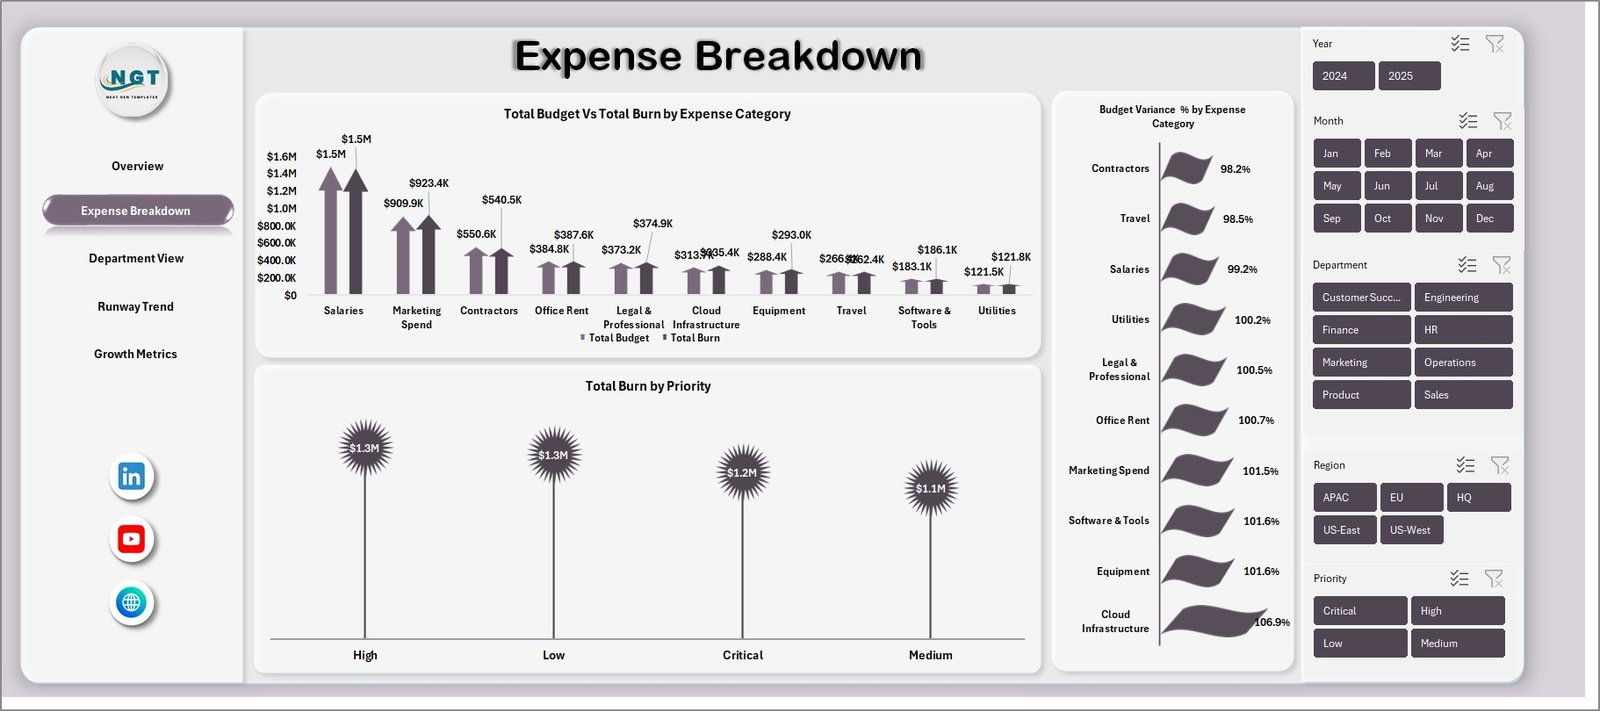
Expense Breakdown
3 — Department View
The Department View page breaks down your startup’s spending by organizational unit. It features Total Burn by Department showing which teams consume the most cash, Avg. Headcount by Department helping you understand cost per employee across teams, Over Budget % by Department identifying departments that are exceeding their allocated budgets, and Total Revenue by Department revealing which teams contribute the most to revenue generation. This page is invaluable for department heads and CFOs who need to evaluate spending efficiency and headcount cost allocation across the organization.
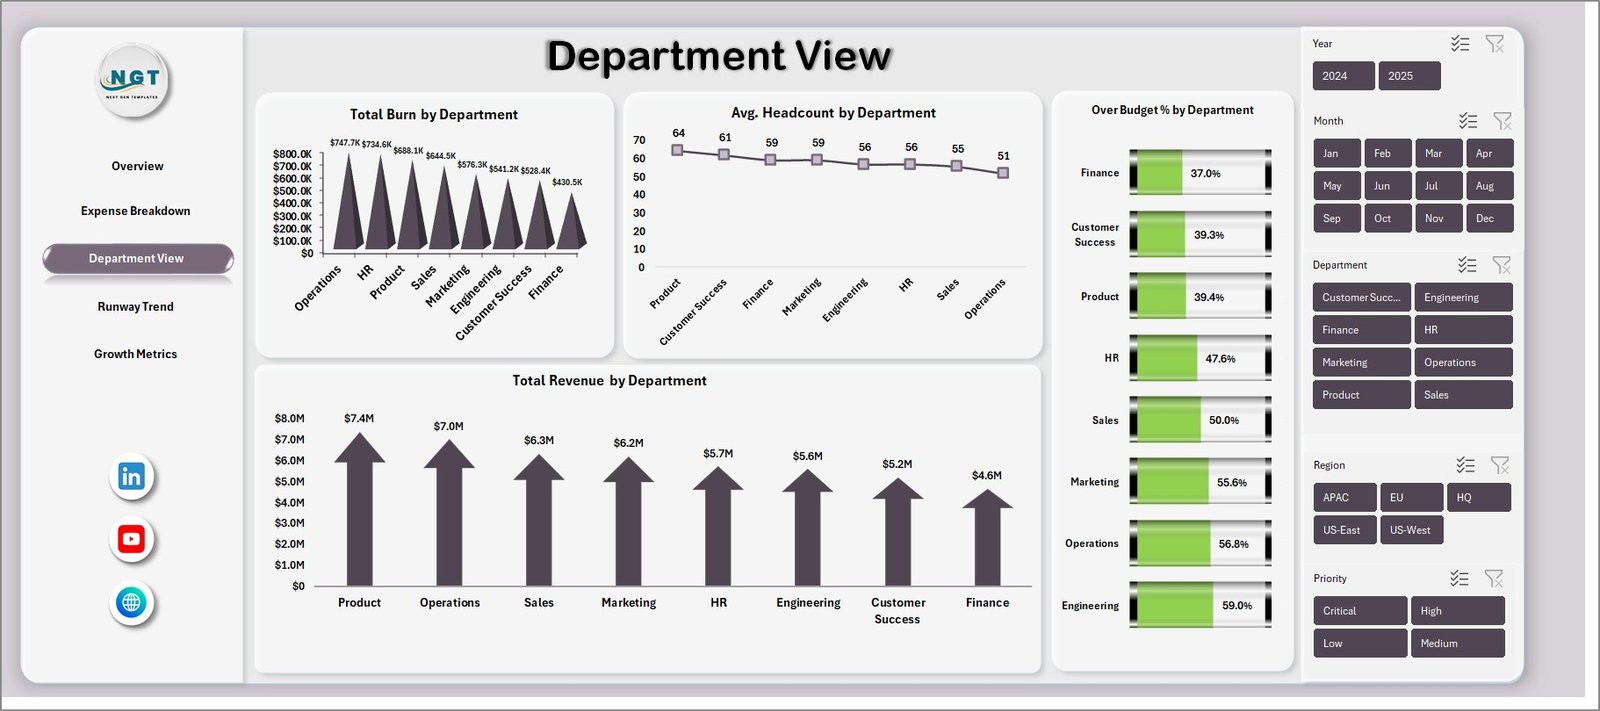
Department View
4 — Runway Trend
The Runway Trend page provides forward-looking financial analytics that help you forecast your startup’s cash runway. It includes Avg. Cash Balance by Month tracking how your cash reserves change over time, Total Churn by Month monitoring customer or revenue churn patterns, Total Burn Vs Total Revenue by Month comparing your monthly outflow against income to spot when you might reach profitability, and Total MRR by Month tracking your monthly recurring revenue growth trajectory. This page is critical for board presentations, investor updates, and internal financial planning.
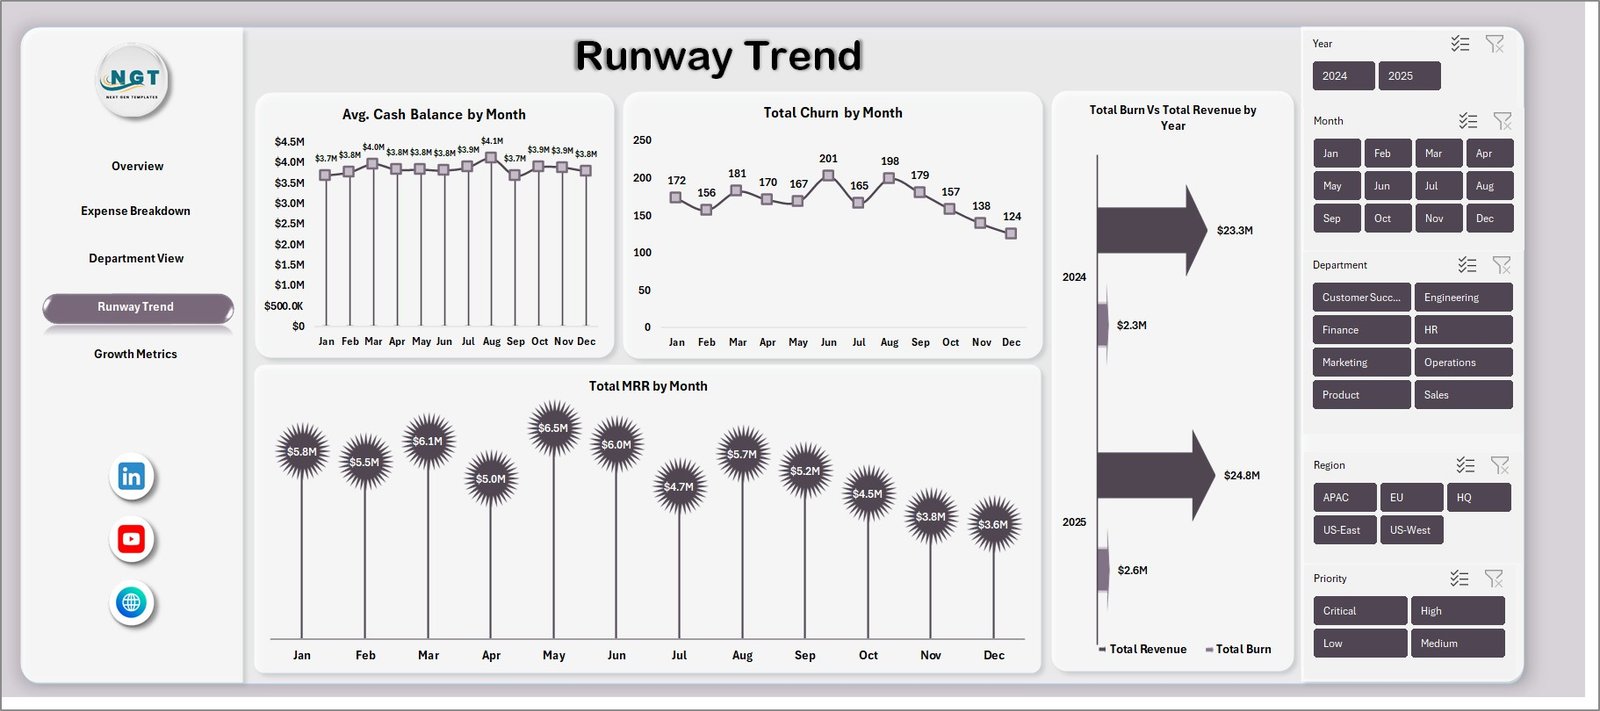
Runway Trend
5 — Growth Metrics
The Growth Metrics page focuses on your startup’s growth trajectory and customer acquisition performance. It visualizes Total New Customers by Month showing your customer acquisition pace, Total MRR by Funding Stage comparing recurring revenue across seed, Series A, Series B, and other stages, Total Records by Status breaking down your records by their current operational status, and Total Revenue by Region revealing geographic revenue distribution patterns. This page helps founders and investors evaluate whether the startup is growing fast enough to justify its burn rate.
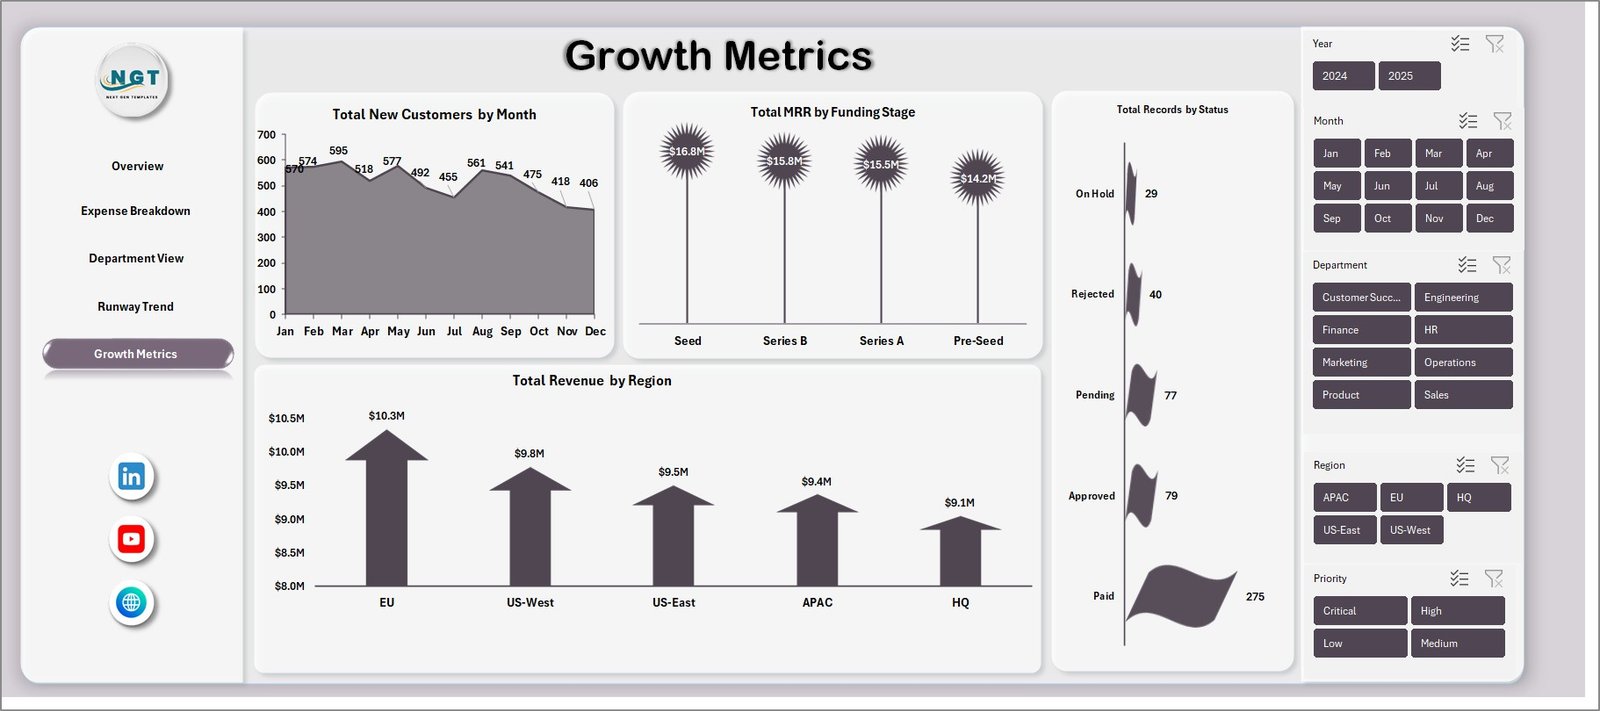
Growth Metrics
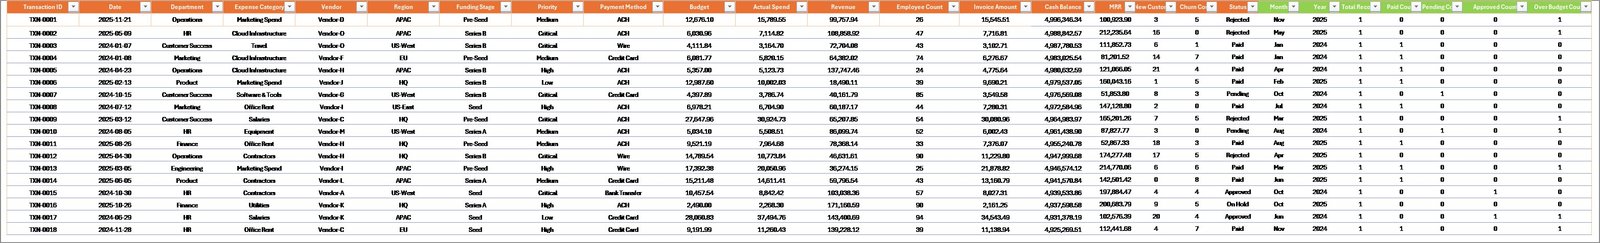
6 — Data Sheet
This is the Data Sheet where you enter your startup financial records. Simply add your data in the same column format as the sample data provided. The dashboard comes pre-loaded with realistic sample data so you can explore all features immediately. When you are ready, replace the sample data with your own startup records and the entire dashboard updates automatically.

7 — Support Sheet
The Support Sheet contains multiple pivot tables that power the entire dashboard dynamically. After updating your data in the Data Sheet, simply go to the Data tab in the Excel Ribbon and click Refresh All — every pivot table will refresh and all charts across all 5 dashboard pages will update automatically. You can keep this sheet hidden during normal use and presentations.
Support Sheet Tab
Advantages of Startup Burn Rate Dashboard in Excel
This dashboard consolidates all critical startup financial metrics into one workbook, eliminating the need for multiple spreadsheets or expensive BI tools. The pivot-table architecture ensures that all charts and KPIs update automatically with a single Refresh All click. Interactive slicers allow stakeholders to filter data across multiple dimensions without modifying any formulas. The budget vs actual variance analysis on the Expense Breakdown page provides immediate visibility into overspending areas. The Runway Trend page gives founders and investors a clear picture of cash runway and MRR trajectory, which are essential for fundraising conversations and board presentations.
Opportunities for Improvement
Users with advanced Excel skills could enhance this dashboard by adding conditional formatting rules to highlight KPI cards that fall below target thresholds. The Growth Metrics page could be extended with cohort analysis charts to track customer retention over time. For startups with multiple product lines, additional pivot fields could be added to segment burn rate and revenue by product. Integration with external data sources through Power Query could automate data refresh from accounting software like QuickBooks or Xero.
Best Practices
Update your data in the Data Sheet at least monthly to maintain accurate runway projections. Always click Refresh All after adding new data to ensure all pivot tables and charts reflect the latest numbers. Use the slicers on the Overview page to present filtered views during board meetings — for example, filter by a specific department to discuss its burn rate with the department head. Compare your Budget Variance % monthly to catch overspending trends early. Use the Runway Trend page during investor meetings to demonstrate your path to profitability or justify the need for additional funding.
Explore Relevant Templates
Startup Burn Rate Dashboard in HTML — The same burn rate analytics in a browser-based interactive HTML dashboard with no software installation required.
Subscription Business Dashboard in HTML — Track MRR, churn, ARPU, and subscriber growth for SaaS and subscription businesses.
SaaS Financial Model Dashboard in HTML — Complete financial modeling template for SaaS companies with revenue projections and burn rate tracking.
Browse all Excel Dashboard Templates for more business intelligence solutions.
Frequently Asked Questions
What KPIs does the Startup Burn Rate Dashboard in Excel track?
The Startup Burn Rate Dashboard in Excel tracks 4 key performance indicators on the Overview page: Total Burn, Total Revenue, Net Burn Amount, and Avg. Cash Balance. Additional analysis across 4 more pages covers expense breakdown by category, department-level burn, monthly runway trends, MRR tracking, and customer growth metrics across 5 interactive dashboard pages.
Do I need advanced Excel skills to use this burn rate dashboard?
No. Simply replace the sample data in the Data Sheet tab with your own startup records and click Refresh All in the Data tab. All pivot tables and charts update automatically — no formulas to edit or macros to enable.
Can I track budget vs actual spending with this dashboard?
Yes. The Expense Breakdown page includes Total Budget Vs Total Burn by Expense Category and Budget Variance % by Expense Category charts, letting you instantly identify which spending areas exceed their allocated budgets.
How do I forecast my startup’s cash runway using this dashboard?
The Runway Trend page shows Avg. Cash Balance by Month and Total Burn Vs Total Revenue by Month, giving you a clear picture of how long your current cash reserves will last based on your historical burn pattern and revenue trajectory.
What is the best Excel template for tracking startup burn rate and expenses?
The Startup Burn Rate Dashboard in Excel from NextGenTemplates is one of the most comprehensive options available, featuring 5 dedicated analysis pages, KPI cards, budget variance analysis, runway forecasting, department-level burn tracking, and growth metrics — all pivot-powered with interactive slicers and automatic refresh.
Is this dashboard compatible with Microsoft 365?
Yes. This template works with Microsoft Excel 2016 and later versions, including Microsoft 365. It uses standard pivot tables and charts with no VBA or macros required.
Conclusion
The Startup Burn Rate Dashboard in Excel is the ultimate financial analytics tool for startups that need clear, actionable insights into their cash burn, revenue trends, expense patterns, and growth trajectory. With 5 interactive dashboard pages, 4 KPI cards, budget variance analysis, department-level tracking, runway forecasting, and growth metrics, this template covers every critical dimension of startup financial management. Download it today and take full control of your startup’s financial health.
Click here to Purchase Startup Burn Rate Dashboard in Excel
Visit our YouTube channel for step-by-step video tutorials: Youtube.com/@PK-AnExcelExpert
Explore more Excel and Power BI tutorials on our blog: www.pk-anexcelexpert.com