Managing performance in the steel and metals industry requires accurate data, real-time visibility, and actionable insights. Whether it’s production efficiency, quality control, or supply chain performance, every decision depends on numbers. That’s where the Steel & Metals KPI Dashboard in Power BI comes in — a powerful, ready-to-use tool that transforms raw data into meaningful visuals for smarter decision-making.
This dashboard offers an all-in-one view of your organization’s key performance indicators (KPIs). Built in Power BI and powered by structured Excel data, it allows you to monitor targets, track trends, and compare results across months, years, and business units — all within a single, interactive interface.
In this comprehensive guide, we’ll explore everything you need to know about this dashboard: its structure, features, advantages, and best practices for effective usage.
Click to Purchases Steel & Metals KPI Dashboard in Power BI
🔍 What Is a Steel & Metals KPI Dashboard in Power BI?
A Steel & Metals KPI Dashboard in Power BI is a business intelligence solution designed to track and analyze performance across all major processes in the steel and metals sector. It combines data from production, operations, quality, procurement, and logistics into one centralized visual workspace.
Instead of manually analyzing spreadsheets, managers can view live performance insights in Power BI — with color-coded indicators, slicers for filtering, and trend charts for performance comparisons.
🎯 Core Objective
The main goal of this dashboard is to simplify performance tracking by:
-
Consolidating KPI data in one place
-
Providing real-time visualization through Power BI
-
Enabling data-driven decisions with instant comparison between actual and target performance
🧭 Structure of the Steel & Metals KPI Dashboard
The Power BI file of this dashboard contains three interactive pages:
-
Summary Page
-
KPI Trend Page
-
KPI Definition Page
Each page serves a distinct analytical purpose and provides both a top-level and detailed view of performance.
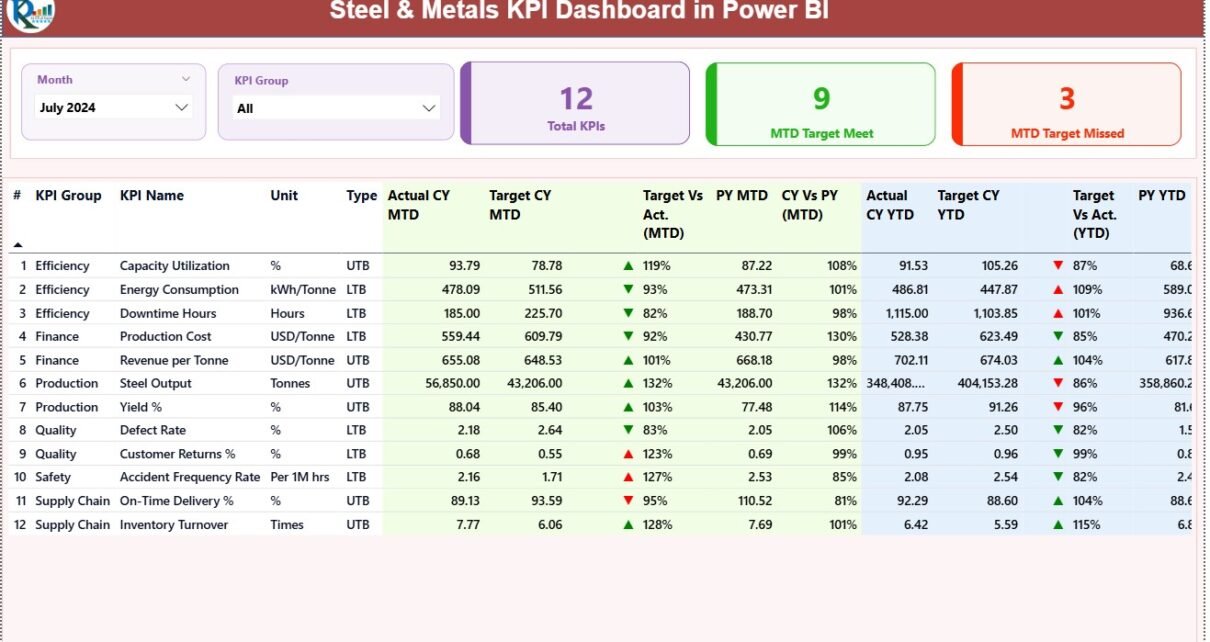
📊 1. Summary Page – The Main Control Center
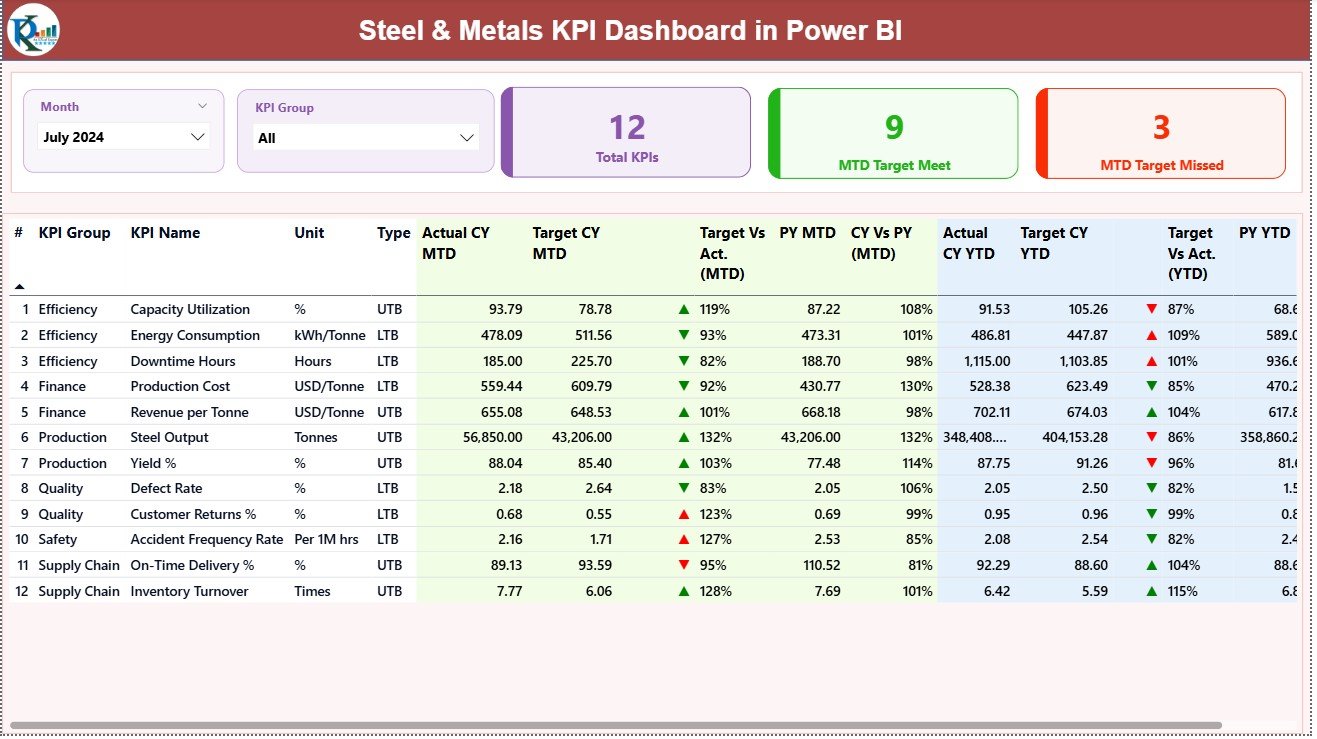
The Summary Page is the heart of the Steel & Metals KPI Dashboard. It provides an overall snapshot of the organization’s performance, highlighting both achievements and gaps in real time.
🔹 Key Visuals and Filters
At the top, you’ll find:
-
Month Selector: Choose the reporting month to view KPIs dynamically.
-
KPI Group Slicer: Filter KPIs by categories such as Production, Quality, Safety, Energy Efficiency, or Supply Chain.
🔹 Performance Cards
Just below the slicers, there are three high-impact cards that summarize the most important metrics:
-
Total KPI Count – Displays the total number of KPIs being tracked.
-
MTD Target Met Count – Shows how many KPIs achieved or exceeded their monthly targets.
-
MTD Target Missed Count – Indicates the number of KPIs falling short of monthly targets.
These cards give you an immediate understanding of where the organization stands.
📈 2. KPI Trend Page – Analyzing Progress Over Time
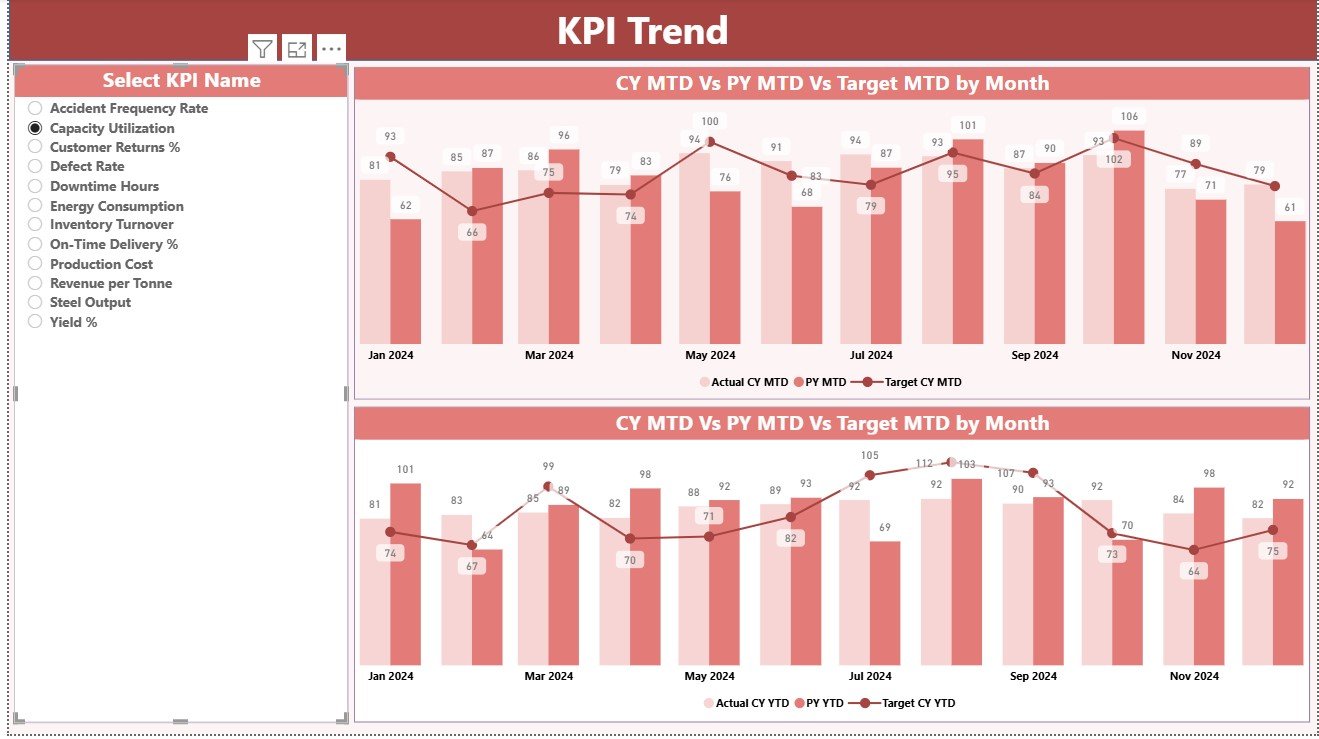
The KPI Trend Page provides a visual representation of performance trends. It enables managers and analysts to spot patterns, monitor seasonality, and evaluate progress toward strategic goals.
🔹 Layout and Interactivity
-
Slicer: A dynamic dropdown to select any KPI by name.
-
Two Combo Charts:
-
MTD Chart: Displays actual vs. target values for the current and previous year.
-
YTD Chart: Compares cumulative performance across the same parameters.
-
These charts help decision-makers understand not just where performance stands today, but how it has evolved over time.
🔹 Insights You Can Derive
-
Identify KPIs consistently performing above or below targets.
-
Recognize months where performance fluctuated sharply.
-
Detect long-term trends in quality, production, or cost metrics.
This page transforms static data into actionable intelligence through visual storytelling.
📘 3. KPI Definition Page – The Knowledge Base
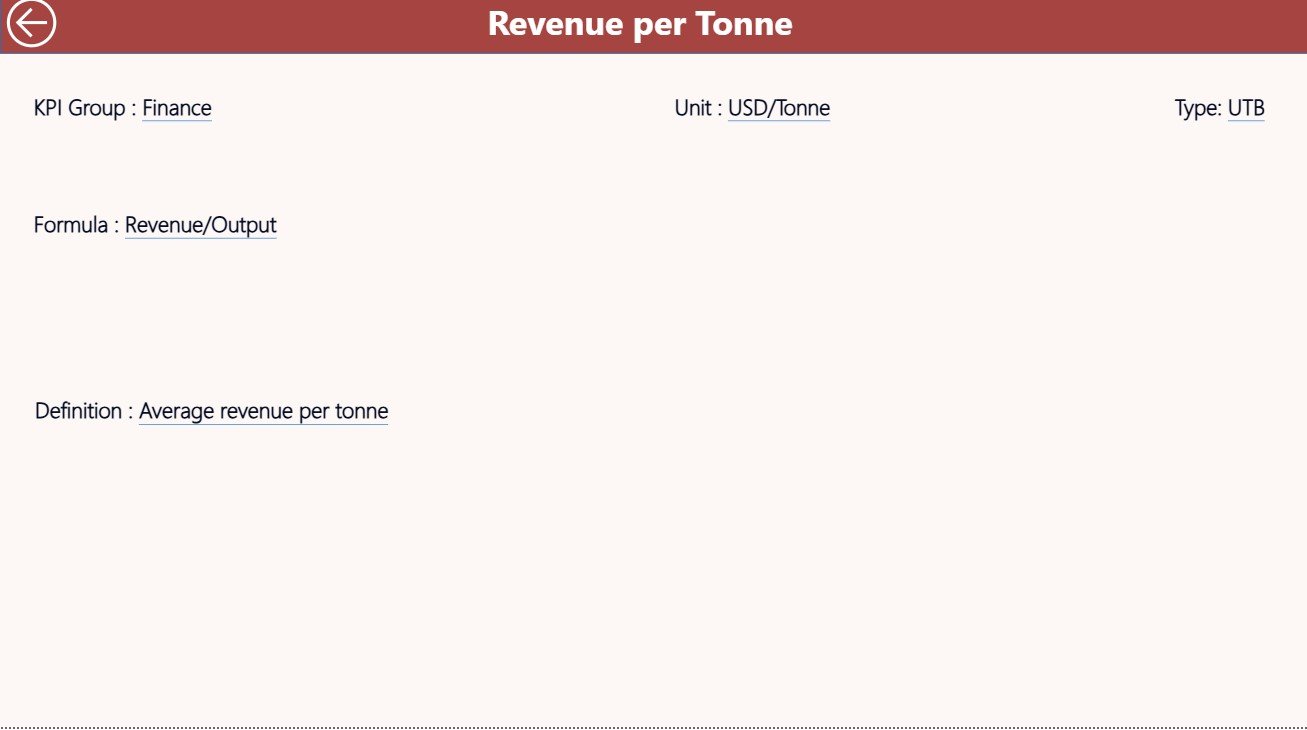
The KPI Definition Page is a drill-through page, meaning users can right-click a KPI on the summary table and view its details.
Although hidden from the main navigation, it is one of the most valuable pages in the dashboard.
🔹 Key Information Displayed
-
KPI Formula: Defines how each metric is calculated (e.g., Output ÷ Planned Capacity).
-
KPI Definition: Describes the meaning and relevance of the metric.
-
Unit and Type: Indicates measurement unit and whether higher or lower values are preferable.
By centralizing this information, the dashboard ensures transparency and standardization across departments. Users can clearly understand what each KPI measures and how performance is calculated.
Click to Purchases Steel & Metals KPI Dashboard in Power BI
🔹 Navigation
At the top-left corner, a Back Button lets users return to the summary page instantly.
📂 Excel Data Source and Input Sheets
The Steel & Metals KPI Dashboard relies on a structured Excel file as its primary data source. This file has three input worksheets, each playing a crucial role in maintaining accurate and up-to-date information.
1️⃣ Input_Actual Sheet
This sheet captures actual performance numbers for each KPI.
-
Columns include: KPI Name, Month (use the first date of the month), MTD, and YTD.
-
Data should be updated regularly to reflect current results.
2️⃣ Input_Target Sheet
This sheet holds target performance values for each KPI.
-
Columns are similar to the Actual sheet: KPI Name, Month, MTD, and YTD.
-
Comparing these numbers with the Actual sheet helps Power BI compute achievement rates.
3️⃣ KPI Definition Sheet
This sheet stores the meta-information for all KPIs, including:
-
KPI Number
-
KPI Group
-
KPI Name
-
Unit
-
Formula
-
Definition
-
Type (LTB or UTB)
Together, these sheets feed Power BI with clean, structured data, ensuring the dashboard updates accurately every time new data is imported.
⚙️ How the Dashboard Works
The process is straightforward:
-
Update KPI data in Excel.
-
Refresh the Power BI dashboard.
-
View real-time metrics, charts, and performance indicators.
This setup minimizes manual calculations and ensures consistent, accurate reporting across all departments.
🌟 Advantages of Steel & Metals KPI Dashboard in Power BI
Implementing this dashboard provides measurable benefits for steel and metals companies.
💡 Key Advantages
-
Centralized Performance Tracking: All KPIs are monitored from a single dashboard.
-
Real-Time Insights: Power BI automatically updates visuals as new data is imported.
-
Better Decision-Making: Managers can focus on data-driven strategies rather than manual reporting.
-
Error Reduction: Automated calculations minimize manual entry mistakes.
-
Transparency Across Teams: Everyone accesses the same standardized data source.
-
Historical Comparison: Month-to-Month and Year-to-Year comparisons reveal performance trends.
-
Visual Indicators: Color codes and icons make it easy to interpret data instantly.
-
Time Efficiency: Significant reduction in report generation time.
🏭 Example Use Cases in the Steel & Metals Industry
🔹 Production Efficiency
Track output, machine downtime, and production yield against capacity.
🔹 Quality Control
Monitor defect rates, rework percentages, and compliance levels.
🔹 Energy Management
Measure energy consumption per ton produced to improve sustainability.
🔹 Safety Performance
Evaluate incident frequency, lost-time injuries, and safety compliance.
🔹 Supply Chain & Logistics
Analyze on-time delivery rate, transport cost per shipment, and supplier quality index.
By combining these KPIs in one place, the dashboard delivers 360-degree visibility into operational excellence.
🧠 Opportunities for Improvement
Even though the current version of the Steel & Metals KPI Dashboard is powerful, there’s always room for enhancement. Here are a few ideas:
-
Add Forecasting Models: Use Power BI’s AI capabilities to predict future KPI trends.
-
Integrate Live Databases: Connect directly to ERP or MES systems for real-time updates.
-
Include Department-Level Dashboards: Create additional drill-through pages for production, quality, and procurement.
-
Add Alerts and Notifications: Automate alerts when KPI performance falls below thresholds.
-
Mobile Optimization: Design Power BI views for mobile access by field teams.
Implementing these improvements can make the dashboard even more insightful and efficient.
Click to Purchases Steel & Metals KPI Dashboard in Power BI
🧩 Best Practices for the Steel & Metals KPI Dashboard
To get the most value from your Power BI dashboard, follow these best practices:
✅ Data Preparation
-
Keep Excel data clean and consistent.
-
Use standard formats for dates, units, and KPI names.
-
Validate formulas in the KPI Definition sheet.
✅ Dashboard Design
-
Maintain color consistency for KPI icons (green for good, red for poor).
-
Avoid clutter; focus on meaningful visuals.
-
Use slicers strategically for filtering by time and KPI group.
✅ Performance Tracking
-
Refresh data at least once per reporting cycle (monthly or weekly).
-
Compare results with both targets and previous years.
-
Investigate outliers or sudden performance changes immediately.
✅ Continuous Improvement
-
Update KPI definitions as business processes evolve.
-
Conduct periodic KPI reviews to ensure relevance.
-
Encourage feedback from department heads and analysts.
Following these guidelines ensures that your dashboard remains reliable, insightful, and aligned with business goals.
🧾 Conclusion
The Steel & Metals KPI Dashboard in Power BI is a complete solution for performance measurement in one of the most data-driven industries. From production yield to safety, from quality control to logistics — it empowers decision-makers to analyze, compare, and act on insights without manual effort.
By integrating structured Excel data with Power BI’s visualization capabilities, this dashboard bridges the gap between raw data and real business outcomes. It’s not just a reporting tool; it’s a foundation for continuous improvement and strategic growth.
If you’re in the steel or metals industry, this dashboard can help you make faster, smarter, and more confident decisions every day.
Click to Purchases Steel & Metals KPI Dashboard in Power BI
❓ Frequently Asked Questions (FAQs)
1. What is a Steel & Metals KPI Dashboard?
It’s an interactive Power BI tool designed to track and analyze performance indicators such as production, quality, safety, and energy efficiency for the steel and metals sector.
2. What data sources does it use?
The dashboard uses an Excel file with three tabs: Input_Actual, Input_Target, and KPI Definition.
3. Can I customize the KPIs?
Yes, you can easily modify or add KPIs by updating the Excel file and refreshing the dashboard.
4. Is Power BI required to use this dashboard?
Yes, you need Microsoft Power BI Desktop or Power BI Service to view and interact with the dashboard.
5. How often should I update the data?
Ideally, update data monthly or weekly depending on your organization’s reporting cycle.
6. Can it connect to live data?
Absolutely. You can extend it by connecting to SQL databases, ERP systems, or APIs for live reporting.
7. Does it show visual comparisons?
Yes, it provides charts, tables, and color-coded indicators for Actual vs. Target and Year-over-Year performance.
8. Is this dashboard suitable for small steel plants?
Yes, it’s fully scalable. Small plants can start with Excel inputs, while large manufacturers can integrate live systems later.
9. Can I export the dashboard reports?
Power BI allows exporting visuals and tables to PDF, PowerPoint, or Excel for presentations and reporting.
10. Where can I get this dashboard?
You can download the Steel & Metals KPI Dashboard in Power BI from NextGenTemplates.com and start monitoring your performance today.
Click to Purchases Steel & Metals KPI Dashboard in Power BI
Visit our YouTube channel to learn step-by-step video tutorials