Introduction
The STEM Education Centers KPI Dashboard is a powerful tool designed to track and analyze key performance indicators essential for managing STEM education initiatives effectively. This ready-to-use template offers a comprehensive view of crucial metrics, enabling stakeholders to make informed decisions and monitor progress seamlessly.
Key Features of STEM Education Centers KPI Dashboard
- Comprehensive coverage of KPIs relevant to STEM education centers.
- User-friendly navigation with an indexed home sheet featuring quick access buttons.
- Flexible monthly selections to dynamically update KPIs and visualizations.
- Conditional formatting with trend arrows for quick insight into data variations.
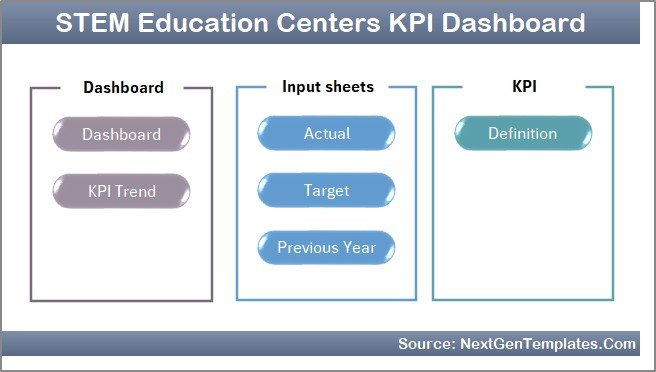
- Multiple data input sheets allowing for clear segregation of actual, target, and previous year data.
- KPI definition and formula documentation within the dashboard for clarity and consistency.
- Interactive trend charts to visualize Month-to-Date (MTD) and Year-to-Date (YTD) performances.
Dashboard Pages Explanation
1. Home Sheet
This acts as the index page with six buttons to navigate easily to different sheets within the dashboard. The layout provides a centralized starting point for users.
 Caption: Home Page
Click to Buy STEM Education Centers KPI Dashboard in Excel
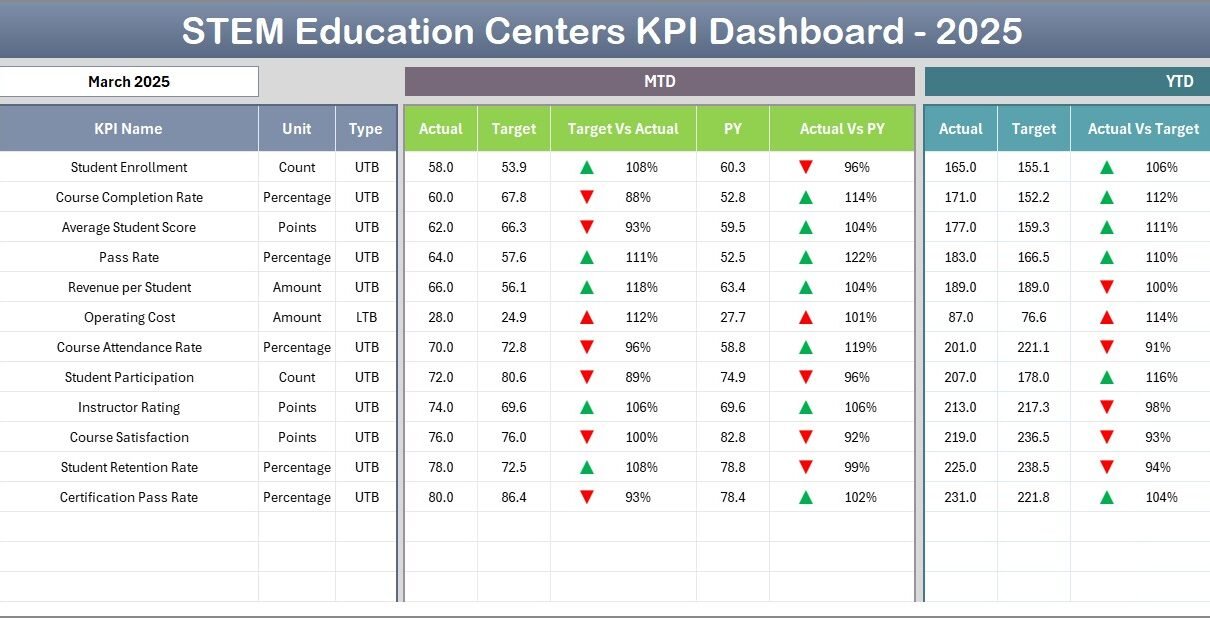
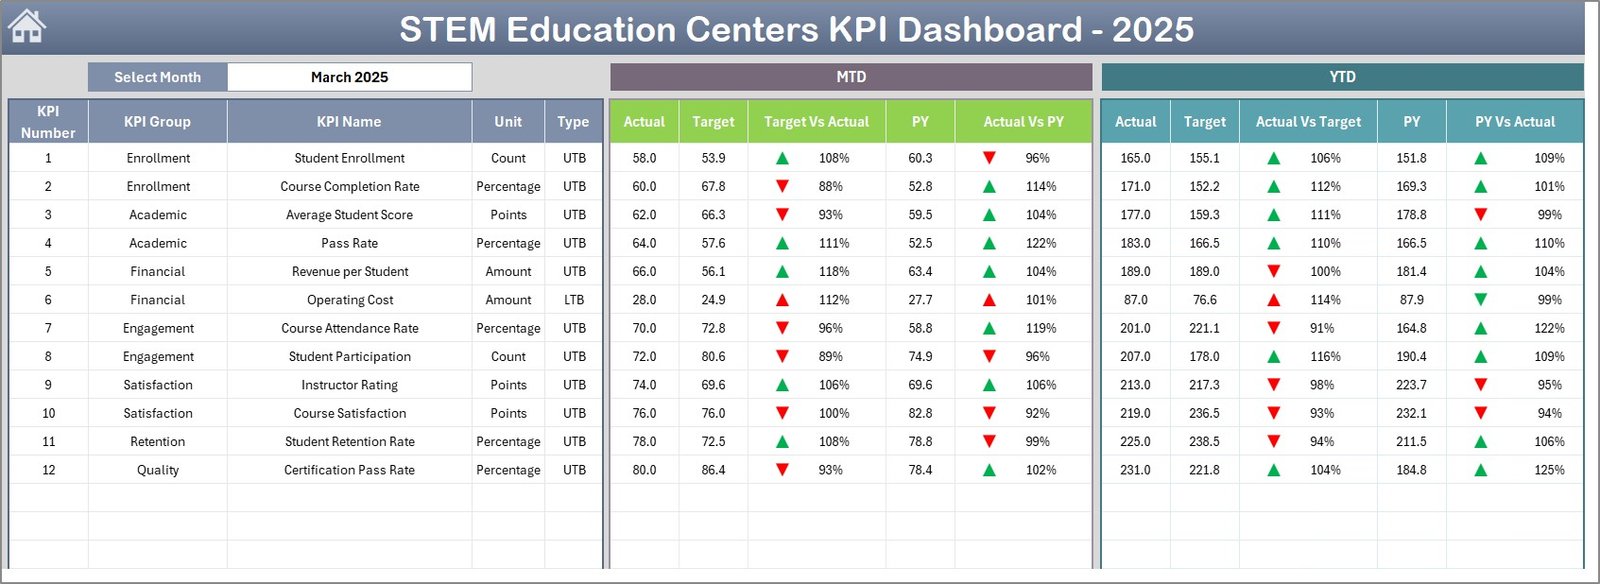
2. Dashboard Sheet Tab
The main analysis page displaying all KPIs with dynamic updates based on the selected month (using a drop-down on cell D3). Key metrics include Month-To-Date (MTD) Actual, Target, Previous Year data, with comparative visuals showing Target vs Actual and Previous Year vs Actual using conditional formatting arrows. Similar information is available for Year-To-Date (YTD) data.
 Caption: STEM Education Centers KPI Dashboard
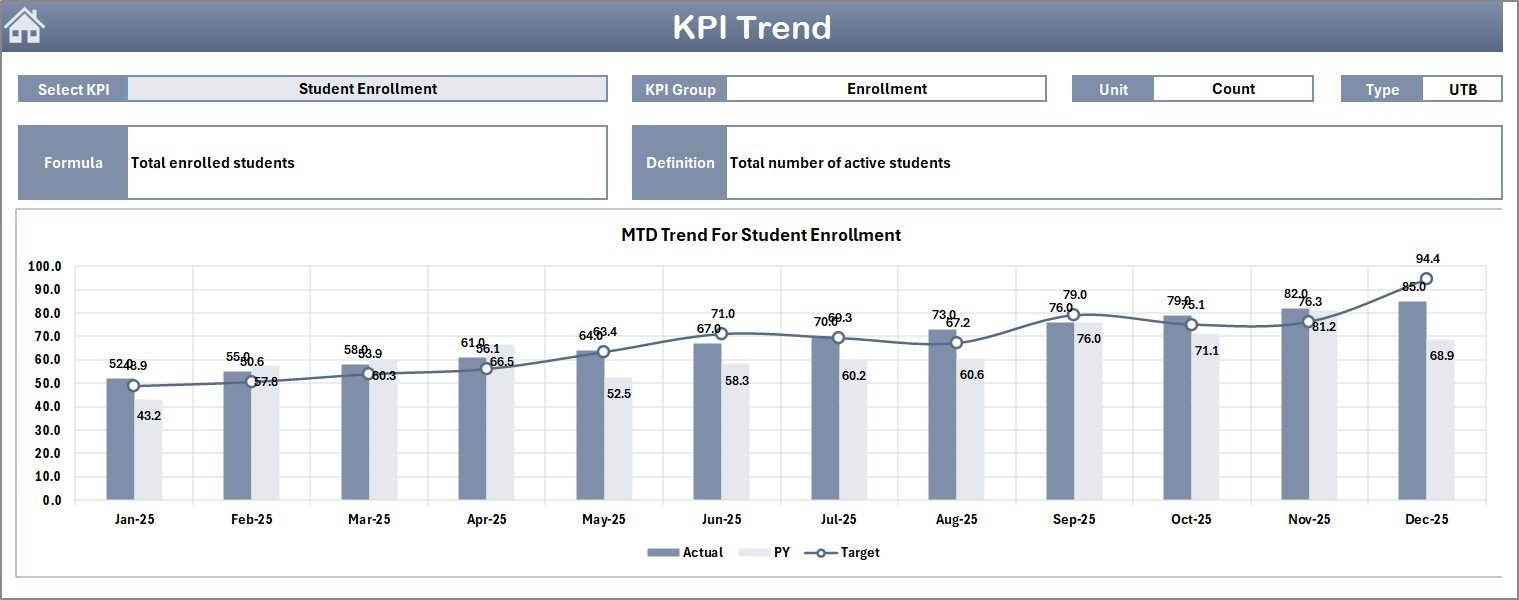
3. KPI Trend Sheet Tab
This sheet enables detailed analysis by selecting specific KPIs from a drop-down (range C3). It displays KPI group, unit, type (Lower the Better or Upper the Better), formula, and definition. The core highlight is the MTD and YTD trend charts visualizing Actual, Target, and Previous Year data for intuitive tracking of KPI performance over time.
 Caption: KPI Trend Sheet
Click to Buy STEM Education Centers KPI Dashboard in Excel
4. Actual Numbers Input Sheet
Users enter the actual performance numbers here for both YTD and MTD figures corresponding to a selected month. The month can be adjusted in cell E1 to align with the starting month of the year.
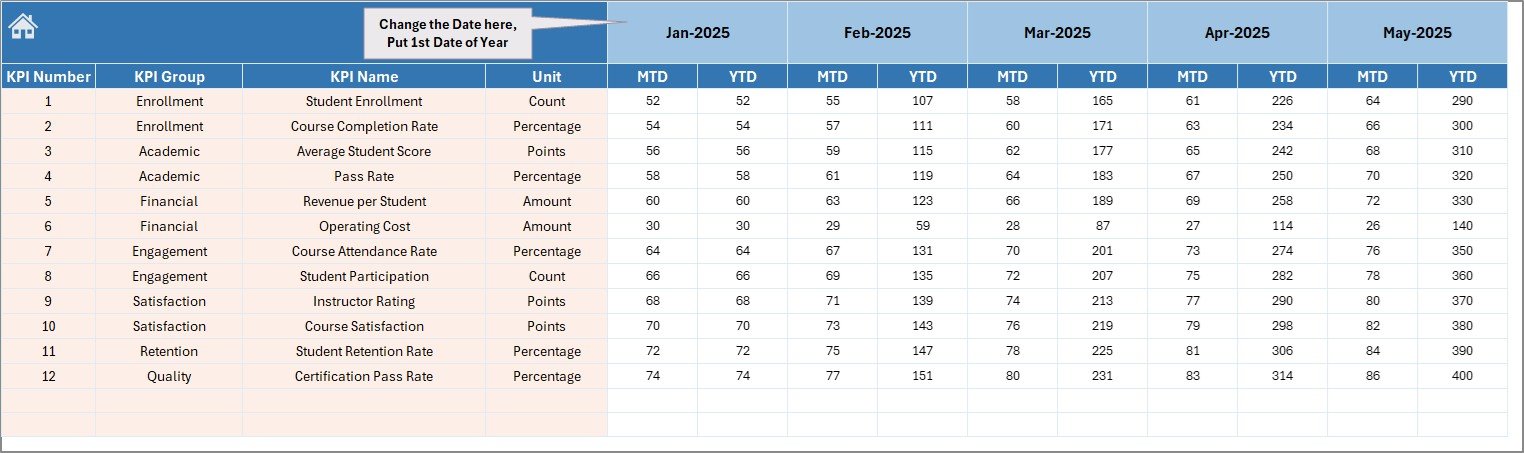 Caption: Actual Numbers Input sheet
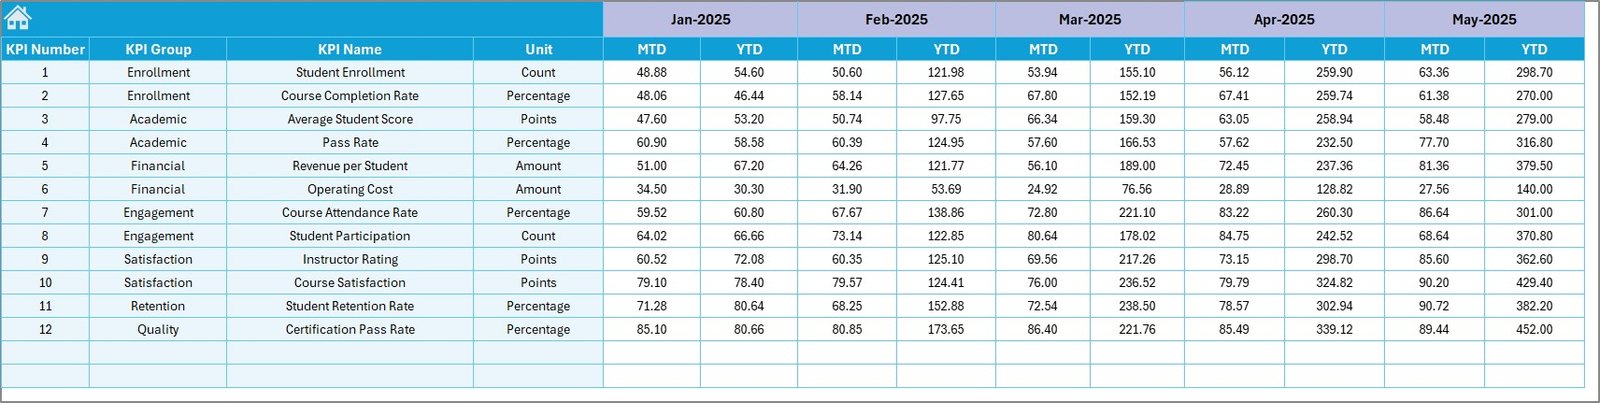
5. Target Number Input Sheet
Dedicated to entering target metrics for each KPI on an MTD and YTD basis. This separation helps maintain clear goal-setting and comparison with actual performances.
 Caption: Target Number Input sheet
Click to Buy STEM Education Centers KPI Dashboard in Excel
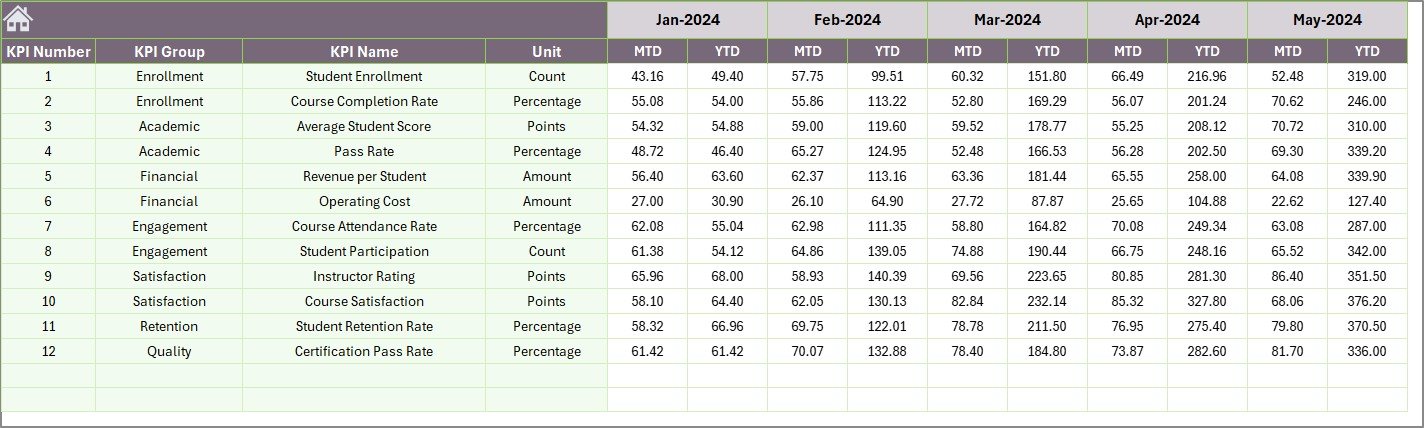
6. Previous Year Number Sheet Tab
This sheet is reserved for entering the previous year’s data in the same format as the current year, facilitating year-over-year comparisons across all KPIs.
 Caption: Previous Year Number Input sheet
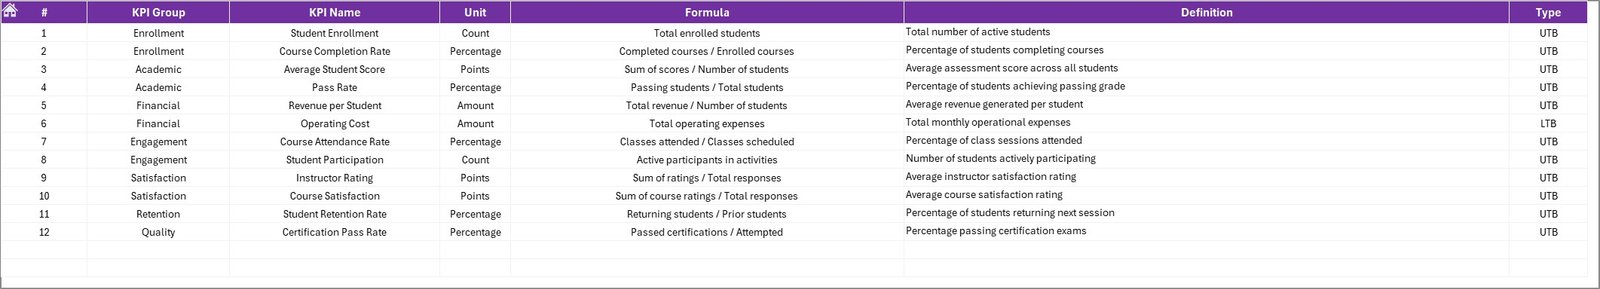
7. KPI Definition Sheet Tab
This critical sheet stores all the definitions, formulas, units, groups, and KPI types (LTB – Lower the Better or UTB – Upper the Better). It serves as the foundational reference that ensures clarity and consistency in KPI tracking.
 Caption: KPI Definition sheet
Click to Buy STEM Education Centers KPI Dashboard in Excel
Advantages of STEM Education Centers KPI Dashboard
- Centralized Data Management: Consolidates all KPI data for easy accessibility and analysis.
- Dynamic Visualizations: Interactive charts and conditional formatting improve interpretation and quick decision making.
- Enhanced Tracking: Enables monitoring of progress against targets and historical performance, fostering accountability.
- Customizable Inputs: Users can update actual, target, and previous year numbers with ease, adapting dashboard to real-time data.
- KPI Clarity: Embedded definitions and formulas reduce misinterpretations and ensure consistent KPI usage.
- Time-saving: Pre-built structure saves time in setting up performance tracking systems.
Opportunities for Improvement
Click to Buy STEM Education Centers KPI Dashboard in Excel
- Integrating real-time data connections from educational management systems for automatic updates.
- Adding predictive analytics to forecast KPI trends based on historical data.
- Implementing user access controls for secure collaboration.
- Enhancing mobile-friendly views or building a web app version for remote accessibility.
- Personalizing dashboards for different user roles like teachers, administrators, and coordinators.
Best Practices
- Regularly update actual and target inputs to keep dashboard relevant.
- Use the KPI Definitions sheet to onboard new users and maintain KPI integrity.
- Compare month-over-month and year-over-year data to identify meaningful insights.
- Leverage trend visualizations to detect issues early and make timely interventions.
- Maintain a clear record of data sources and updates to ensure data quality.
FAQs
Click to Buy STEM Education Centers KPI Dashboard in Excel
What KPIs are included in the STEM Education Centers KPI Dashboard?
The dashboard includes KPIs related to educational outcomes, student engagement, resource utilization, and program effectiveness specifically tailored for STEM education centers.
Can I customize the dashboard?
Yes, the dashboard template is designed for customization. You can add or modify KPIs, update formulae, and adjust targets based on your center’s specific needs.
Is this dashboard compatible with Excel versions?
The dashboard is optimized for recent versions of Microsoft Excel that support drop-down lists, conditional formatting, and charting features.
How frequently should data be updated?
For optimal use, update actual and target numbers monthly to match your reporting cycle, ensuring accurate performance tracking.
Where can I learn how to use this dashboard?
Visit our YouTube channel for detailed walkthroughs and demos: NextGenTemplates.
Conclusion
Click to Buy STEM Education Centers KPI Dashboard in Excel
The STEM Education Centers KPI Dashboard is an invaluable resource for monitoring and enhancing STEM education performance. By offering clear, actionable insights and a user-friendly interface, it empowers educators and administrators to drive improvement and achieve strategic goals effectively. Implementing this dashboard can transform how STEM centers measure success and align activities with educational objectives.
Explore Microsoft’s official Excel resources for additional dashboard tips and features: Microsoft Excel Support.
Visit our YouTube channel to watch the demo: Youtube.com/@NextGenTemplates
Click to Buy STEM Education Centers KPI Dashboard in Excel


