Street lighting plays a crucial role in modern cities. Well-maintained street lighting improves road safety, supports urban development, and enhances public security. Because cities expand rapidly, municipal authorities and infrastructure teams must monitor street lighting operations efficiently.
However, many municipalities still track lighting maintenance, service requests, energy usage, and repair activities through scattered spreadsheets. As a result, managers struggle to analyze service performance, monitor maintenance efficiency, and evaluate operational costs.
Therefore, organizations need a structured system that can track important Street Lighting Service KPIs in one place. A centralized KPI dashboard allows decision-makers to monitor performance, evaluate trends, and improve service quality.
This is where the Street Lighting Services KPI Dashboard in Excel becomes extremely useful.
The Street Lighting Services KPI Dashboard in Excel is a powerful and ready-to-use Excel template that helps municipalities and infrastructure teams monitor lighting performance, maintenance activities, and operational efficiency. Because this dashboard combines dynamic reporting, automated calculations, and visual analytics, managers can easily track KPIs and make data-driven decisions.
In this comprehensive guide, you will learn everything about the Street Lighting Services KPI Dashboard in Excel, including its features, benefits, implementation strategies, and best practices.
Click to Purchases Street Lighting Services KPI Dashboard in Excel
What Is a Street Lighting Services KPI Dashboard in Excel?
A Street Lighting Services KPI Dashboard in Excel is a data analytics tool designed to monitor key performance indicators related to street lighting operations.
This dashboard collects service data such as maintenance records, energy consumption, repair activities, and lighting performance metrics. It then converts this information into interactive charts, KPI indicators, and performance reports.
Because Excel provides flexible reporting and visualization capabilities, infrastructure managers can easily analyze service performance and identify improvement areas.
This dashboard helps organizations track:
-
Lighting maintenance performance
-
Energy consumption efficiency
-
Service request resolution time
-
Operational costs
-
System reliability and uptime
-
Maintenance response time
As a result, city authorities can maintain efficient and reliable street lighting systems.
Click to Purchases Street Lighting Services KPI Dashboard in Excel
Why Do Municipalities Need a Street Lighting KPI Dashboard?
Street lighting services involve complex operations. Maintenance teams must monitor thousands of lights across multiple locations. Without a structured monitoring system, managing these operations becomes extremely difficult.
Many municipalities face common challenges such as:
-
Difficulty tracking maintenance performance
-
Poor visibility into operational costs
-
Lack of centralized performance reports
-
Limited insights into energy consumption
-
Delays in service request resolution
Because of these challenges, decision-makers cannot quickly identify performance gaps.
However, the Street Lighting Services KPI Dashboard in Excel solves these problems by providing a centralized monitoring system.
With this dashboard, organizations can:
-
Monitor lighting maintenance KPIs
-
Track repair activities
-
Analyze energy consumption trends
-
Compare performance across months
-
Improve operational efficiency
Consequently, cities can provide safer and more efficient street lighting services.
Click to Purchases Street Lighting Services KPI Dashboard in Excel
Key Features of the Street Lighting Services KPI Dashboard in Excel
The Street Lighting Services KPI Dashboard in Excel includes seven structured worksheets that help users manage data efficiently and analyze performance effectively.
Each sheet performs a specific function within the dashboard system.
Home Sheet – Navigation Page
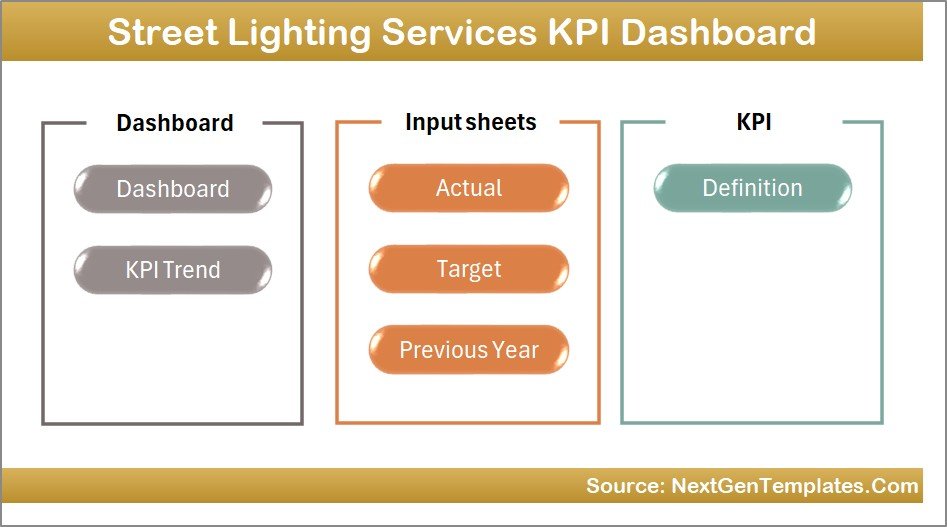
The Home sheet works as the index page of the dashboard.
This sheet includes six navigation buttons that allow users to jump directly to different dashboard sections.
Because of this structured navigation, users can quickly access the required reports and data sheets.
The Home sheet improves usability and helps users move easily between different parts of the dashboard.
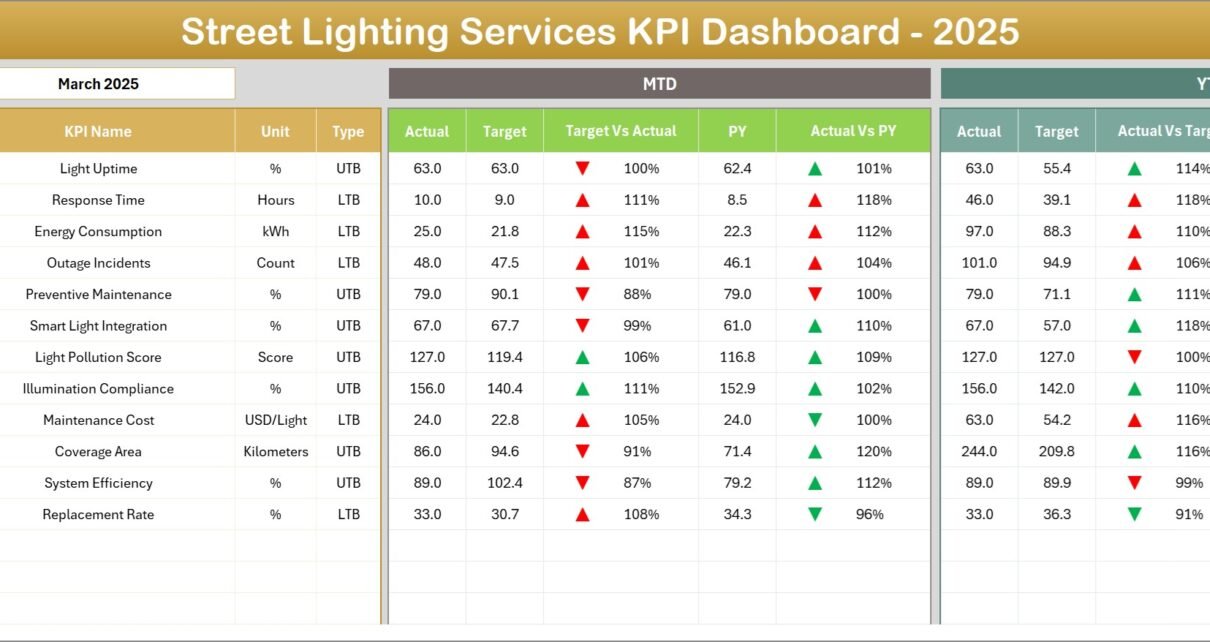
Dashboard Sheet – Main KPI Overview
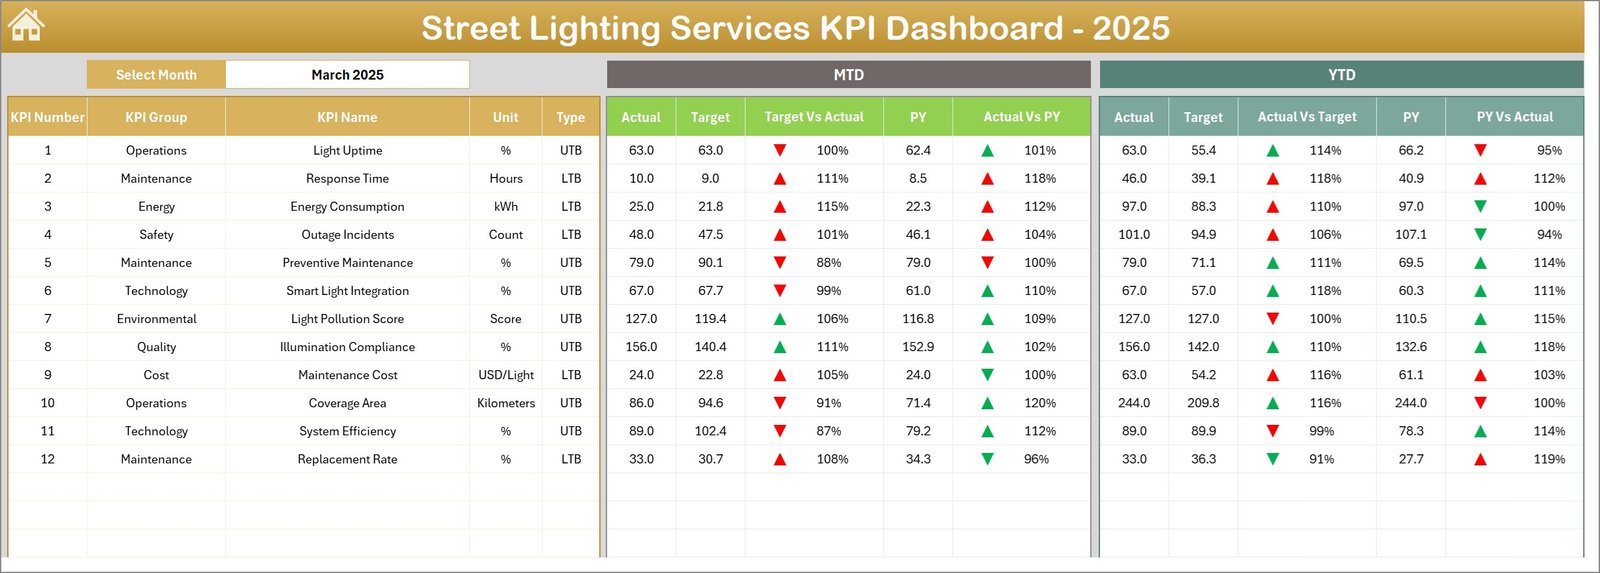
The Dashboard sheet is the main analysis page of the template.
This page displays complete KPI performance information for street lighting services.
Users can select the Month from the drop-down menu in cell D3, and the entire dashboard automatically updates based on the selected month.
Because of this dynamic feature, users can easily analyze monthly performance.
Metrics Displayed on the Dashboard
The dashboard displays the following KPI metrics:
MTD (Month-to-Date) Metrics
-
Actual Values
-
Target Values
-
Previous Year Values
-
Target vs Actual comparison
-
Previous Year vs Actual comparison
YTD (Year-to-Date) Metrics
-
Actual Values
-
Target Values
-
Previous Year Values
-
Target vs Actual comparison
-
Previous Year vs Actual comparison
The dashboard also uses conditional formatting arrows to show performance trends.
These arrows clearly indicate whether KPI performance has improved or declined.
As a result, managers can quickly identify areas that require attention.
Click to Purchases Street Lighting Services KPI Dashboard in Excel
KPI Trend Sheet – KPI Performance Analysis
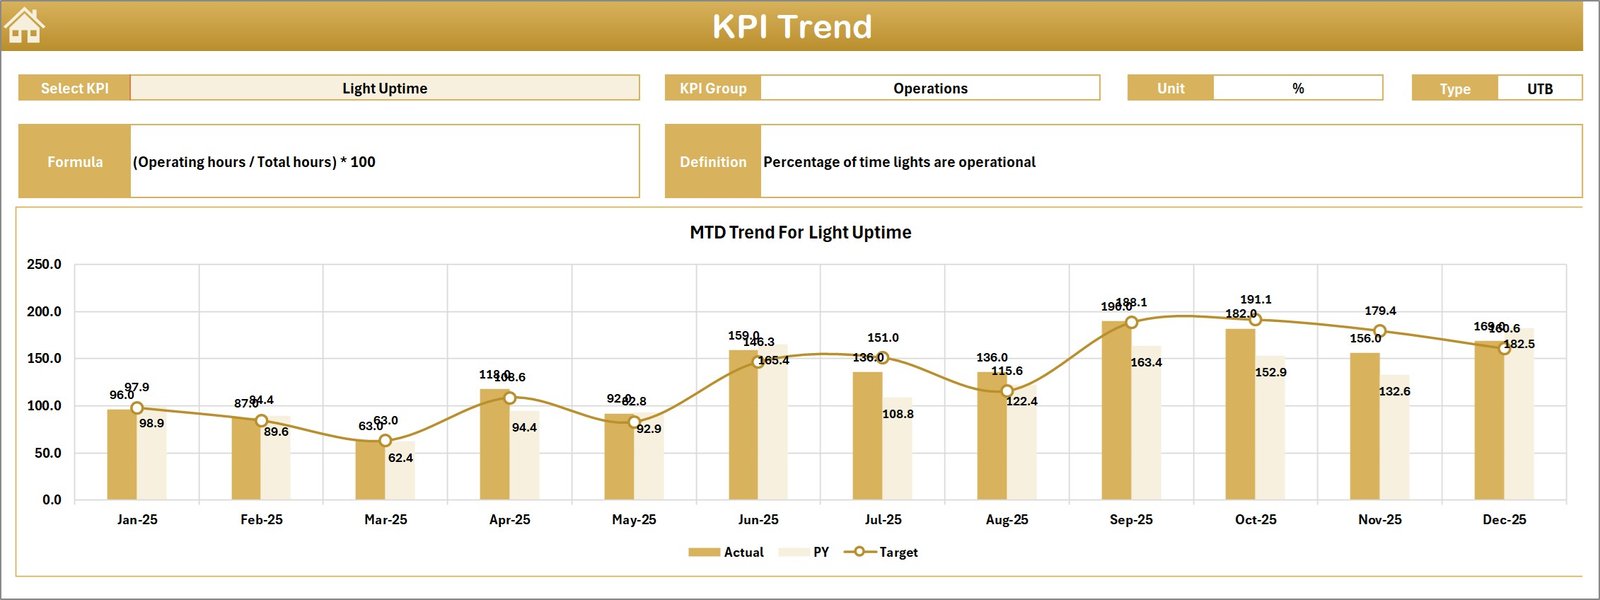
The KPI Trend sheet provides detailed performance analysis for individual KPIs.
Users can select the KPI name from the drop-down list available in cell C3.
Once a KPI is selected, the sheet displays detailed information about that KPI.
KPI Details Displayed
The dashboard displays:
-
KPI Group
-
KPI Unit
-
KPI Type (Lower the Better or Upper the Better)
-
KPI Formula
-
KPI Definition
Additionally, the sheet includes trend charts that display performance over time.
Charts Included
The KPI Trend sheet displays:
-
MTD Trend Chart for Actual, Target, and Previous Year values
-
YTD Trend Chart for Actual, Target, and Previous Year values
These visualizations help managers analyze KPI trends and evaluate performance improvements.
Click to Purchases Street Lighting Services KPI Dashboard in Excel
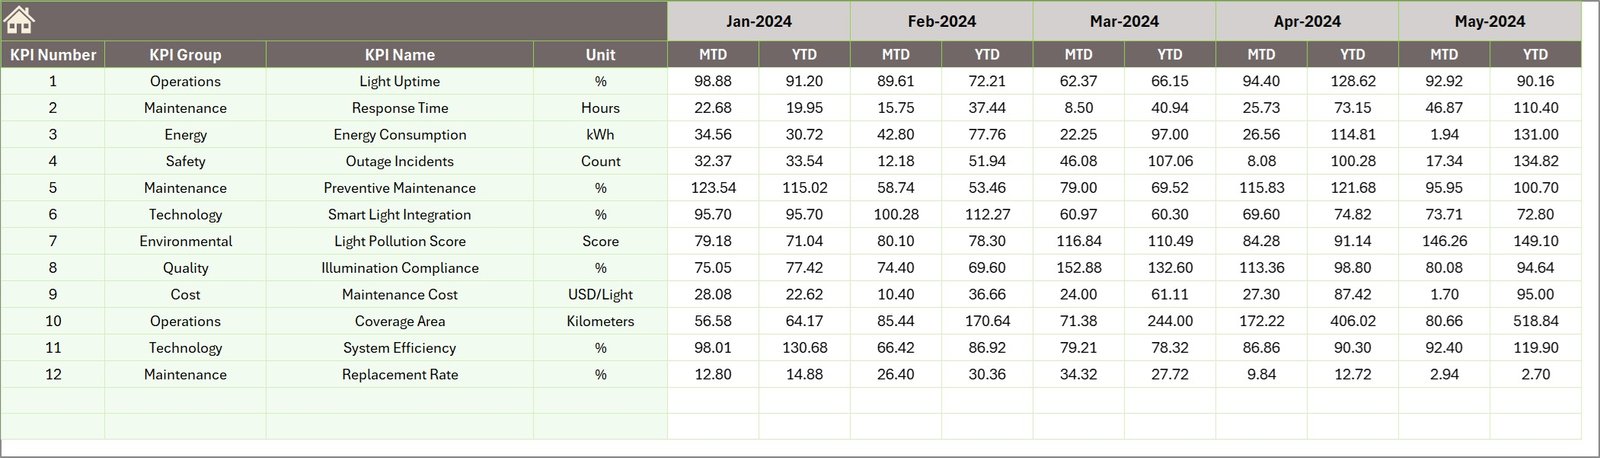
Actual Numbers Input Sheet – Data Entry Page
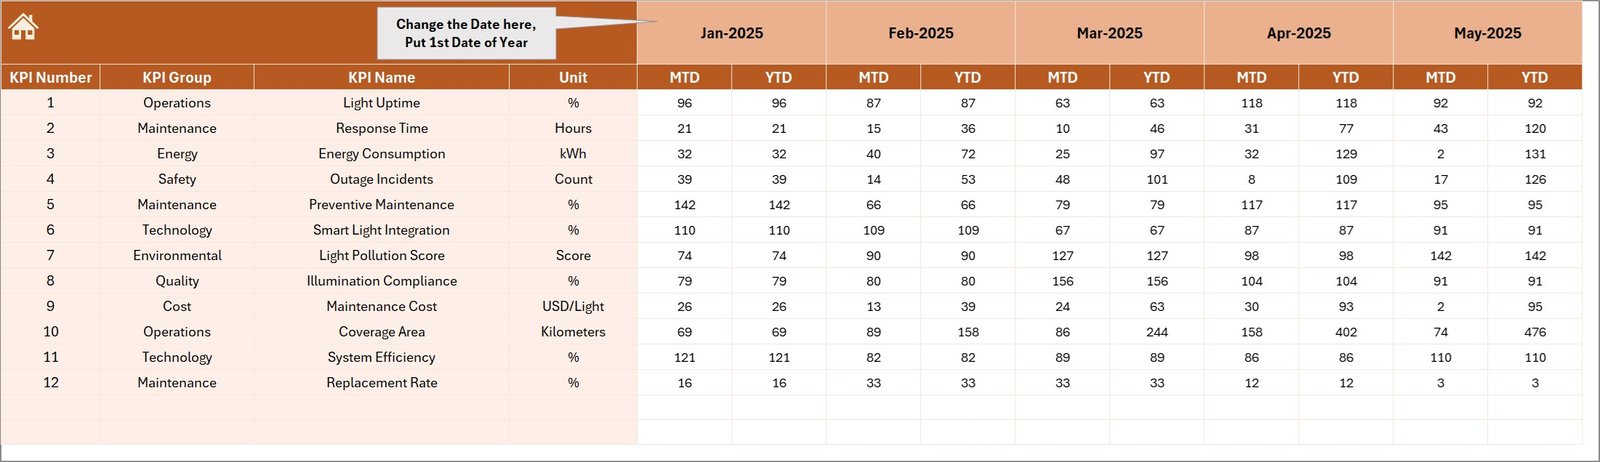
The Actual Numbers Input sheet allows users to enter actual performance data.
This sheet acts as the primary data entry section of the dashboard.
Users must enter the MTD and YTD actual values for each KPI.
Data Entry Process
To update data:
-
Enter the starting month of the year in cell E1.
-
Enter actual performance values for each KPI.
-
Update the data for every month.
Once users enter the data, the dashboard automatically updates all charts and KPI indicators.
This automation makes reporting faster and easier.
Target Sheet – KPI Target Management
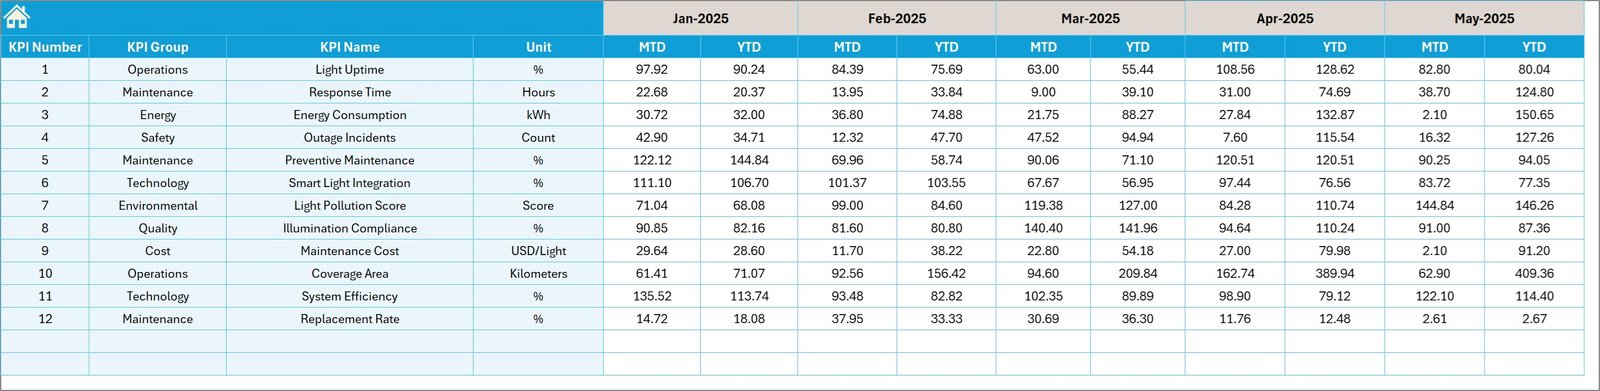
The Target sheet allows users to define performance targets for each KPI.
Users must enter target values for every month.
The sheet contains two types of targets:
-
MTD Targets
-
YTD Targets
Because targets define performance goals, they play an important role in performance evaluation.
Once targets are entered, the dashboard automatically compares them with actual values.
This comparison helps managers track whether performance goals are achieved.
Click to Purchases Street Lighting Services KPI Dashboard in Excel
Previous Year Number Sheet – Historical Comparison
The Previous Year Number sheet stores historical KPI data.
Users must enter the previous year values for each KPI.
These numbers allow the dashboard to perform year-over-year performance comparisons.
Historical analysis helps organizations identify:
-
Performance growth
-
Operational improvements
-
Seasonal trends
Consequently, managers can make more informed decisions.
KPI Definition Sheet – KPI Information Management
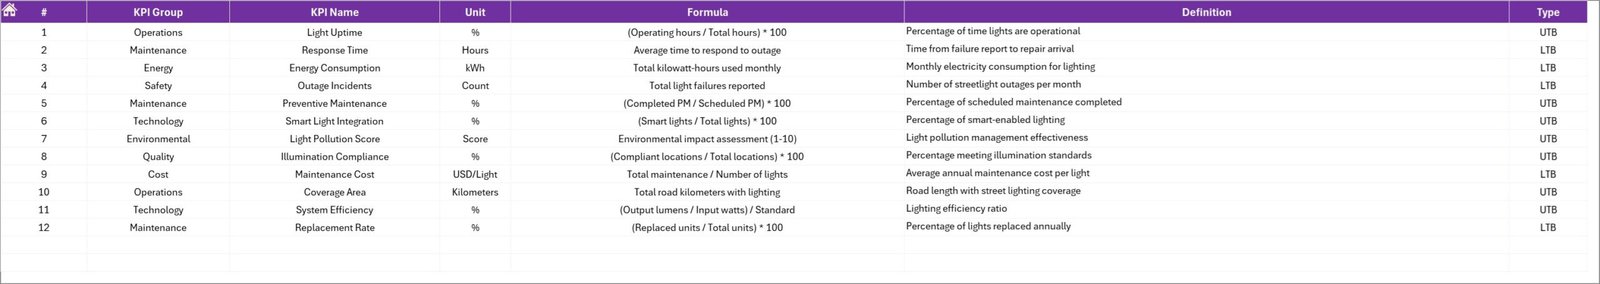
The KPI Definition sheet stores detailed information about each KPI.
Users must enter the following information:
-
KPI Name
-
KPI Group
-
KPI Unit
-
KPI Formula
-
KPI Definition
This sheet helps standardize KPI definitions across the organization.
As a result, everyone understands how each KPI is calculated and interpreted.
Click to Purchases Street Lighting Services KPI Dashboard in Excel
Advantages of Street Lighting Services KPI Dashboard in Excel
The dashboard provides several important benefits for municipalities and infrastructure teams.
Centralized Performance Monitoring
The dashboard consolidates all street lighting KPIs in one place. Therefore, managers can easily monitor performance.
Improved Operational Efficiency
Because the dashboard highlights performance gaps, teams can quickly identify operational issues.
Better Decision Making
Data visualization helps decision-makers analyze performance trends quickly.
Performance Comparison
The dashboard compares:
-
Actual vs Target values
-
Current year vs Previous year performance
This comparison improves strategic planning.
Faster Reporting
Excel automation reduces manual reporting work.
Enhanced Data Visibility
Clear charts and KPI indicators help managers understand complex data easily.
Opportunities for Improvement in Street Lighting Services Analytics
Although the dashboard provides strong analytics capabilities, organizations can improve it further.
Integrate IoT Sensor Data
Smart lighting systems generate real-time performance data. Integrating IoT sensors can improve analytics.
Add Energy Consumption Metrics
Tracking energy usage helps municipalities reduce electricity costs.
Monitor Maintenance Response Time
Adding response time metrics improves service quality monitoring.
Implement Predictive Maintenance
Advanced analytics can predict lighting failures before they occur.
Click to Purchases Street Lighting Services KPI Dashboard in Excel
Best Practices for Street Lighting Services KPI Dashboard in Excel
Organizations should follow several best practices when using this dashboard.
Define Clear KPIs
Common KPIs for street lighting services include:
-
Maintenance completion rate
-
Lighting uptime
-
Repair response time
-
Energy consumption efficiency
-
Fault resolution time
Clear KPIs improve monitoring accuracy.
Maintain Accurate Data
Accurate data ensures reliable reports. Therefore, teams must validate input data regularly.
Update Data Regularly
Monthly updates ensure that the dashboard reflects current performance.
Standardize KPI Definitions
Organizations should clearly define KPIs to avoid confusion.
Train Staff on Dashboard Usage
Proper training helps teams use the dashboard effectively.
Click to Purchases Street Lighting Services KPI Dashboard in Excel
How to Implement a Street Lighting KPI Dashboard in Excel
Organizations can follow a simple implementation process.
Step 1 – Define KPIs
Identify important street lighting performance indicators.
Step 2 – Collect Data
Gather data from maintenance systems, energy records, and service requests.
Step 3 – Enter Data into the Dashboard
Input actual numbers, targets, and previous year values.
Step 4 – Analyze KPI Trends
Use charts and indicators to evaluate performance.
Step 5 – Improve Operational Strategies
Use insights to optimize maintenance schedules and resource allocation.
Conclusion
Efficient street lighting services play a critical role in urban safety and infrastructure development. Because cities depend on reliable lighting systems, municipalities must carefully monitor maintenance performance and operational efficiency.
The Street Lighting Services KPI Dashboard in Excel provides a powerful solution for tracking performance metrics, analyzing trends, and improving decision-making.
This dashboard consolidates operational data into visual reports and automated calculations. As a result, infrastructure teams can monitor KPIs, evaluate performance gaps, and improve service delivery.
By implementing this dashboard, municipalities can enhance operational efficiency, reduce maintenance delays, and ensure safer streets for communities.
Click to Purchases Street Lighting Services KPI Dashboard in Excel
Frequently Asked Questions (FAQs)
What is a Street Lighting Services KPI Dashboard?
A Street Lighting Services KPI Dashboard is an Excel tool that tracks performance indicators related to lighting maintenance, operational efficiency, and service quality.
Why should municipalities use a KPI dashboard?
A KPI dashboard provides centralized performance monitoring and helps organizations make better operational decisions.
What KPIs are important for street lighting services?
Common KPIs include:
-
Maintenance response time
-
Lighting uptime
-
Energy consumption
-
Repair completion rate
-
Service request resolution time
Can Excel handle infrastructure performance dashboards?
Yes. Excel provides powerful reporting, automation, and visualization tools that make it suitable for infrastructure dashboards.
Click to Purchases Street Lighting Services KPI Dashboard in Excel
Visit our YouTube channel to learn step-by-step video tutorials