Subscription-based retail has transformed how modern businesses sell products and services. From curated product boxes and digital memberships to recurring household essentials, subscription models offer predictable revenue and long-term customer relationships. However, managing a subscription-based retail business without clear visibility into revenue, cost, profit, cancellations, and customer satisfaction can quickly become challenging.
That is exactly where the Subscription-based Retail Dashboard in Power BI becomes an essential decision-making tool.
In this detailed, SEO-friendly article, you will learn what a Subscription-based Retail Dashboard in Power BI is, why it is important, how it works, page-wise dashboard structure, key features, advantages, opportunities for improvement, best practices, and frequently asked questions. Subscription-Based Retail Dashboard in Power BI The content uses clear language, active voice, strong transitions, and practical explanations to ensure easy understanding for both technical and non-technical users.
Click to Purchases Subscription-Based Retail Dashboard in Power BI
What Is a Subscription-Based Retail Dashboard in Power BI?
A Subscription-based Retail Dashboard in Power BI is a visual analytics solution that helps subscription retail businesses track and analyze their operational, financial, and customer performance in one interactive platform.
Instead of reviewing multiple reports or raw datasets, this dashboard consolidates subscription data into interactive cards, charts, and slicers. As a result, decision-makers can instantly understand how revenue, cost, profit, customer satisfaction, and cancellations perform across channels, segments, countries, products, and time periods.
Because the dashboard is built in Power BI, it offers dynamic filtering, drill-down analysis, and professional-grade visuals suitable for management reporting.
Why Do Subscription-Based Retail Businesses Need a Dashboard?
Subscription-based retail businesses rely on recurring revenue. Therefore, even small changes in churn, discounting, or cost structure can significantly impact profitability.
A Subscription-based Retail Dashboard in Power BI helps because:
-
It provides real-time visibility into subscription performance
-
It tracks revenue, cost, and profit together
-
It highlights cancellation and satisfaction trends
-
It enables data-driven pricing and marketing decisions
-
It improves strategic planning and forecasting
As a result, businesses gain clarity, control, and confidence in managing their subscription operations.
What Key Metrics Can Be Tracked in This Dashboard?
This dashboard supports a wide range of subscription retail metrics. Because the design is flexible, organizations can adapt it to their business model.
Common metrics include:
-
Total Revenue
-
Cost USD
-
Profit USD
-
Profit Margin %
-
Discount Amount
-
Subscription Cancellation %
-
Customer Satisfaction Rating
-
Subscription Volume
-
Payment Method Performance
-
Acquisition Channel Performance
By tracking these metrics together, businesses can understand both financial health and customer experience.
Click to Purchases Subscription-Based Retail Dashboard in Power BI
Key Features of the Subscription-Based Retail Dashboard in Power BI
This dashboard is designed with a clear structure and strong analytical depth. Below is a detailed explanation of its page-wise features.
How Many Pages Are Included in the Dashboard?
The Subscription-based Retail Dashboard in Power BI contains 5 interactive pages in the Power BI Desktop application. Each page focuses on a specific analytical theme.
What Insights Does the Overview Page Provide?
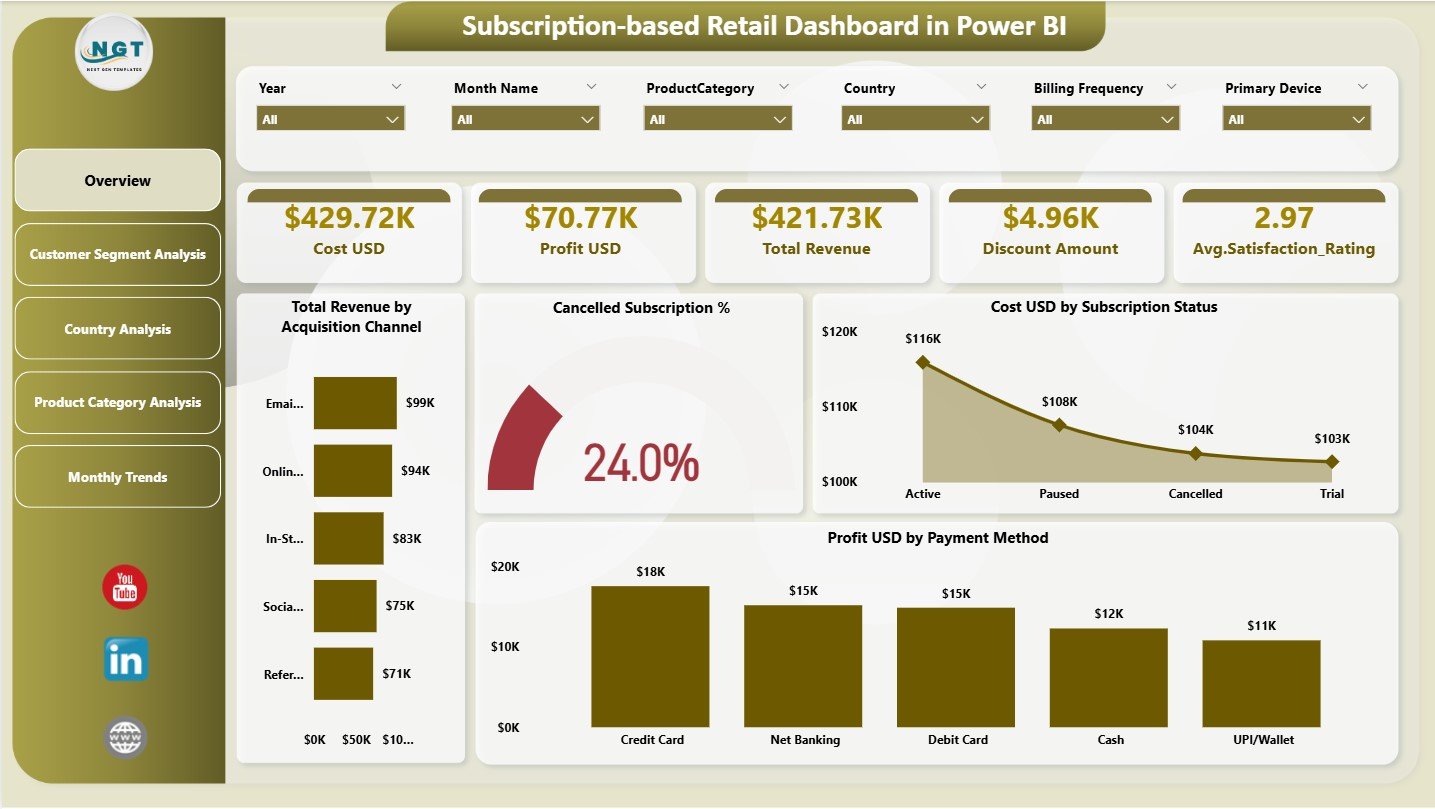
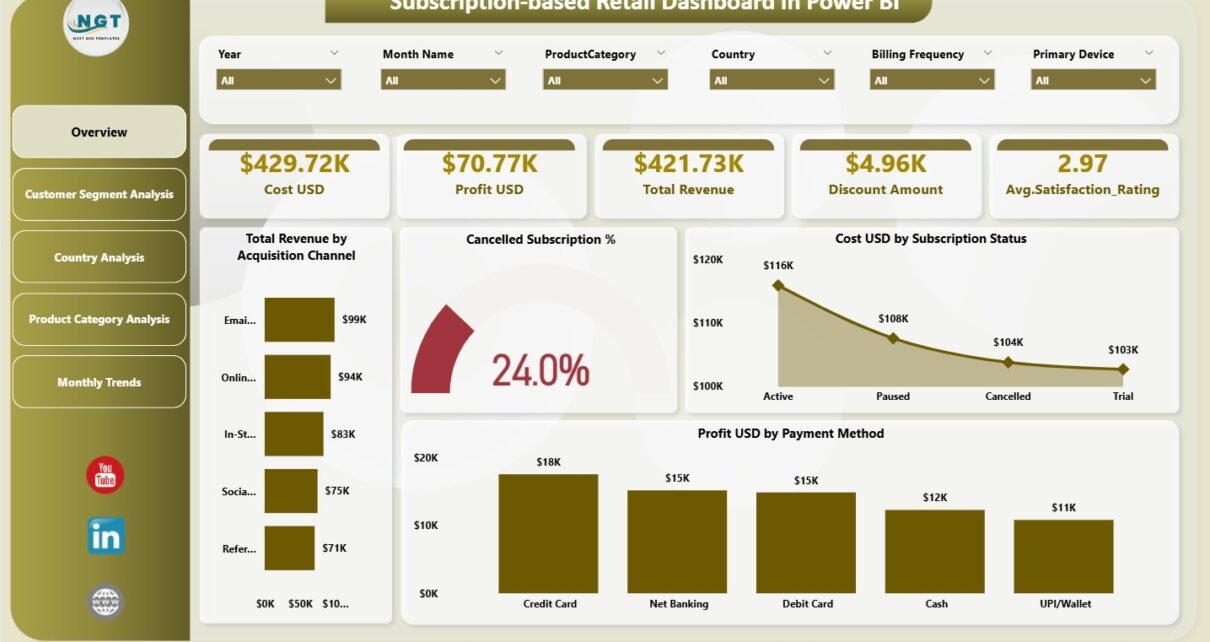
The Overview Page acts as the main landing page and executive summary of the dashboard.
Key Elements of the Overview Page
Top KPI Cards
-
💰 Cost USD
-
💵 Profit USD
-
📈 Total Revenue
-
🏷️ Discount Amount
-
⭐ Average Satisfaction Rating
These cards provide an instant snapshot of overall business performance.
Charts on the Overview Page
The Overview Page also includes four powerful charts:
-
📊 Total Revenue by Acquisition Channel
Understand which marketing channels drive the most revenue. -
❌ Cancelled Subscription %
Monitor cancellation trends and churn risks. -
💰 Cost USD by Subscription Status
Compare costs for active, paused, or cancelled subscriptions. -
💵 Profit USD by Payment Method
Identify the most profitable payment methods.
Because slicers are available, users can filter data dynamically to explore deeper insights.
Click to Purchases Subscription-Based Retail Dashboard in Power BI
How Does Customer Segment Analysis Improve Understanding?
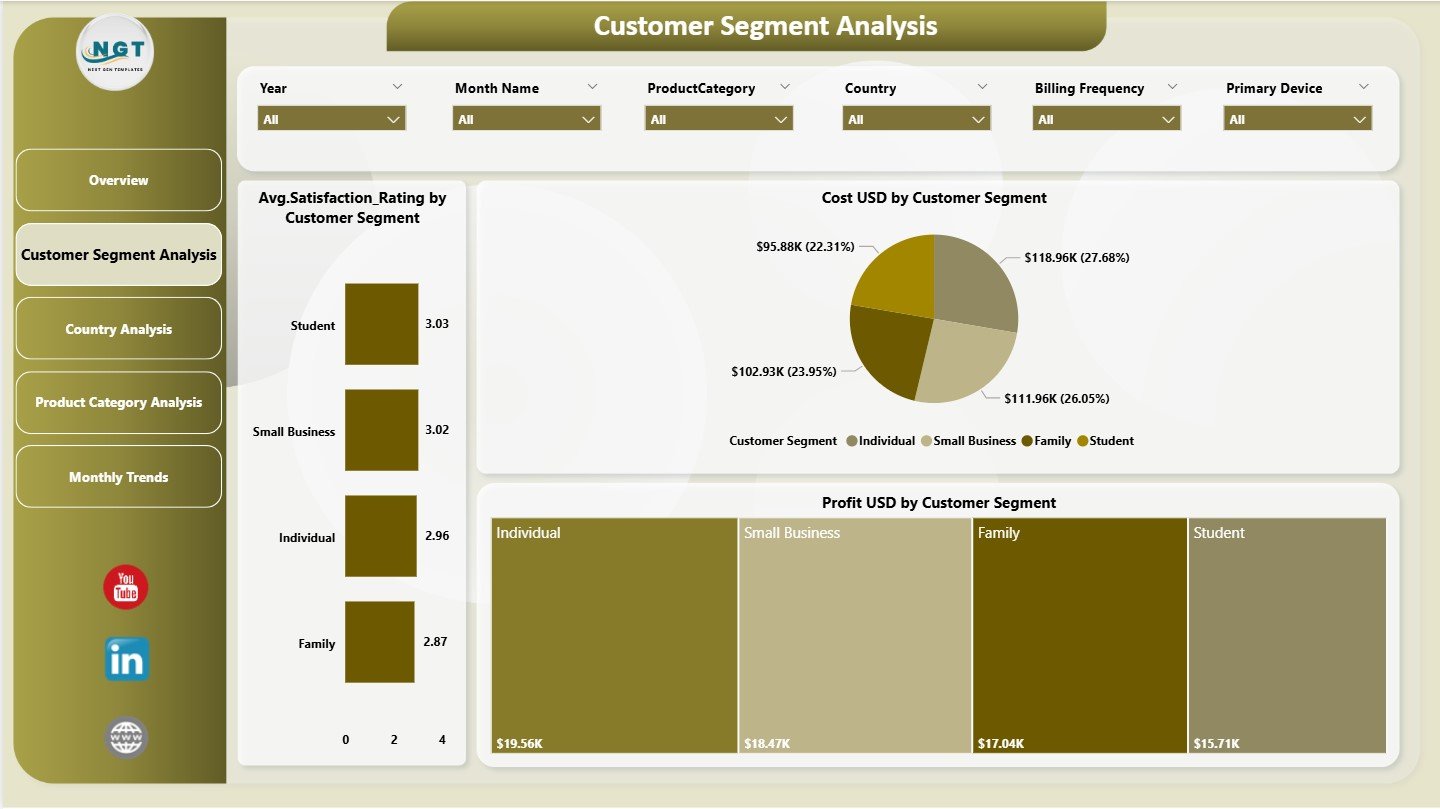
The Customer Segment Analysis Page focuses on performance across different customer groups.
Charts Included on This Page
-
💰 Cost USD by Customer Segment
-
⭐ Average Satisfaction Rating by Customer Segment
-
💵 Profit USD by Customer Segment
This page helps businesses understand which customer segments deliver higher profitability and satisfaction. As a result, teams can refine targeting, pricing, and service strategies.
Why Is Country Analysis Important for Subscription Retail?
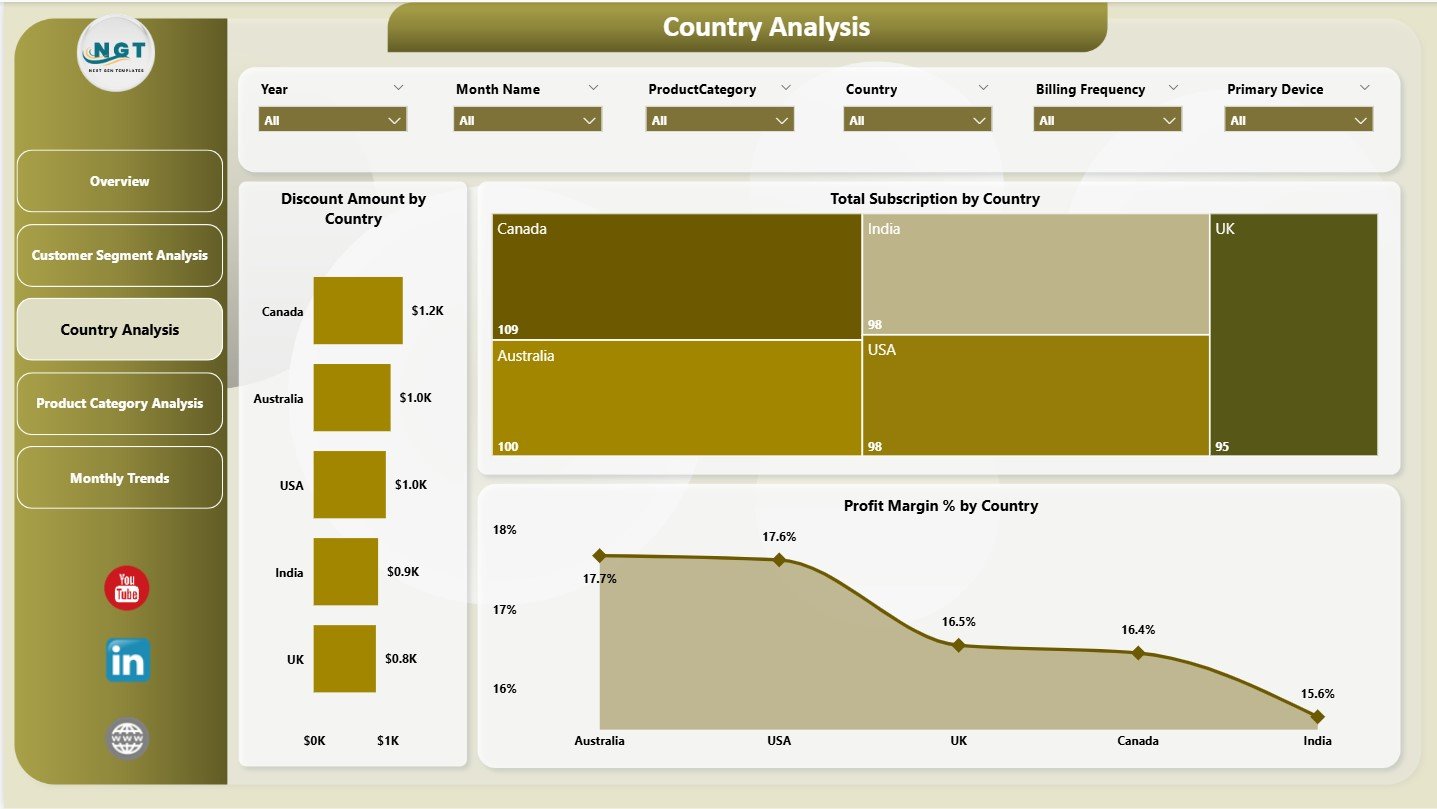
The Country Analysis Page helps businesses evaluate geographic performance.
Key Charts on the Country Analysis Page
-
🏷️ Discount Amount by Country
-
📦 Total Subscriptions by Country
-
📈 Profit Margin % by Country
This analysis enables businesses to identify high-growth regions, pricing inefficiencies, and country-specific profitability trends.
What Does Product Category Analysis Reveal?
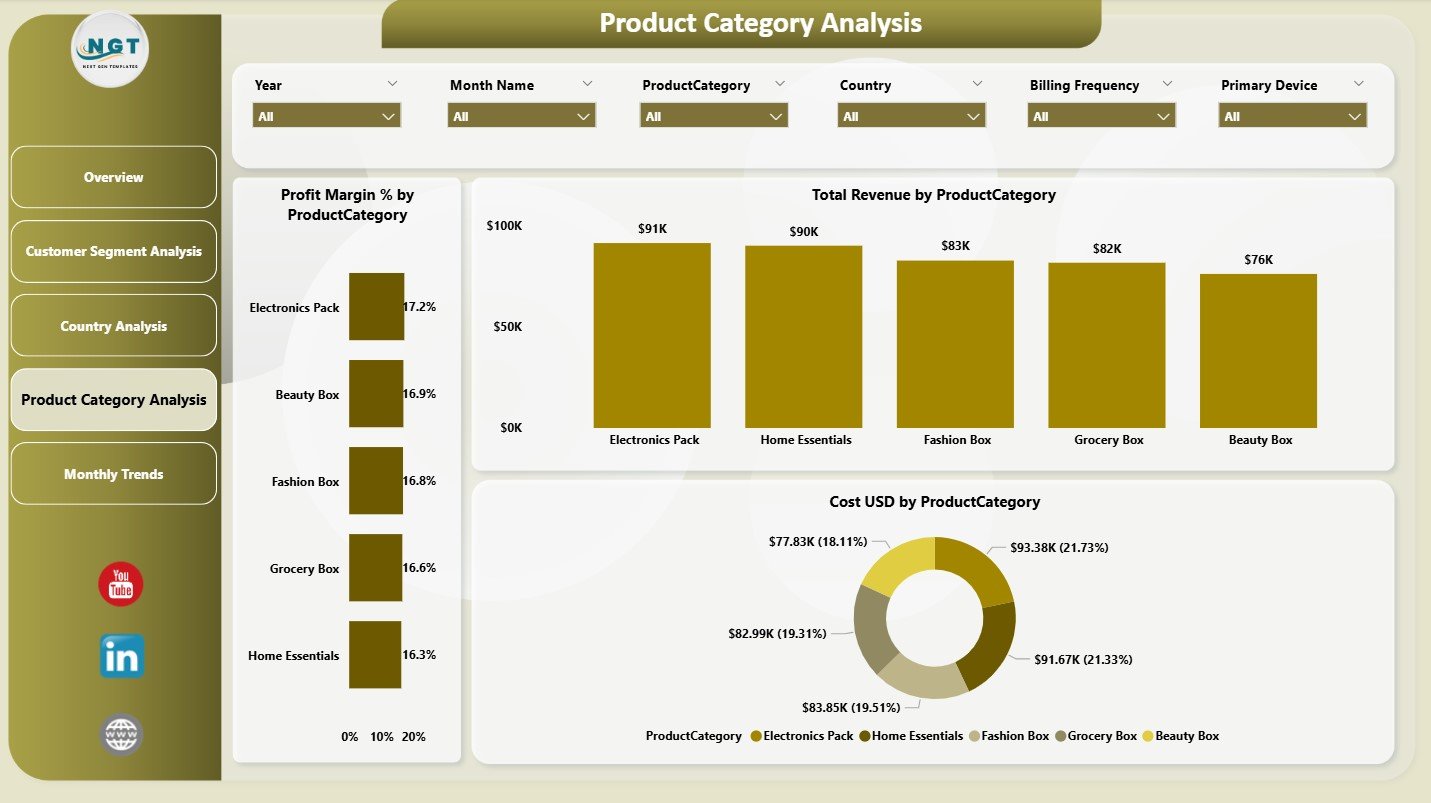
The Product Category Analysis Page focuses on product-level performance.
Charts Available on This Page
-
📈 Profit Margin % by Product Category
-
💵 Total Revenue by Product Category
-
💰 Cost USD by Product Category
This page helps businesses understand which product categories generate the highest margins and which ones require cost optimization.
How Does the Monthly Trends Page Support Strategic Planning?
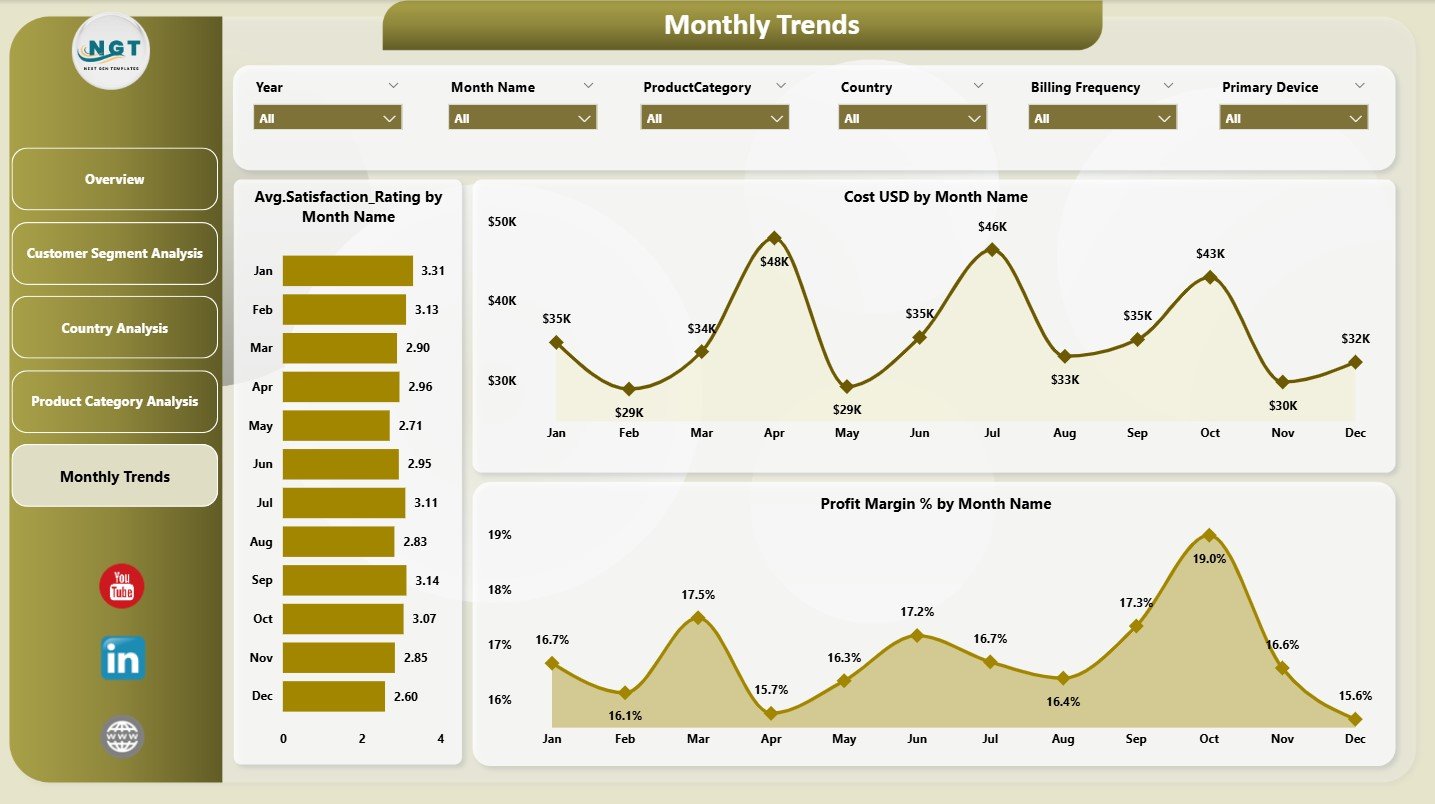
The Monthly Trends Page highlights performance over time, which is critical for forecasting and planning.
Monthly Trend Charts
-
⭐ Average Satisfaction Rating by Month
-
💰 Cost USD by Month
-
📈 Profit Margin % by Month
By analyzing monthly trends, businesses can detect seasonality, identify early warning signs, and plan promotions more effectively.
How Do Slicers Enhance Dashboard Interactivity?
Slicers appear across all pages and allow users to filter data by:
-
Time period
-
Country
-
Customer segment
-
Product category
-
Subscription status
As a result, users can analyze performance from multiple angles without creating new reports.
How Does This Dashboard Improve Subscription Retail Performance?
This dashboard improves performance because it:
-
Centralizes all subscription retail metrics
-
Eliminates manual reporting and guesswork
-
Highlights revenue and profit drivers
-
Improves customer satisfaction tracking
-
Supports faster and smarter decisions
Consequently, leadership teams gain a clear, unified view of the business.
Click to Purchases Subscription-Based Retail Dashboard in Power BI
Advantages of the Subscription-Based Retail Dashboard in Power BI
Below are the key advantages, explained clearly and concisely:
-
📊 All-in-One Performance View – Financial and customer metrics together
-
⏱️ Faster Insights – No dependency on static reports
-
🎯 Better Decision-Making – Clear visual comparisons
-
📈 Trend Visibility – Monthly and category-level trends
-
🔄 Scalable Design – Easy to add new data sources
-
👥 Management-Ready Reporting – Professional Power BI visuals
Opportunities for Improvement in the Dashboard
Even a strong dashboard can evolve further. Possible enhancements include:
-
➕ Subscription cohort analysis
-
➕ Churn reason analysis
-
➕ Customer lifetime value (CLV) tracking
-
➕ Marketing ROI by acquisition channel
-
➕ Predictive churn and revenue forecasting
These additions can elevate the dashboard into an advanced analytics solution.
Best Practices for the Subscription-Based Retail Dashboard in Power BI
To maximize dashboard value, follow these best practices:
-
✅ Keep KPI definitions consistent
-
✅ Review revenue, cost, and profit together
-
✅ Monitor cancellations regularly
-
✅ Analyze trends, not just snapshots
-
✅ Use slicers to focus on specific segments
-
✅ Train teams to interpret insights correctly
By following these practices, businesses ensure reliable insights and smarter decisions.
Who Can Benefit from This Dashboard?
This dashboard benefits a wide range of users, including:
-
Subscription Retail Founders
-
E-commerce Managers
-
Finance & Revenue Teams
-
Marketing Teams
-
Product Managers
-
Business Analysts
Because of its flexible design, both startups and enterprise-level retailers can use it effectively.
Why Choose Power BI for Subscription Retail Dashboards?
Power BI stands out because it offers:
-
Interactive and responsive visuals
-
Advanced filtering and slicing
-
Drill-down and cross-filtering
-
Seamless integration with multiple data sources
Therefore, Power BI becomes an ideal platform for subscription retail analytics.
Conclusion
The Subscription-based Retail Dashboard in Power BI provides a powerful, visual, and data-driven way to manage subscription retail businesses. By combining revenue, cost, profit, discount, cancellation, and satisfaction metrics across multiple analytical dimensions, this dashboard delivers clarity and control.
Moreover, its five-page structure ensures comprehensive coverage of performance while remaining easy to use. When applied with best practices, this dashboard helps subscription retailers grow profitably and sustainably.
Frequently Asked Questions (FAQs)
What is a Subscription-based Retail Dashboard in Power BI?
It is a Power BI dashboard designed to analyze financial, customer, and operational metrics for subscription retail businesses.
Can I customize metrics in this dashboard?
Yes, you can customize KPIs, charts, and dimensions based on business needs.
Does this dashboard support trend analysis?
Yes, it includes a dedicated Monthly Trends page.
Can small subscription businesses use this dashboard?
Yes, it works for startups as well as large subscription retailers.
Does the dashboard help analyze churn?
Yes, it includes cancelled subscription percentage and related insights.
Why is Power BI suitable for subscription retail analytics?
Because Power BI offers interactive visuals, scalability, and professional reporting capabilities.
Click to Purchases Subscription-Based Retail Dashboard in Power BI
Visit our YouTube channel to learn step-by-step video tutorials