In today’s fast-paced retail environment, supermarkets face constant challenges in understanding sales performance, customer preferences, and store efficiency. Power BI, Microsoft’s powerful business intelligence tool, allows supermarket managers to visualize and analyze their data in real-time, making decision-making faster, easier, and more accurate. The Supermarkets Dashboard in Power BI is a comprehensive solution designed to give retailers a complete overview of their operations, helping them optimize performance, reduce costs, and improve customer satisfaction.
In this article, we will explore the key features, advantages, best practices, and detailed analysis of a Supermarkets Dashboard in Power BI. By the end, you will understand how this tool can transform your retail business and provide actionable insights.
Click to Purchases Supermarkets Dashboard in Power BI
What is a Supermarkets Dashboard in Power BI?
A Supermarkets Dashboard in Power BI is an interactive reporting tool that aggregates data from multiple sources, such as sales transactions, product categories, store locations, and customer feedback. Using Power BI, you can visualize key metrics, track trends, and measure performance across different stores, regions, and product categories.
This dashboard is designed to be intuitive and user-friendly, allowing managers, analysts, and executives to make informed decisions quickly. Unlike static reports, it provides real-time insights through interactive charts, cards, and slicers that allow users to filter and drill down into the data.
Key Features of the Supermarkets Dashboard
The Supermarkets Dashboard in Power BI consists of five major pages, each providing unique insights into various aspects of supermarket performance.
1. Overview Page
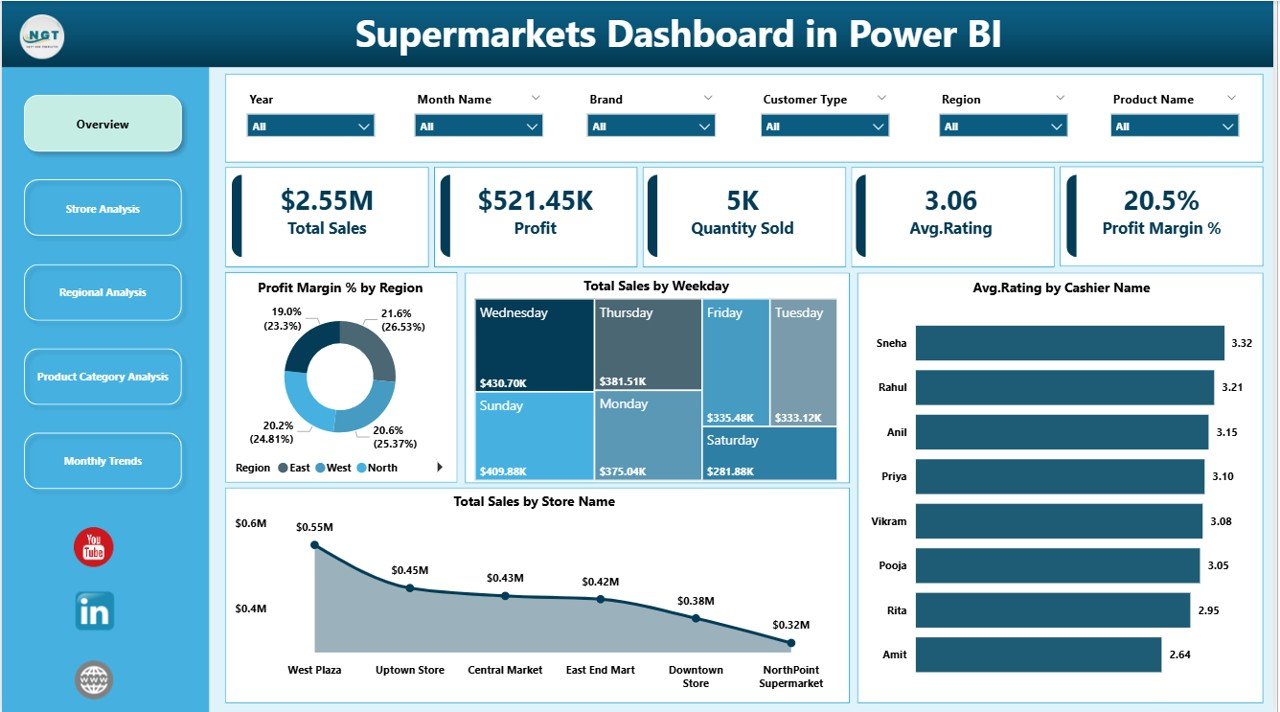
The Overview Page is the central hub of the dashboard. It provides a quick snapshot of overall supermarket performance with the following features:
-
4 Cards displaying key metrics such as total sales, total profit, average rating, and profit margin percentage.
-
Charts for quick insights:
-
Profit Margin % by Region
-
Total Sales by Weekday
-
Average Rating by Cashier Name
-
Total Sales by Store Name
-
This page allows managers to quickly assess overall performance, identify trends, and spot areas needing attention.
2. Store Analysis

The Store Analysis Page focuses on individual store performance. Using this page, managers can:
-
Compare profitability between stores
-
Understand customer feedback trends per store
-
Identify high-performing and underperforming locations
Key visualizations include:
-
Profit Margin % by Store Name
-
Profit by Store Name
-
Average Rating by Store Name
By analyzing store-level data, supermarkets can implement targeted strategies to improve efficiency, enhance customer experience, and maximize revenue.
Click to Purchases Supermarkets Dashboard in Power BI
3. Regional Analysis

The Regional Analysis Page provides a geographic perspective on supermarket performance. It helps identify which regions are performing well and which need attention.
Key metrics displayed include:
-
Total Sales by Region
-
Average Rating by Region
-
Profit by Region
With this insight, supermarket chains can adjust marketing campaigns, inventory allocation, and staffing based on regional performance.
4. Product Category Analysis

Product performance is critical in the retail sector. The Product Category Analysis Page provides insights into which categories drive sales and profit.
Charts include:
-
Total Sales by Product Category
-
Average Rating by Product Category
-
Profit by Product Category
This allows supermarket managers to:
-
Identify best-selling product categories
-
Optimize inventory and promotions
-
Understand customer preferences for specific categories
5. Monthly Trends

The Monthly Trends Page tracks sales and profitability over time, helping retailers understand seasonal trends and business cycles.
Key visualizations include:
-
Total Sales by Month
-
Profit Margin % by Month
-
Profit by Month
By monitoring these trends, supermarkets can plan promotions, adjust pricing strategies, and forecast future sales.
Advantages of a Supermarkets Dashboard in Power BI
Implementing a Supermarkets Dashboard in Power BI provides several benefits for retail businesses:
1. Real-Time Insights
The dashboard provides instant access to updated data, enabling quick decision-making without waiting for static reports.
2. Improved Decision Making
By visualizing data across stores, regions, and product categories, managers can make data-driven decisions that improve profitability and operational efficiency.
3. Enhanced Customer Satisfaction
Monitoring average ratings and feedback per cashier, store, or product category helps identify service gaps and improve customer experience.
4. Better Inventory Management
With insights into product category performance and sales trends, supermarkets can optimize inventory, reducing waste and stockouts.
5. Performance Benchmarking
Store and regional analysis allow supermarkets to benchmark performance and replicate best practices across locations.
6. Time Efficiency
Power BI dashboards save time by consolidating multiple reports into a single interactive platform.
Best Practices for Using a Supermarkets Dashboard
To maximize the value of a Power BI Supermarkets Dashboard, follow these best practices:
1. Keep Data Clean and Updated
Ensure your sales, product, and customer data are accurate and updated regularly to maintain reliable insights.
2. Use Interactive Visuals
Incorporate interactive charts, slicers, and filters to allow users to drill down into specific metrics and areas.
3. Focus on Key Metrics
Highlight KPIs that directly impact profitability and customer satisfaction, such as profit margin, sales trends, and ratings.
4. Segment Data Effectively
Segment data by store, region, product category, and time periods to uncover hidden patterns and trends.
5. Customize for Users
Different stakeholders require different insights. Customize dashboards for store managers, regional managers, and executives.
6. Monitor Trends Over Time
Use the Monthly Trends Page to analyze seasonality and performance over time, supporting better planning and forecasting.
7. Regularly Review and Improve
Regularly review the dashboard to add new KPIs or remove irrelevant ones, ensuring it stays relevant and actionable.
How Can a Supermarkets Dashboard Improve Sales?
A well-designed Supermarkets Dashboard can directly impact sales performance by:
-
Identifying top-selling products and categories
-
Highlighting underperforming stores or regions
-
Allowing managers to adjust promotions and pricing strategies
-
Providing insights into customer preferences and ratings
By analyzing data at multiple levels, supermarkets can create targeted strategies that increase revenue and enhance customer satisfaction.
How Does the Dashboard Help in Operational Efficiency?
Operational efficiency improves when managers have access to real-time performance metrics:
-
Store-level analysis identifies operational bottlenecks
-
Regional analysis supports resource allocation
-
Product analysis ensures inventory is aligned with demand
This reduces waste, improves staffing decisions, and enhances service quality, ultimately leading to better overall efficiency.
Why Power BI is Ideal for Supermarket Dashboards
Power BI offers several advantages for supermarket analytics:
-
Interactive and visual reporting for quick insights
-
Integration with Excel, SQL, and other data sources
-
User-friendly interface for managers and executives
-
Real-time updates for timely decision-making
-
Customizable dashboards to suit unique business needs
With these features, Power BI becomes an indispensable tool for retail analytics.
Tips to Get the Most Out of Your Supermarkets Dashboard
-
Automate Data Collection: Connect Power BI directly to POS systems and inventory databases.
-
Regularly Update KPIs: Ensure metrics reflect current business priorities.
-
Train Users: Provide training for managers to use filters, slicers, and drill-through features.
-
Monitor Customer Feedback: Include customer ratings to improve service quality.
-
Use Conditional Formatting: Highlight areas that need immediate attention, like low sales or high profit margin drops.
Conclusion
Click to Purchases Supermarkets Dashboard in Power BI
A Supermarkets Dashboard in Power BI is a powerful tool that empowers retailers to monitor, analyze, and optimize their operations. From overall performance insights on the Overview Page to detailed store, regional, and product category analysis, this dashboard helps managers make informed, data-driven decisions. By following best practices and focusing on key metrics, supermarkets can boost profitability, improve customer satisfaction, and streamline operations.
Implementing a Power BI dashboard in your supermarket chain is not just a technological upgrade—it is a strategic move towards data-driven retail success.
Frequently Asked Questions (FAQs)
1. What is a Supermarkets Dashboard in Power BI?
It is an interactive reporting tool that visualizes sales, profit, and performance metrics across stores, regions, and product categories.
2. How can a Supermarkets Dashboard improve sales?
It identifies top-selling products, underperforming stores, and trends, enabling targeted strategies to boost revenue.
3. Which metrics are included in the dashboard?
Key metrics include total sales, profit, profit margin %, average rating, sales by store, region, and product category, and monthly trends.
4. Can I customize the dashboard for my supermarket chain?
Yes, Power BI allows you to customize visuals, KPIs, and filters according to your business needs.
5. How often should I update the dashboard?
For real-time insights, data should be updated daily or weekly, depending on your store operations.
6. What are the advantages of using Power BI for supermarket analytics?
Power BI offers interactive visuals, real-time reporting, integration with multiple data sources, and customizable dashboards for different stakeholders.
Visit our YouTube channel to learn step-by-step video tutorials
Click to Purchases Supermarkets Dashboard in Power BI