Managing tax advisory operations involves far more than filing returns or giving advice. You must track cases, monitor consulting fees, analyze penalties avoided, evaluate client satisfaction, and understand performance across industries, cities, tax types, and months. However, when tax data stays scattered across spreadsheets and manual reports, insights arrive late and decisions become reactive.
That is exactly where a Tax Advisory Dashboard in Excel makes a powerful difference.
In this detailed guide, you will learn what a Tax Advisory Dashboard in Excel is, why it matters, how it works, its key features, advantages, best practices, and frequently asked questions. Moreover, this article explains how a ready-to-use Excel dashboard can help tax consultants, advisory firms, finance teams, and compliance professionals gain clarity, control, and confidence.
Click to Purchases Tax Advisory Dashboard in Excel
What Is a Tax Advisory Dashboard in Excel?
A Tax Advisory Dashboard in Excel is a centralized, interactive reporting tool designed to track and analyze key tax advisory metrics using Excel.
Instead of reviewing multiple raw data sheets, this dashboard converts tax data into visual KPIs, charts, and summaries. As a result, decision-makers can quickly understand performance, risks, and opportunities.
Moreover, because the dashboard runs entirely in Excel, it remains easy to use, flexible, and cost-effective. You can update data, refresh pivot charts, and instantly see updated insights without complex software.
Why Do Tax Advisory Firms Need a Dashboard in Excel?
Tax advisory firms manage complex and sensitive data every day. Therefore, they need speed, accuracy, and visibility.
A Tax Advisory Dashboard in Excel helps because:
-
It centralizes all tax advisory data in one place
-
It reduces manual reporting and repetitive work
-
It improves decision-making with visual insights
-
It supports compliance and performance tracking
-
It enhances client service quality
Furthermore, Excel remains familiar to most professionals. As a result, teams adopt the dashboard quickly without training overhead.
How Does a Tax Advisory Dashboard in Excel Work?
The dashboard works by connecting structured data sheets with pivot tables and pivot charts.
Here is how the flow typically works:
-
Data Sheet
All tax advisory data gets recorded in a structured Excel table. This data may include tax type, industry, city, consulting fee, penalty avoided, case duration, satisfaction score, and month. -
Support Sheet
The support sheet handles helper calculations, lookup tables, and intermediate logic. It keeps the dashboard clean and fast. -
Dashboard Pages
The dashboard pages use pivot tables and pivot charts to visualize data dynamically. Slicers control filters such as tax type, industry, city, and month. -
Page Navigator
A page navigator on the left side allows users to jump between pages instantly.
Because everything uses Excel-native features, updates remain simple and reliable.
What Are the Key Features of the Tax Advisory Dashboard in Excel?
This ready-to-use Tax Advisory Dashboard in Excel includes multiple professional features designed for real-world use.
Page Navigator for Easy Navigation
The dashboard includes a Page Navigator located on the left side. This navigator allows users to move between analytical pages with a single click. Therefore, users avoid scrolling and confusion.
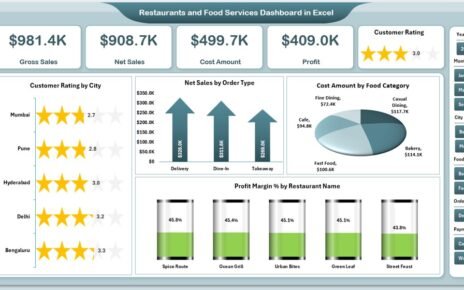
What Does the Overview Page Show?
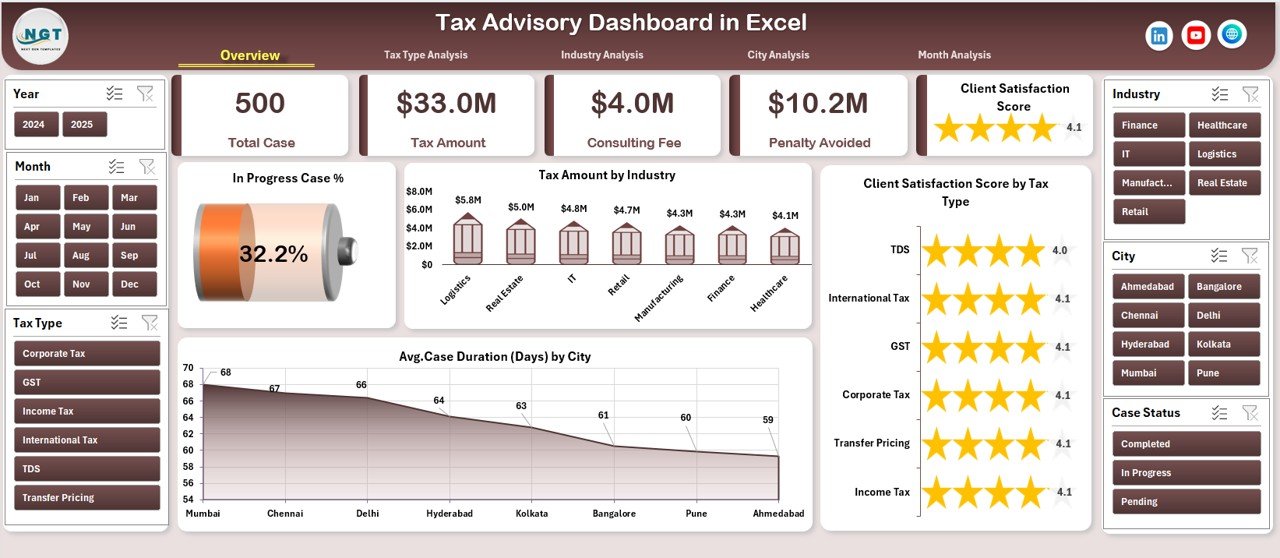
The Overview Page acts as the control center of the dashboard.
Key Elements of the Overview Page
-
Right-side slicer for dynamic filtering
-
Four KPI cards for quick performance checks
-
Four analytical charts for high-level insights
Charts Included on the Overview Page
-
In-Progress Case %
Shows how many cases remain open compared to total cases. -
Tax Amount by Industry
Displays tax exposure or handled tax amounts across industries. -
Client Satisfaction Score by Tax Type
Highlights service quality across different tax categories. -
Average Case Duration by City
Reveals how long cases take to close in different cities.
As a result, decision-makers get an instant snapshot of overall performance.
How Does the Tax Type Analysis Page Help?
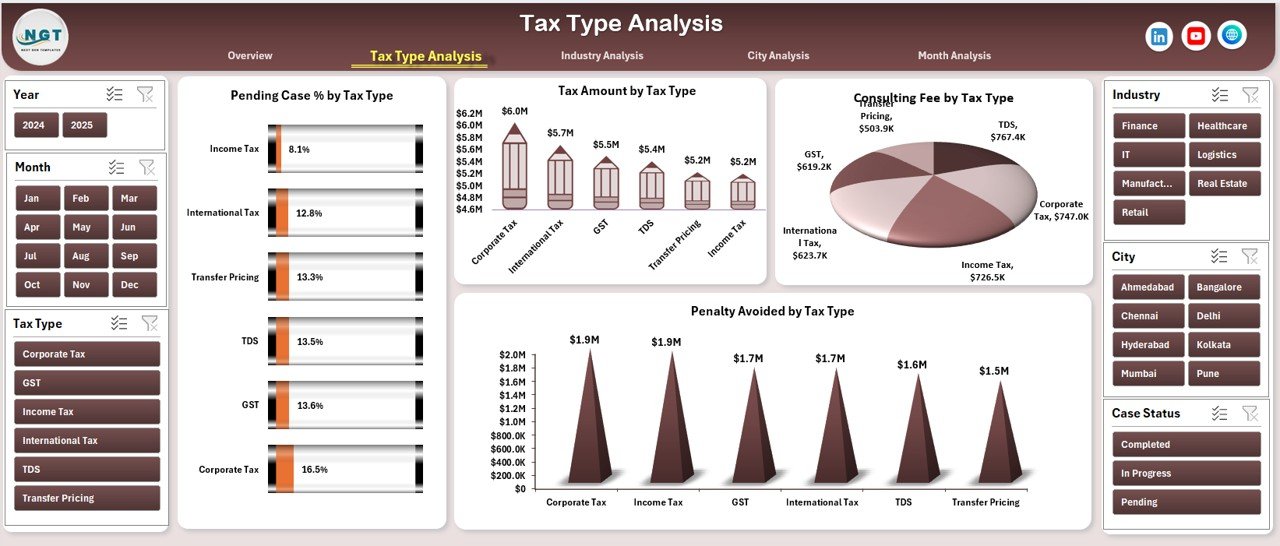
The Tax Type Analysis Page focuses on performance by tax category.
Key Features of the Tax Type Analysis Page
-
Right-side slicer for filtering
-
Four detailed charts
Charts Included
-
Pending Case % by Tax Type
Identifies backlog risk by tax category. -
Tax Amount by Tax Type
Shows tax volume handled per category. -
Consultation Fee by Tax Type
Reveals revenue contribution by tax services. -
Penalty Avoided by Tax Type
Highlights value delivered to clients.
Because of this analysis, firms can optimize services, pricing, and resource allocation.
What Insights Does the Industry Analysis Page Provide?
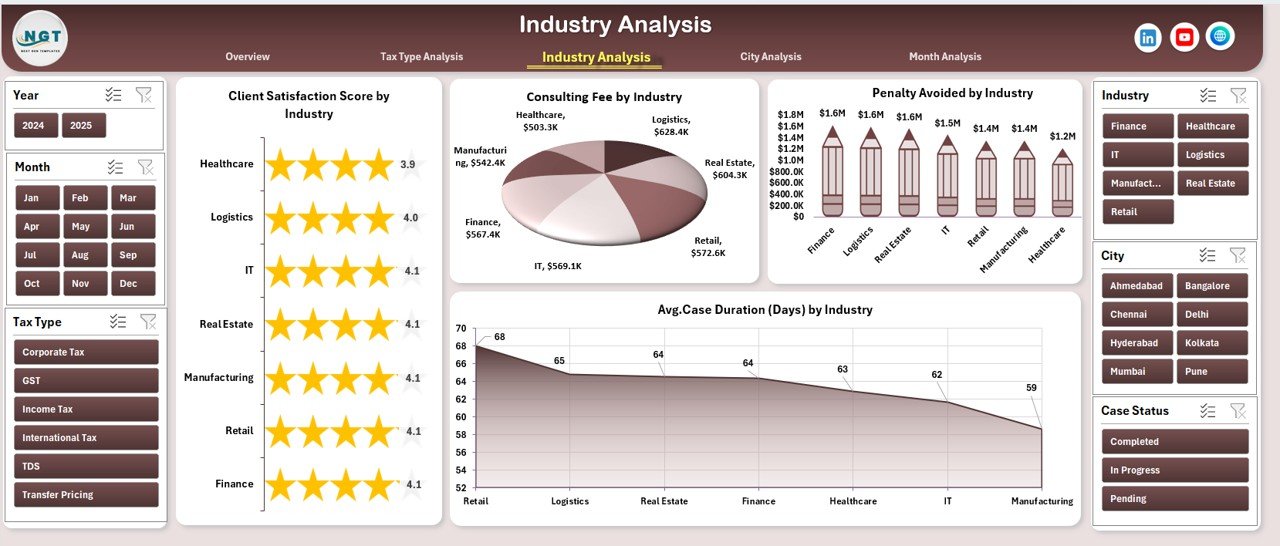
The Industry Analysis Page helps firms understand how different industries perform.
Key Features
-
Right-side slicer
-
Four performance charts
Charts Included
-
Client Satisfaction Score by Industry
Measures service quality across industries. -
Consulting Fee by Industry
Identifies high-revenue industries. -
Penalty Avoided by Industry
Shows value creation by sector. -
Average Case Duration by Industry
Highlights operational efficiency challenges.
Therefore, firms can focus on profitable and efficient industries.
How Does the City Analysis Page Improve Location-Based Decisions?
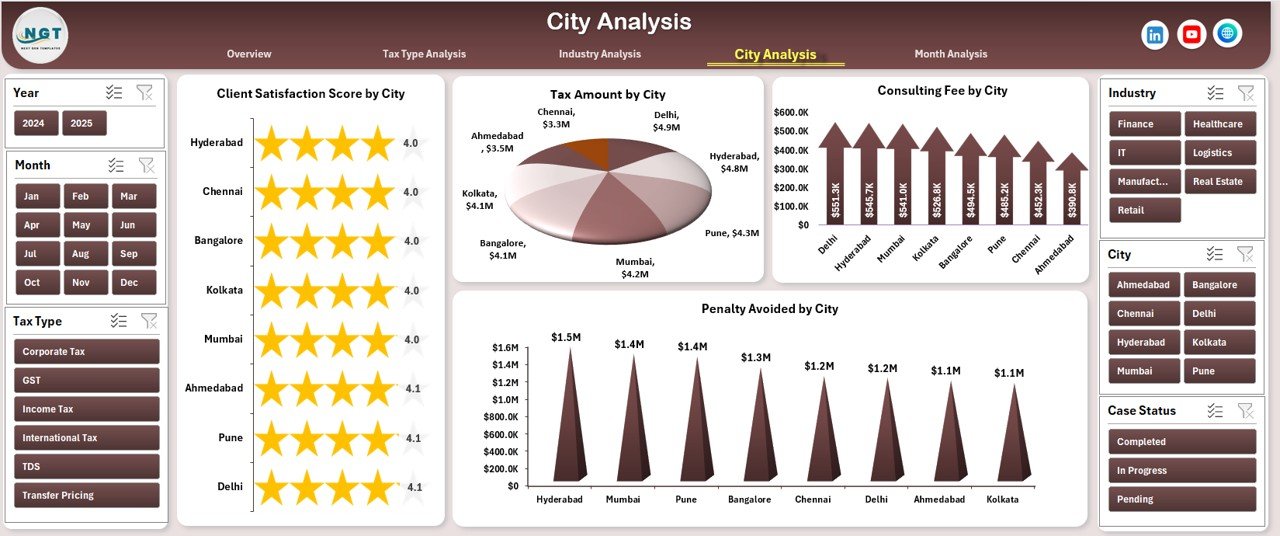
Tax advisory performance often varies by location. Therefore, the City Analysis Page becomes essential.
Key Features
-
Right-side slicer
-
Four city-level charts
Charts Included
-
Client Satisfaction Score by City
Tracks service quality by location. -
Consulting Fee by City
Shows revenue distribution. -
Penalty Avoided by City
Measures financial impact. -
Tax Amount by City
Displays tax exposure or workload.
As a result, firms can identify top-performing cities and areas needing improvement.
What Does the Month Analysis Page Reveal?
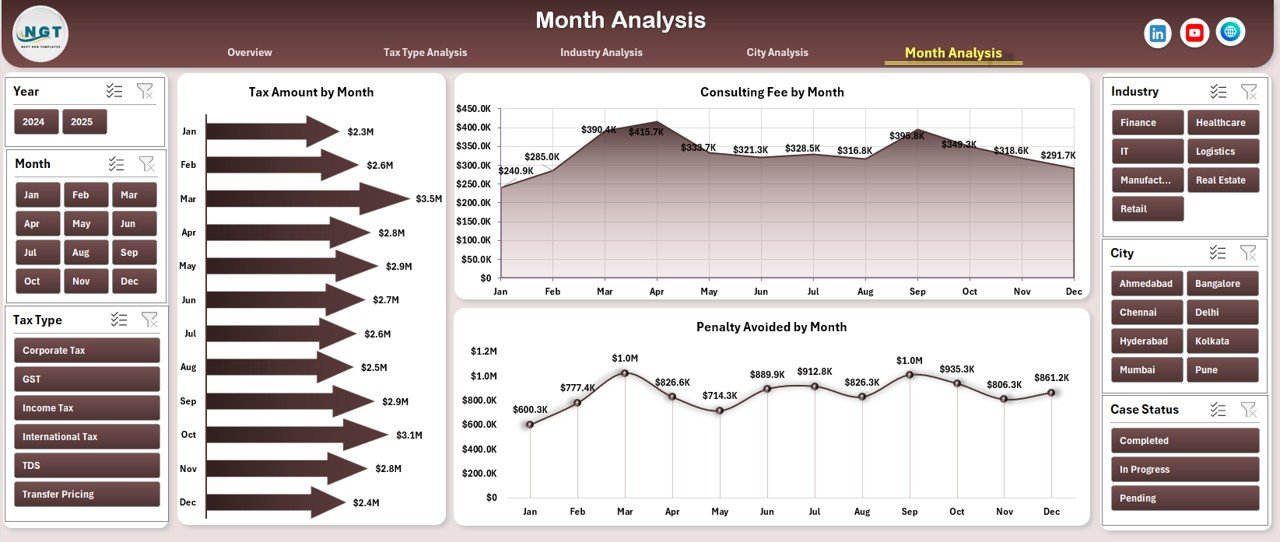
The Month Analysis Page focuses on trends over time.
Key Features
-
Right-side slicer
-
Three monthly trend charts
Charts Included
-
Consulting Fee by Month
Shows revenue trends. -
Penalty Avoided by Month
Highlights value delivery trends. -
Tax Amount by Month
Reveals workload seasonality.
Because of this page, firms can plan resources and forecast demand better.
Click to Purchases Tax Advisory Dashboard in Exce
What Is the Role of the Support Sheet?
The Support Sheet plays a silent but crucial role.
It handles:
-
Lookup tables
-
Calculations
-
Mapping logic
-
Helper formulas
By separating logic from visuals, the dashboard remains fast, clean, and easy to maintain.
What Data Goes into the Data Sheet?
The Data Sheet contains raw tax advisory records. Typically, it includes:
-
Case ID
-
Tax Type
-
Industry
-
City
-
Consulting Fee
-
Tax Amount
-
Penalty Avoided
-
Case Duration
-
Client Satisfaction Score
-
Month
Because the data stays structured, pivot tables work smoothly.
Advantages of a Tax Advisory Dashboard in Excel
Using a Tax Advisory Dashboard in Excel delivers multiple advantages.
Key Advantages
-
Centralized Reporting
All insights stay in one file. -
Time Savings
Automated visuals replace manual reports. -
Better Decision-Making
Visual KPIs highlight risks and opportunities. -
Cost-Effective
No need for expensive BI tools. -
Customizable
Modify charts, KPIs, and layouts easily. -
Improved Client Service
Faster insights lead to better advice.
Who Should Use a Tax Advisory Dashboard in Excel?
This dashboard suits many professionals, such as:
-
Tax advisory firms
-
Chartered accountants
-
Corporate tax teams
-
Compliance officers
-
Financial consultants
-
Practice managers
Because Excel stays widely used, adoption remains simple.
How Can You Customize the Tax Advisory Dashboard?
Customization remains one of the strongest benefits.
You can:
-
Add new KPIs
-
Change chart types
-
Modify slicers
-
Adjust color themes
-
Expand data tables
As a result, the dashboard grows with your business.
Best Practices for the Tax Advisory Dashboard in Excel
Click to Purchases Tax Advisory Dashboard in Exce
Following best practices ensures long-term success.
Best Practices
-
Keep Data Clean
Validate inputs regularly. -
Use Consistent Formats
Standardize dates, currency, and text. -
Limit Manual Edits
Use tables and structured references. -
Refresh Pivot Tables Frequently
Keep insights current. -
Protect Critical Sheets
Prevent accidental changes. -
Document Assumptions
Explain KPI logic clearly.
By following these practices, the dashboard remains reliable and scalable.
Common Mistakes to Avoid
Avoiding common mistakes improves dashboard quality.
-
Overloading with too many charts
-
Using inconsistent data formats
-
Ignoring slicer logic
-
Mixing raw data with visuals
-
Skipping documentation
Instead, keep the dashboard focused and structured.
How Does This Dashboard Improve Strategic Planning?
Strategic planning improves because:
-
Trends become visible
-
Risks appear early
-
High-value services stand out
-
Underperforming areas get attention
Therefore, leadership can act proactively.
Conclusion: Why Is a Tax Advisory Dashboard in Excel a Smart Choice?
A Tax Advisory Dashboard in Excel transforms raw tax data into meaningful insights. It improves visibility, efficiency, and decision-making while remaining simple and affordable.
Because it includes an overview page, tax type analysis, industry analysis, city analysis, and month analysis, it delivers a complete performance picture. Moreover, the page navigator and slicers make navigation effortless.
If you want clarity, control, and confidence in tax advisory operations, this Excel dashboard becomes an essential tool.
Frequently Asked Questions (FAQs)
What Is a Tax Advisory Dashboard in Excel Used For?
A Tax Advisory Dashboard in Excel tracks tax cases, fees, penalties avoided, satisfaction scores, and performance trends using visual charts.
Can Beginners Use a Tax Advisory Dashboard in Excel?
Yes, beginners can use it easily because it relies on Excel pivot tables, slicers, and simple data entry.
Does the Dashboard Require Advanced Excel Skills?
No, users only need basic Excel knowledge. Advanced logic stays hidden in the support sheet.
Can I Add More Pages to the Dashboard?
Yes, you can add new analysis pages by creating additional pivot tables and charts.
How Often Should I Update the Data?
You should update data regularly, such as daily or weekly, depending on business needs.
Is This Dashboard Suitable for Large Tax Firms?
Yes, as long as data stays structured. For very large datasets, Power BI can complement Excel.
Can I Share the Dashboard with My Team?
Yes, you can share the Excel file or use shared drives with proper access control.
Visit our YouTube channel to learn step-by-step video tutorials