Tax advisory services continue to grow more complex every year. Regulations change frequently, client expectations rise, and advisory firms must deliver faster insights with absolute accuracy. Because of this, relying on static spreadsheets or manual reports no longer works. Instead, tax professionals now need smart, interactive, and real-time analytics.
That is exactly where a Tax Advisory Dashboard in Power BI becomes a game-changer.
In this detailed guide, you will learn what a Tax Advisory Dashboard in Power BI is, why it matters, how it works, its key features, advantages, best practices, and common questions. Moreover, this article expands on your existing dashboard structure and explains its business value in a clear and practical way.
Click to Purchases Tax Advisory Dashboard in Power BI
What Is a Tax Advisory Dashboard in Power BI?
A Tax Advisory Dashboard in Power BI is an interactive reporting solution that visualizes tax-related data in one centralized platform. It helps tax advisors, consultants, and firms track tax amounts, case progress, penalties avoided, consulting fees, client satisfaction, and performance trends across industries, cities, tax types, and time periods.
Instead of working with multiple files, Power BI allows you to:
-
Combine data from different sources
-
Analyze performance from multiple perspectives
-
Identify risks and opportunities quickly
-
Make confident, data-driven decisions
Most importantly, the dashboard updates automatically when new data arrives. As a result, tax advisors always work with the latest information.
Why Do Tax Advisory Firms Need a Power BI Dashboard?
Tax advisory firms operate in a highly regulated and time-sensitive environment. Therefore, they must monitor both compliance and profitability at the same time. However, manual reporting slows down insights and increases the risk of errors.
A Tax Advisory Dashboard in Power BI solves these challenges by offering:
-
Real-time visibility into tax cases
-
Clear tracking of tax amounts and penalties avoided
-
Performance measurement across industries and cities
-
Better client satisfaction monitoring
-
Faster reporting for internal and client reviews
Because of this, firms gain a competitive advantage while improving efficiency.
How Does a Tax Advisory Dashboard in Power BI Work?
Power BI connects to your tax advisory data sources such as:
-
Excel files
-
Accounting systems
-
CRM tools
-
ERP platforms
-
Cloud databases
After data integration, Power BI models and visualizes the data using:
-
Cards
-
Bar charts
-
Line charts
-
Filters (slicers)
Users can then interact with the dashboard by selecting industries, cities, tax types, or months. As a result, the visuals change instantly and reveal deeper insights.
Key Features of the Tax Advisory Dashboard in Power BI
Click to Purchases Tax Advisory Dashboard in Power BI
This Tax Advisory Dashboard includes five well-structured analytical pages, each designed to answer specific business questions.
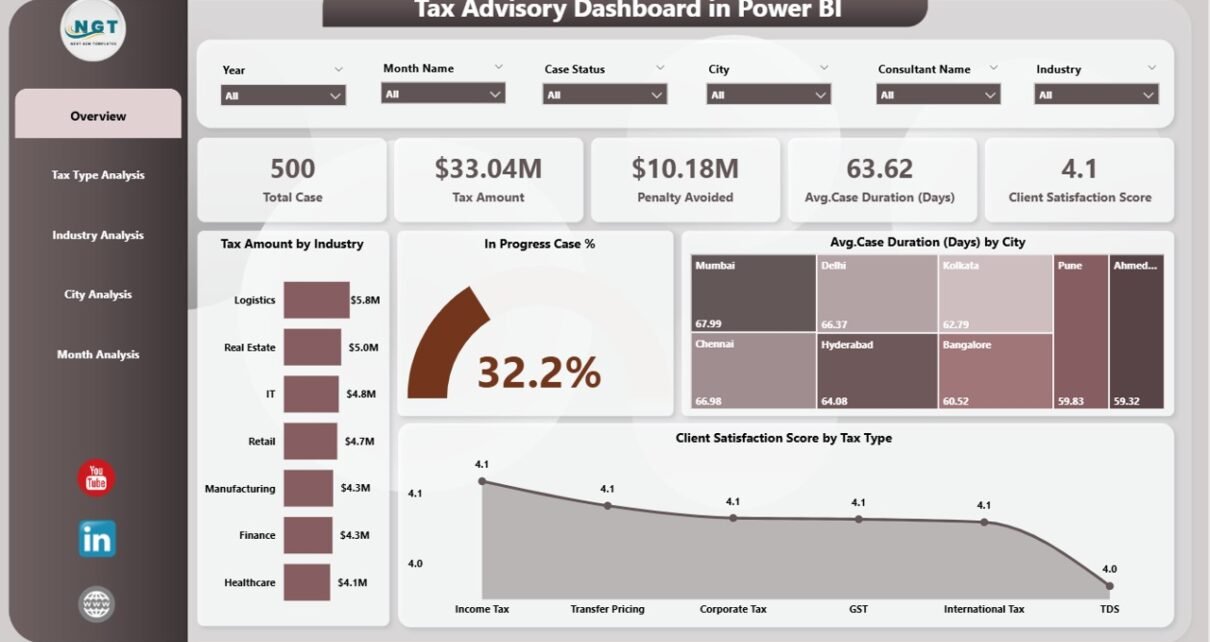
1. Overview Page: What Is the Overall Tax Advisory Performance?
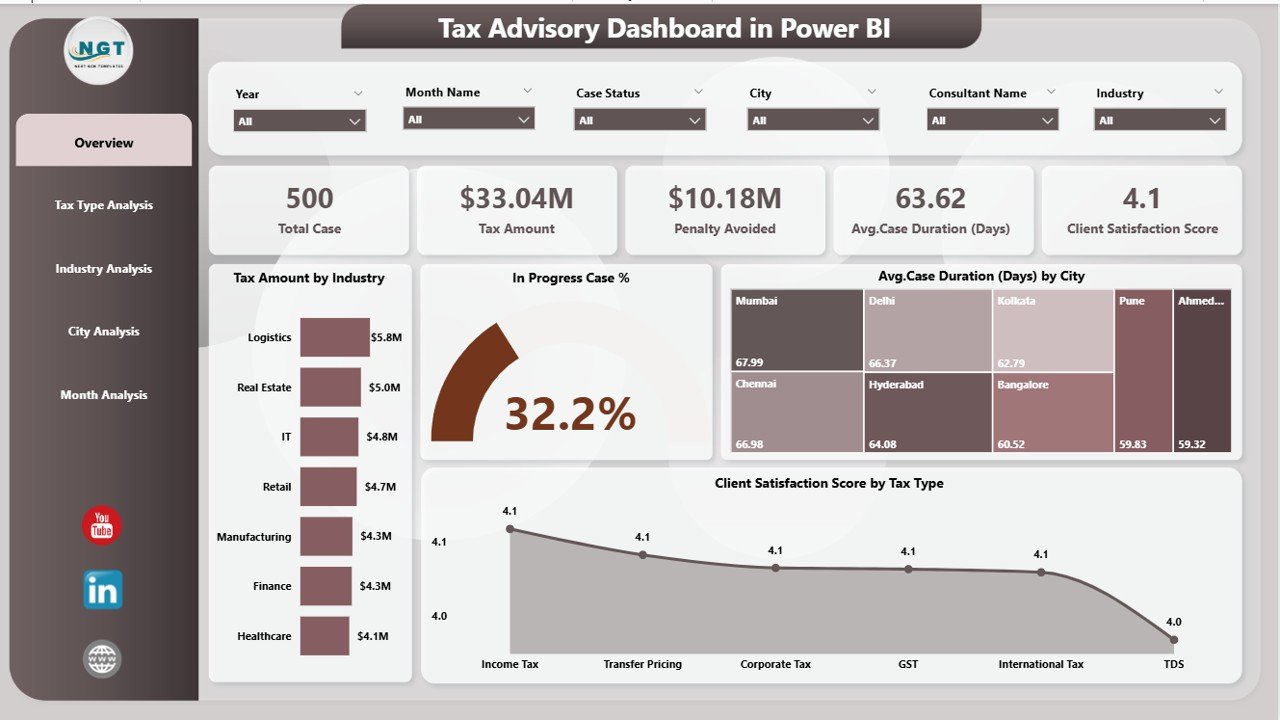
The Overview Page acts as the executive summary of the dashboard. It provides a high-level snapshot of tax advisory performance across all dimensions.
Key Metrics on the Overview Page
-
Tax Amount by Industry
Shows how tax amounts distribute across different industries, helping advisors focus on high-value sectors. -
In-Progress Case %
Highlights the percentage of ongoing tax cases, which supports workload and capacity planning. -
Average Case Duration by City
Reveals how long cases take to close in each city, making it easier to identify bottlenecks. -
Client Satisfaction Score by Tax Type
Measures client experience across different tax services, helping improve service quality.
Why the Overview Page Matters
Because decision-makers need quick insights, this page delivers clarity at a glance. Moreover, slicers allow users to drill down further without leaving the page.
2. Tax Type Analysis: Which Tax Services Drive Value?
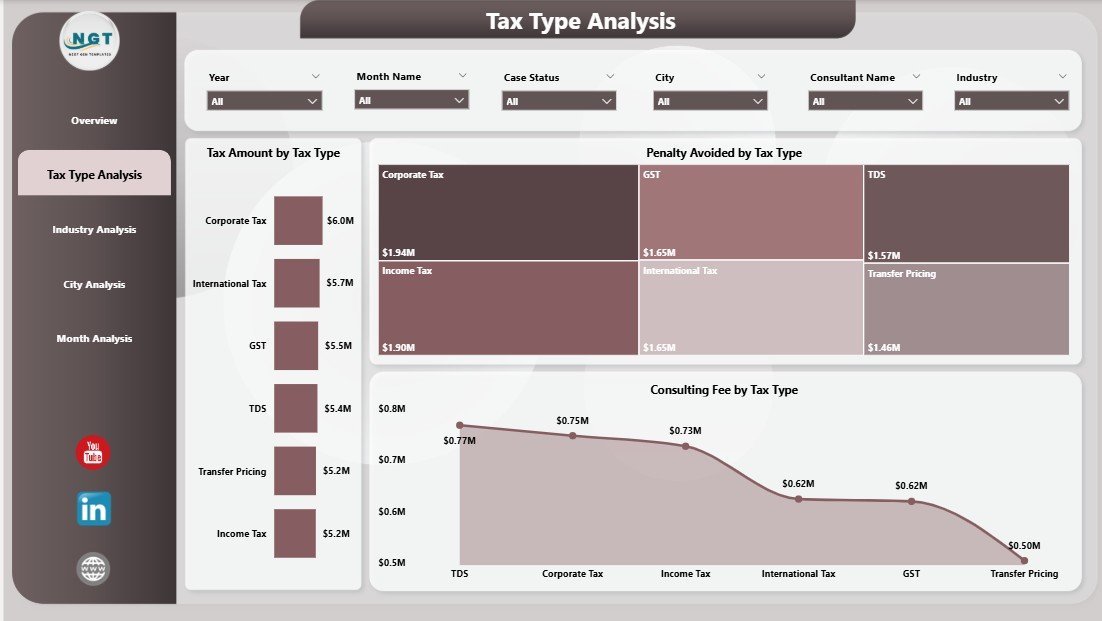
The Tax Type Analysis Page focuses on performance across different tax categories such as income tax, GST, corporate tax, or international tax.
Key Charts on the Tax Type Analysis Page
-
Tax Amount by Tax Type
Shows revenue contribution by tax service. -
Penalty Avoided by Tax Type
Highlights how much money clients save due to advisory expertise. -
Consulting Fee by Tax Type
Tracks advisory income and profitability by service line.
Business Impact of Tax Type Analysis
This page helps firms identify:
-
High-performing tax services
-
Tax types that generate maximum client savings
-
Areas where pricing or resource allocation needs improvement
As a result, firms can refine their service portfolio strategically.
3. Industry Analysis: Which Industries Perform Best?
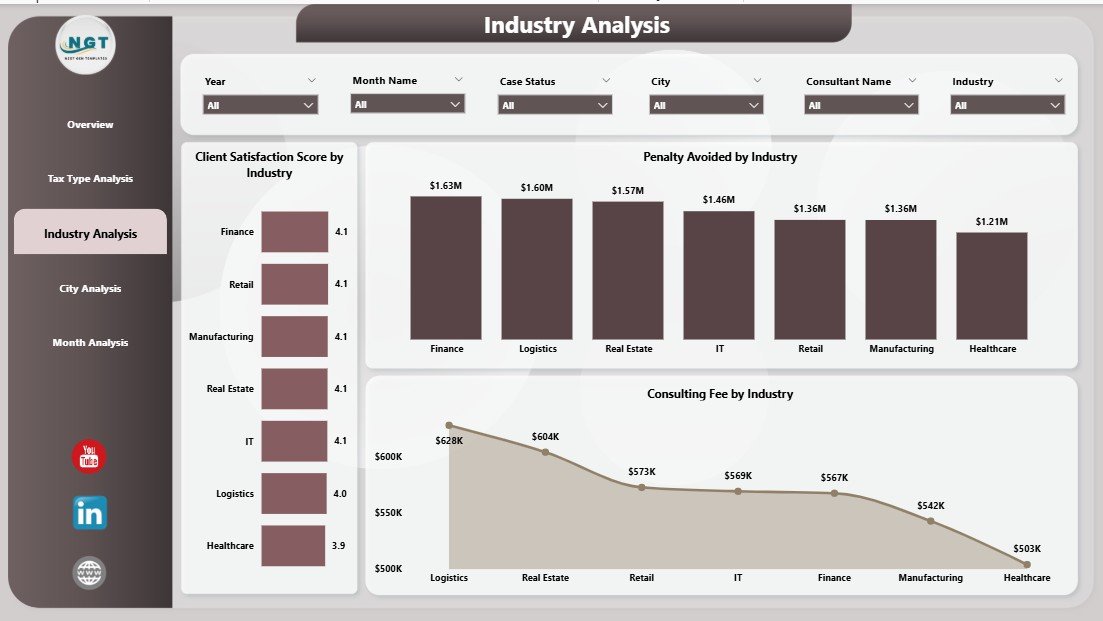
Different industries face different tax challenges. Therefore, understanding industry-level performance becomes critical.
Key Charts on the Industry Analysis Page
-
Client Satisfaction Score by Industry
Measures how happy clients feel across sectors. -
Penalty Avoided by Industry
Shows the financial value delivered to each industry. -
Consulting Fee by Industry
Highlights revenue contribution from different industries.
Why Industry Analysis Is Important
This analysis helps tax advisors:
-
Focus on high-growth industries
-
Customize advisory strategies
-
Identify underperforming sectors
-
Improve client retention
Consequently, firms can align expertise with market demand.
Click to Purchases Tax Advisory Dashboard in Power BI
4. City Analysis: How Does Location Impact Tax Advisory Performance?
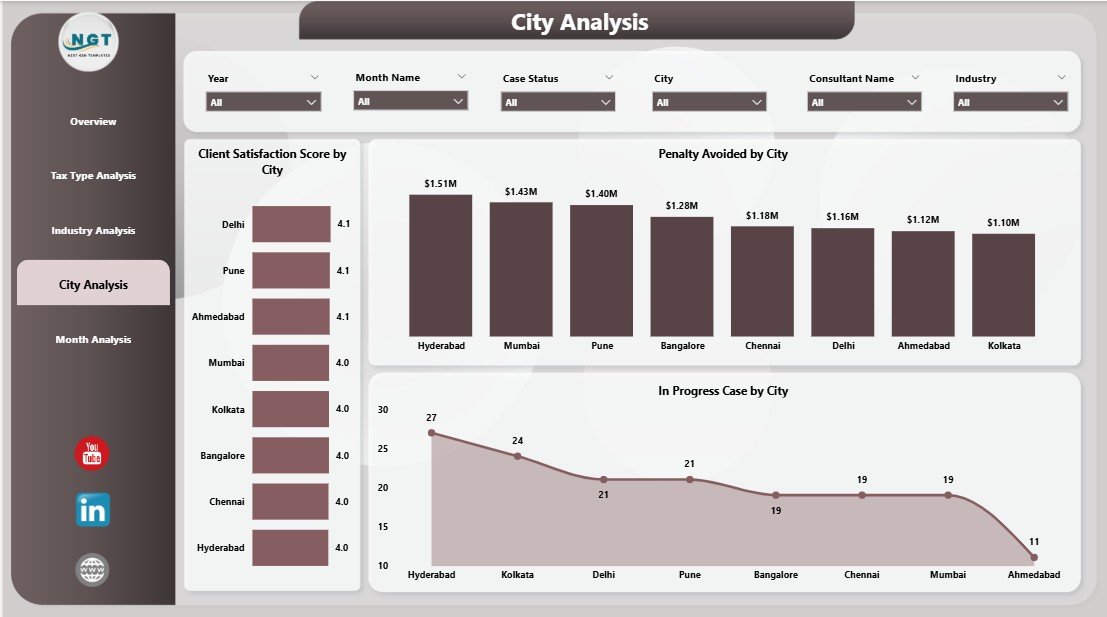
Geographical analysis plays a major role in understanding regional performance differences.
Key Charts on the City Analysis Page
-
Client Satisfaction Score by City
Shows how clients perceive services in each location. -
Penalty Avoided by City
Highlights advisory value delivered region-wise. -
Consulting Fee by City
Tracks revenue contribution by city.
Value of City-Level Insights
Because regulations and client behavior vary by region, this page helps firms:
-
Optimize branch performance
-
Allocate senior consultants effectively
-
Improve regional service quality
As a result, leadership can make smarter location-based decisions.
5. Month Analysis: How Does Performance Change Over Time?
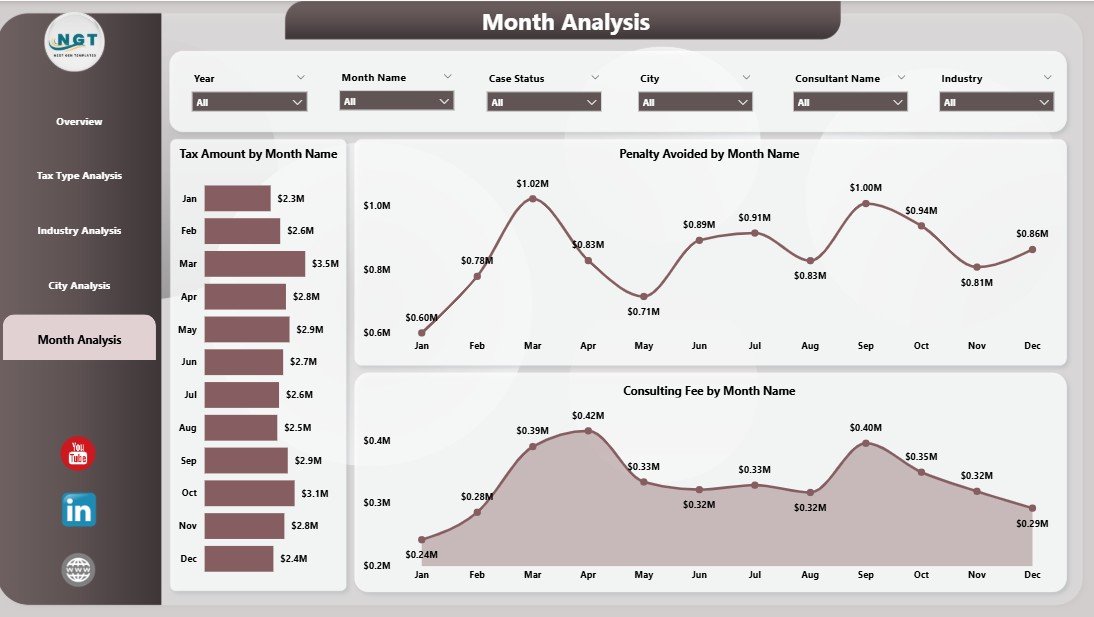
The Month Analysis Page tracks trends and seasonality across the year.
Key Charts on the Month Analysis Page
-
Tax Amount by Month
Identifies peak tax filing periods. -
Penalty Avoided by Month
Highlights months with higher advisory impact. -
Consulting Fee by Month
Shows revenue trends and seasonality.
Why Time-Based Analysis Matters
This page supports:
-
Forecasting future workload
-
Planning staffing levels
-
Identifying seasonal opportunities
-
Monitoring performance growth
Therefore, firms stay proactive instead of reactive.
Advantages of a Tax Advisory Dashboard in Power BI
Why Should You Use a Tax Advisory Dashboard?
Using a Tax Advisory Dashboard in Power BI delivers multiple advantages:
-
📊 Centralized Reporting
All tax metrics stay in one place, which saves time and effort. -
⚡ Faster Decision-Making
Real-time insights eliminate delays. -
🎯 Improved Client Satisfaction
Better tracking leads to better service quality. -
💰 Higher Profitability
Visibility into fees and penalties avoided improves pricing strategies. -
🔍 Deep Data Exploration
Interactive filters reveal hidden patterns. -
🔐 Better Compliance Monitoring
Clear tracking reduces compliance risks.
Because of these benefits, Power BI dashboards have become essential for modern tax advisory firms.
Best Practices for the Tax Advisory Dashboard in Power BI
How Can You Build and Use It Effectively?
To get the best results, follow these proven best practices:
1. Define Clear KPIs First
Always identify key tax metrics before building visuals.
2. Use Consistent Naming Conventions
Standardized labels improve clarity and reduce confusion.
3. Keep Visuals Simple and Clean
Avoid clutter and focus on readability.
4. Leverage Slicers Strategically
Filters for tax type, city, industry, and month enhance usability.
5. Automate Data Refresh
Scheduled refresh ensures up-to-date insights.
6. Validate Data Regularly
Accurate data builds trust in the dashboard.
7. Train Users Properly
A well-trained team extracts maximum value.
Following these best practices ensures long-term dashboard success.
Who Can Benefit from a Tax Advisory Dashboard in Power BI?
This dashboard suits a wide range of professionals:
-
Tax consultants and advisors
-
Accounting and audit firms
-
CFOs and finance leaders
-
Compliance managers
-
Advisory partners
-
Business analysts
Because the dashboard adapts easily, both small firms and large enterprises can use it effectively.
How Does This Dashboard Improve Client Relationships?
Click to Purchases Tax Advisory Dashboard in Power BI
Strong client relationships drive long-term success in tax advisory services. A Power BI dashboard supports this by:
-
Showing measurable value delivered
-
Tracking satisfaction scores
-
Demonstrating penalties avoided
-
Providing transparent reporting
As a result, clients gain confidence and trust in advisory services.
How Can You Customize the Tax Advisory Dashboard?
Power BI allows extensive customization, including:
-
Adding new KPIs
-
Changing visuals
-
Applying custom branding
-
Integrating additional data sources
-
Creating role-based access
Therefore, the dashboard evolves as business needs grow.
Future of Tax Advisory Analytics with Power BI
As tax regulations become more digital, analytics will play a bigger role. Power BI dashboards will increasingly support:
-
Predictive tax insights
-
AI-driven anomaly detection
-
Automated compliance alerts
-
Advanced forecasting
Because of this, early adoption provides a strong competitive edge.
Conclusion: Is a Tax Advisory Dashboard in Power BI Worth It?
Yes, absolutely.
A Tax Advisory Dashboard in Power BI transforms how tax firms manage data, track performance, and deliver value. It replaces manual reporting with real-time insights, improves decision-making, enhances client satisfaction, and boosts profitability.
By leveraging structured pages like Overview, Tax Type Analysis, Industry Analysis, City Analysis, and Month Analysis, firms gain a complete view of their advisory operations. When combined with best practices, this dashboard becomes a powerful strategic tool rather than just a reporting solution.
Frequently Asked Questions (FAQs)
What is the main purpose of a Tax Advisory Dashboard in Power BI?
The main purpose is to provide real-time, interactive insights into tax performance, cases, penalties avoided, fees, and client satisfaction.
Can small tax firms use this dashboard?
Yes, Power BI dashboards scale easily and work well for both small and large firms.
Does Power BI require coding skills?
No, Power BI uses a user-friendly interface. Basic training is enough for most users.
How often does the dashboard update?
The dashboard updates based on your data refresh schedule, which can run daily or even hourly.
Can this dashboard support multiple tax types?
Yes, the dashboard supports analysis across multiple tax categories.
Is client data secure in Power BI?
Yes, Power BI includes enterprise-grade security and role-based access controls.
Can I export reports for clients?
Yes, Power BI allows exporting reports in PDF, PowerPoint, and other formats.
How long does it take to implement a Tax Advisory Dashboard?
Implementation time depends on data readiness, but many dashboards go live within days.
Visit our YouTube channel to learn step-by-step video tutorials