In the modern education sector, data plays a critical role in improving training efficiency, optimizing funding, and ensuring quality outcomes. Managing vast amounts of information from different training programs, institutes, and funding sources can be challenging — but with the Teacher Training Institutes Dashboard in Excel, everything becomes simple and visual.
This ready-to-use Excel template helps educational administrators, trainers, and policymakers analyze costs, trainee performance, and satisfaction levels in one interactive interface. Whether you’re managing a single institute or a network of training centers, this dashboard provides the insights needed for data-driven decisions.
Click to Purchases Teacher Training Institutes Dashboard in Excel
Key Features of the Dashboard
Page Navigator
The left-side navigation panel allows users to switch seamlessly between analytical pages. You can explore overall metrics, drill down into course or institute performance, and review monthly trends without scrolling through multiple sheets.
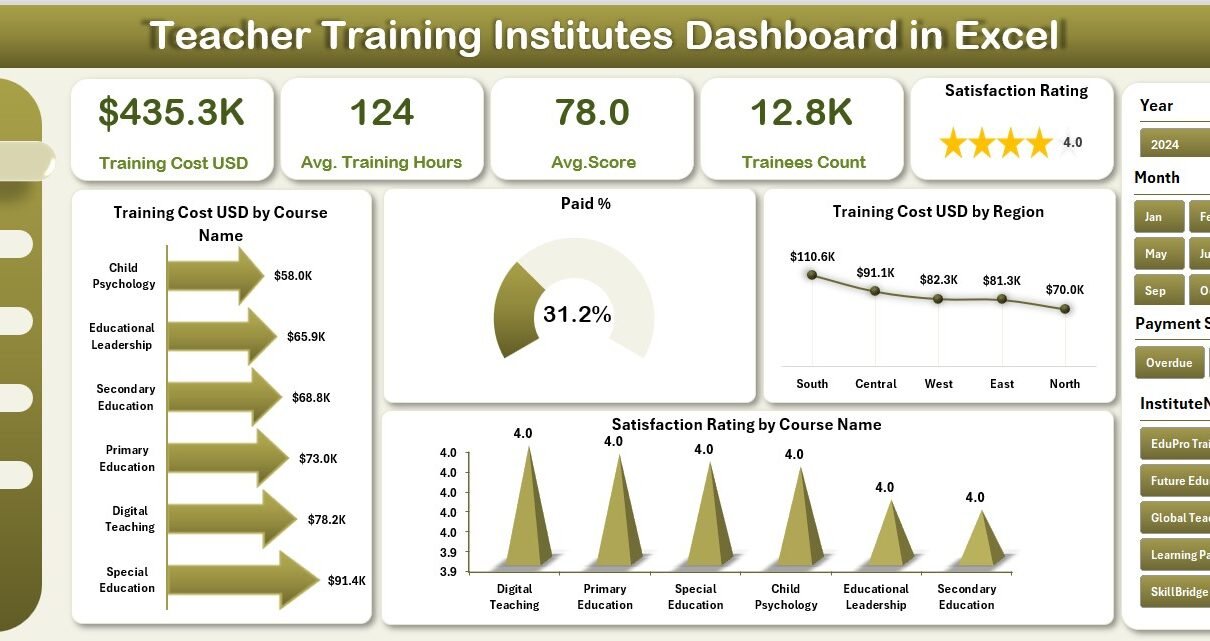
1. Overview Page
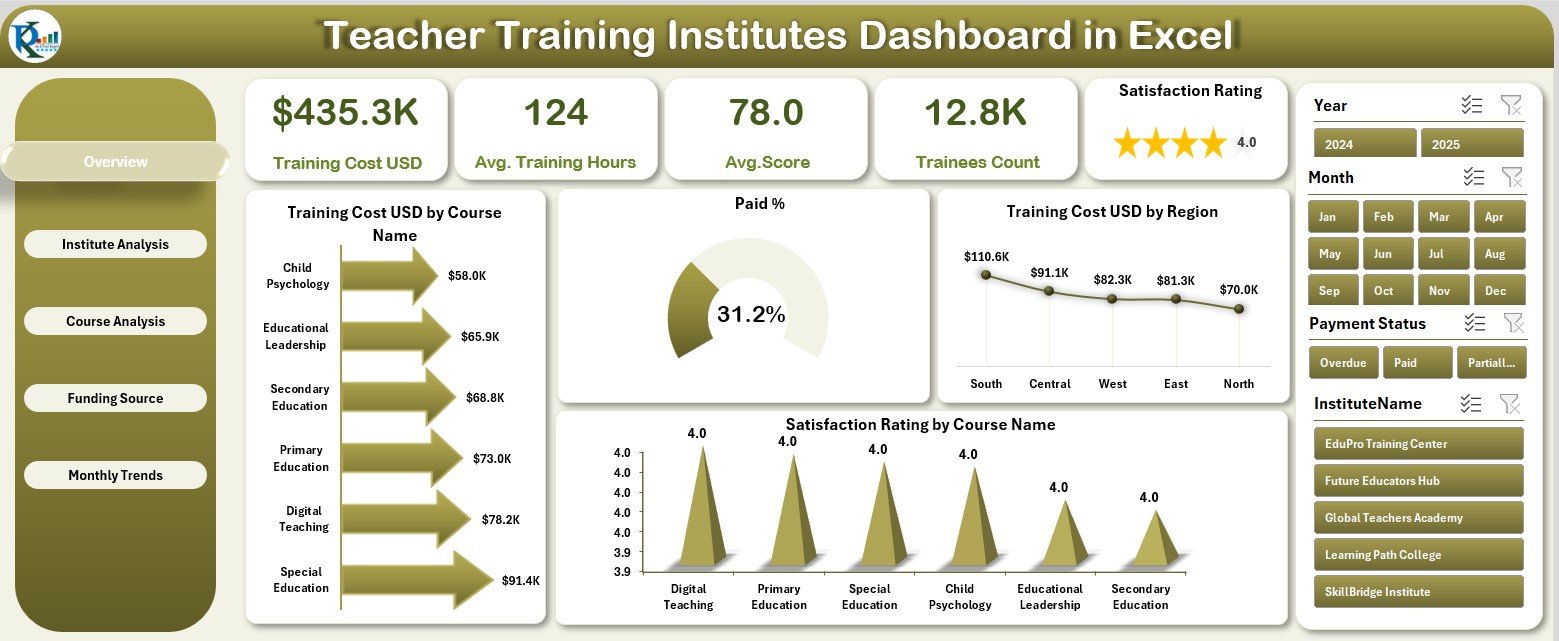
The Overview Page acts as the central hub for quick insights. It displays:
-
Five KPI Cards summarizing performance highlights
-
Charts for:
-
Training Cost (USD) by Course Name
-
Paid %
-
Training Cost (USD) by Region
-
Satisfaction Rating by Course Name
-
With this, administrators can instantly identify high-cost courses, regional performance differences, and satisfaction trends.
2. Institute Analysis
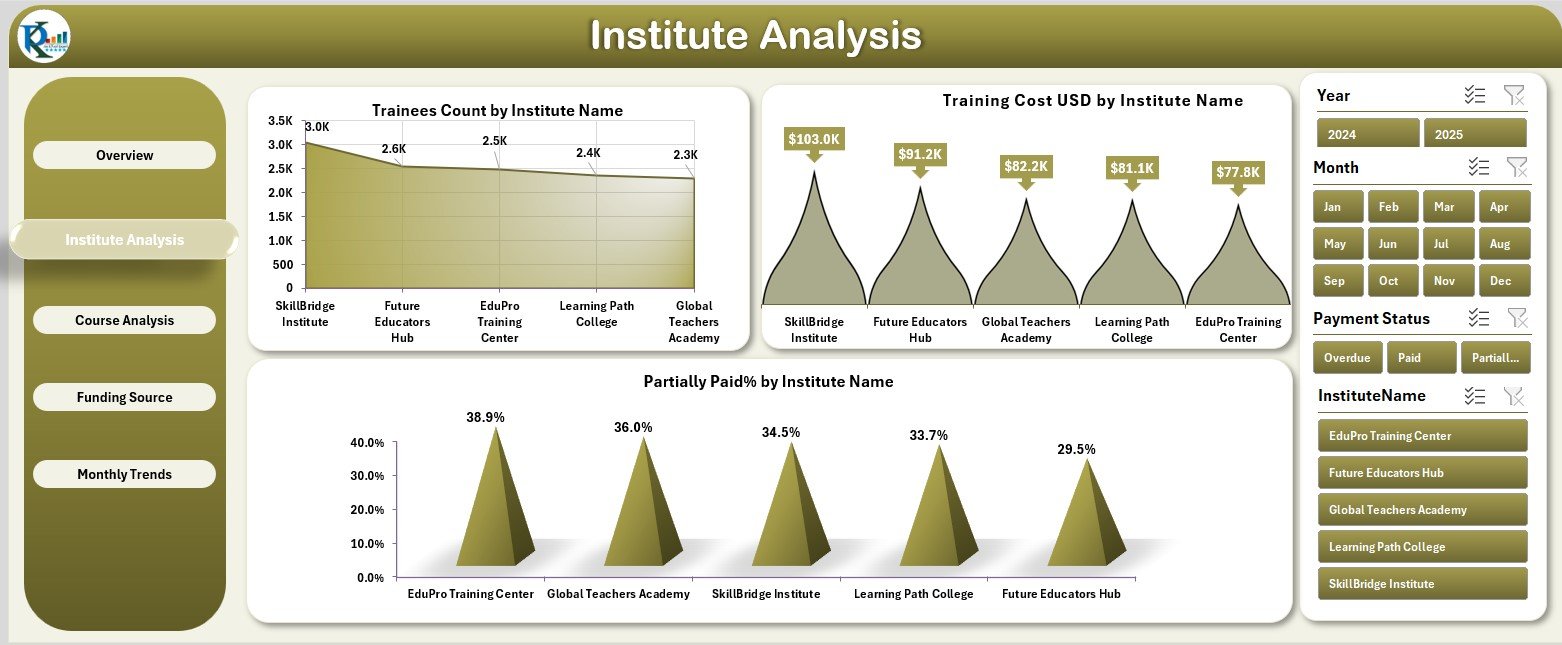
Analyze the performance of different teacher-training institutes through visual charts showing:
-
Trainees Count by Institute Name
-
Training Cost (USD) by Institute Name
-
Partially Paid % by Institute Name
This page highlights which institutes are performing well and which may require further financial or administrative support.
3. Course Analysis
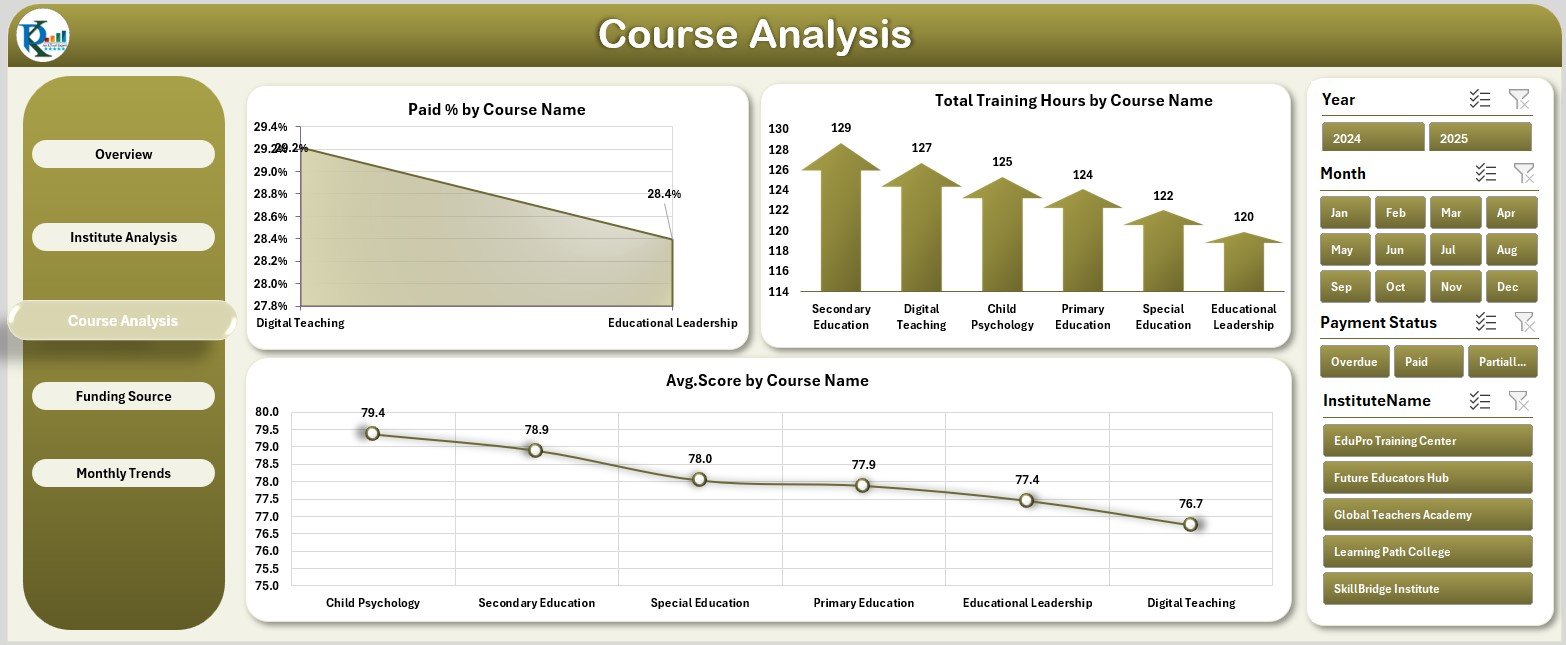
The Course Analysis Page focuses on performance by course type, including:
-
Cost Paid % by Course Name
-
Total Training Hours by Course Name
-
Average Score by Course Name
This helps identify which courses deliver maximum value and which need content or delivery improvements.
4. Funding Source Analysis
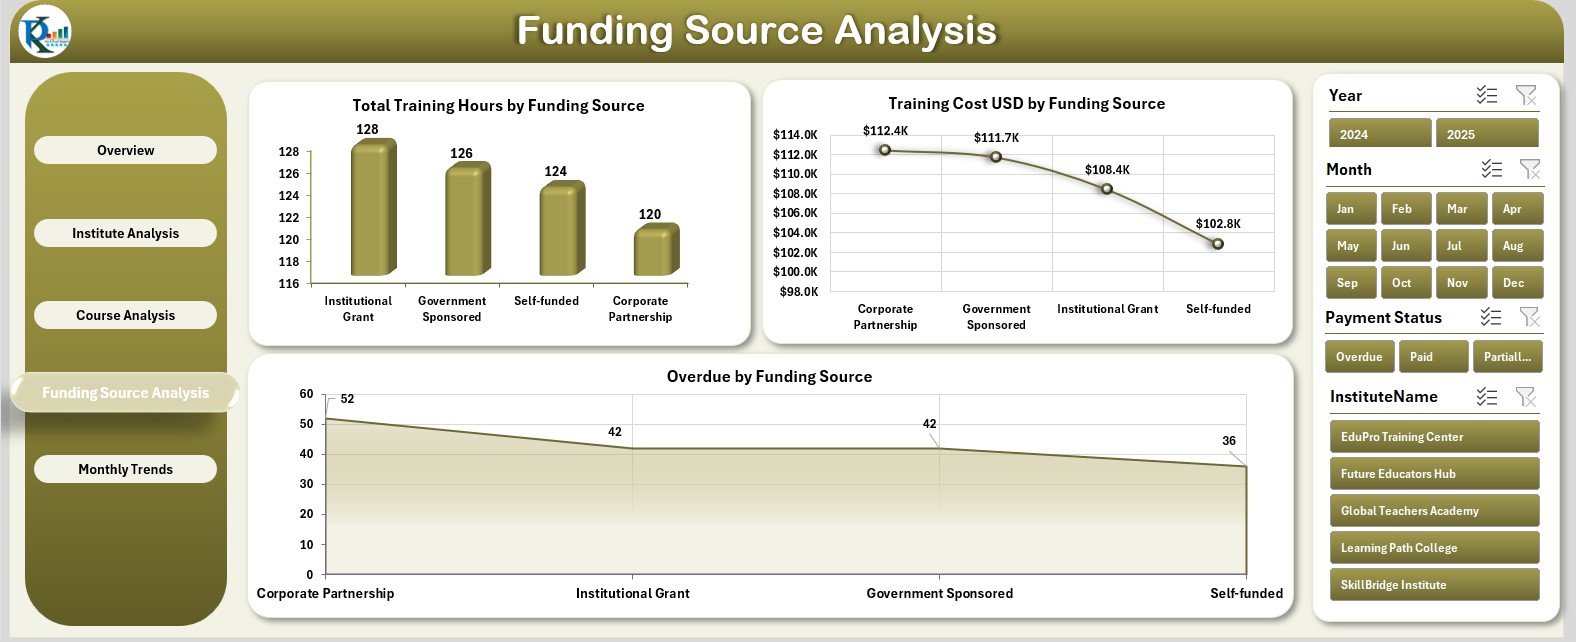
Training programs often depend on multiple funding channels. This page includes:
-
Total Training Hours by Funding Source
-
Training Cost (USD) by Funding Source
-
Overdue by Funding Source
It ensures transparency in fund utilization and helps track overdue or pending amounts.
5. Monthly Trends
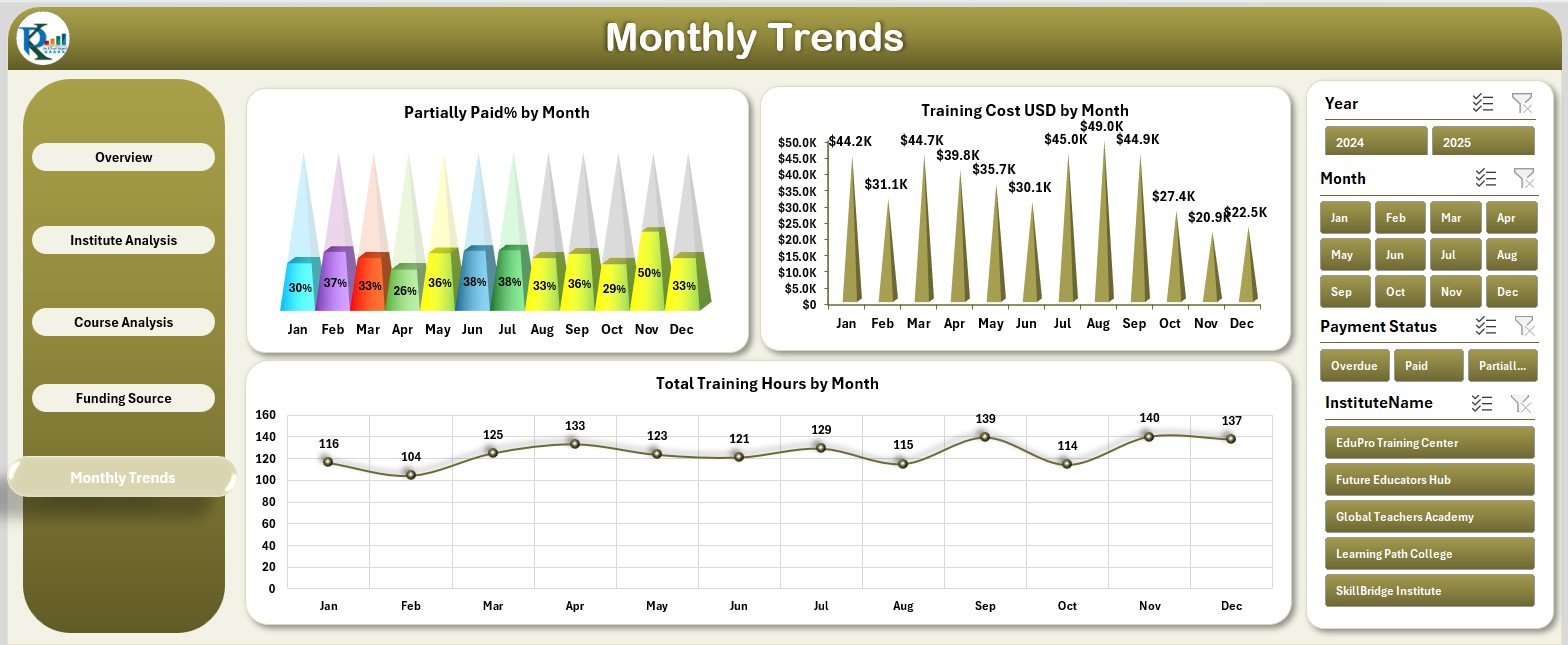
The Monthly Trends Page visualizes how training activities evolve throughout the year with:
-
Partially Paid % by Month
-
Training Cost (USD) by Month
-
Total Training Hours by Month
This makes it easy to identify seasonal variations in training activity and manage resource allocation.
Support Sheet
Contains reference data such as funding source lists, course names, and validation tables for dropdowns and slicers.
Data Sheet
The core of the dashboard — this is where all raw training, financial, and performance data resides. Updating it refreshes all visuals automatically.
Click to Purchases Teacher Training Institutes Dashboard in Excel
Why Use Excel for a Teacher Training Institutes Dashboard
Many organizations invest heavily in complex software, but Excel remains a powerful, flexible, and cost-effective solution.
Here’s why this dashboard works so well in Excel:
-
No coding or add-ons required
-
Full control over data and structure
-
Dynamic visuals with slicers and charts
-
Easy sharing via OneDrive or Teams
-
Customizable to your KPIs and metrics
This makes it suitable for institutions of all sizes — from local teacher training centers to national education boards.
Advantages of the Teacher Training Institutes Dashboard in Excel
1. Centralized Performance Monitoring
Bring all your data — costs, trainee counts, satisfaction scores, and more — into one view.
2. Simplified Reporting
Automatically generate visuals and summaries, saving hours of manual data compilation.
3. Cost Transparency
Easily see how funds are spent across institutes, regions, or programs.
4. Actionable Insights
Identify training gaps, underperforming courses, or budget overruns instantly.
5. Real-Time Updates
When new data is added to the Data Sheet, all visuals refresh automatically.
6. Better Decision-Making
Data-driven analytics help allocate funds, design better programs, and improve educational impact.
Opportunities for Improvement
While this dashboard provides comprehensive insights, you can enhance it further by:
-
Adding macros to automate imports and reports
-
Integrating with cloud storage for live collaboration
-
Using trainer-level filters for detailed performance tracking
-
Including trend forecasts for predictive planning
-
Enhancing visuals with icons and conditional formatting
Best Practices for Using the Dashboard
-
Keep data clean and consistent.
Use standardized names and avoid duplicate entries. -
Refresh regularly.
Update the data sheet weekly or after each training session. -
Protect formulas.
Lock calculation cells to prevent errors. -
Validate inputs.
Use dropdowns for courses, institutes, and funding sources. -
Backup your data.
Maintain historical records for audits and analysis. -
Customize visuals.
Adjust chart titles and slicers to match your audience.
Who Can Use This Dashboard
-
Institute Administrators: Monitor training and financial KPIs.
-
Training Coordinators: Analyze course success rates.
-
Policy Makers: Evaluate program reach and funding effectiveness.
-
Finance Teams: Track costs, payments, and overdue amounts.
-
Educators: Review course feedback and satisfaction trends.
How to Use the Dashboard
-
Enter all training data in the Data Sheet.
-
Navigate through pages using the left-side panel.
-
Use slicers to filter by course, region, or institute.
-
Review summary cards for quick KPIs.
-
Explore charts for deeper analysis.
-
Use trends to plan future training schedules.
Conclusion
The Teacher Training Institutes Dashboard in Excel is more than a spreadsheet — it’s a complete analytical solution for educational administrators. It simplifies data tracking, enhances transparency, and helps institutes make informed, data-driven decisions.
By combining automation, interactivity, and visualization, this Excel dashboard transforms raw data into insights that improve training quality, optimize resource use, and ensure better outcomes for educators and learners alike.
Click to Purchases Teacher Training Institutes Dashboard in Excel
Frequently Asked Questions (FAQs)
1. What is the main purpose of this dashboard?
It helps monitor training performance, cost, and satisfaction across multiple institutes and courses.
2. Can I add new KPIs or charts?
Yes. The template is fully editable and can include additional charts or KPIs.
3. Does it need any special Excel version?
It works best with Excel 2016 or later, ensuring slicer and chart compatibility.
4. Is any coding or VBA required?
No — it functions using Excel formulas and pivot tables. VBA is optional for automation.
5. Can I track multiple institutes or regions?
Yes, the dashboard includes institute- and region-wise analytics.
6. How do I update the dashboard?
Simply replace or append data in the Data Sheet — all visuals update automatically.
7. Is trainee feedback supported?
Yes. Satisfaction ratings can be tracked by course and visualized on the Overview Page.
8. Can I share this dashboard online?
Yes. Save it to OneDrive or SharePoint for real-time collaboration.
Click to Purchases Teacher Training Institutes Dashboard in Excel
Visit our YouTube channel to learn step-by-step video tutorials