Managing a tech support team demands speed, accuracy, and clear visibility. Businesses receive hundreds of support requests every day, and leaders must track performance continuously. When teams respond fast, resolve issues on time, and maintain customer satisfaction, the entire business grows smoothly. Because of this, organizations now rely on Tech Support Efficiency KPI Dashboards in Power BI to monitor real-time performance.
This dashboard transforms raw data into meaningful insights. It helps teams track productivity, SLA compliance, response timelines, and customer experience. In this article, you will learn everything about this dashboard—what it is, how it works, its advantages, key features, best practices, and how teams use it to improve efficiency.
Click to Purchases Tech Support Efficiency KPI Dashboard in Power BI
What Is a Tech Support Efficiency KPI Dashboard in Power BI?
A Tech Support Efficiency KPI Dashboard in Power BI is a visual reporting tool that tracks the daily, monthly, and yearly performance of a technical support team. It converts complex service data into simple charts, cards, and tables. Managers use the dashboard to identify issues, spot trends, and improve service turnaround time.
This dashboard covers KPIs like:
-
First Response Time
-
Average Resolution Time
-
Ticket Backlog
-
Customer Satisfaction Rating
-
SLA Compliance
-
Productivity and workload
-
Cases resolved per agent
Since the dashboard runs on Power BI, it updates in real-time and shows insights from multiple data sources.
Why Do Companies Use This Dashboard?
Tech support teams often struggle with:
-
Unclear performance visibility
-
Missed SLAs
-
High ticket backlog
-
Slow resolution
-
Limited understanding of customer issues
The dashboard solves these problems with one simple visual system.
Because teams work faster with accurate data, the business improves service quality and customer satisfaction.
Key Features of the Tech Support Efficiency KPI Dashboard in Power BI
This dashboard includes three powerful pages that simplify analysis and improve decision-making. Let us explore them in detail.
1. Summary Page – The Main Performance Overview
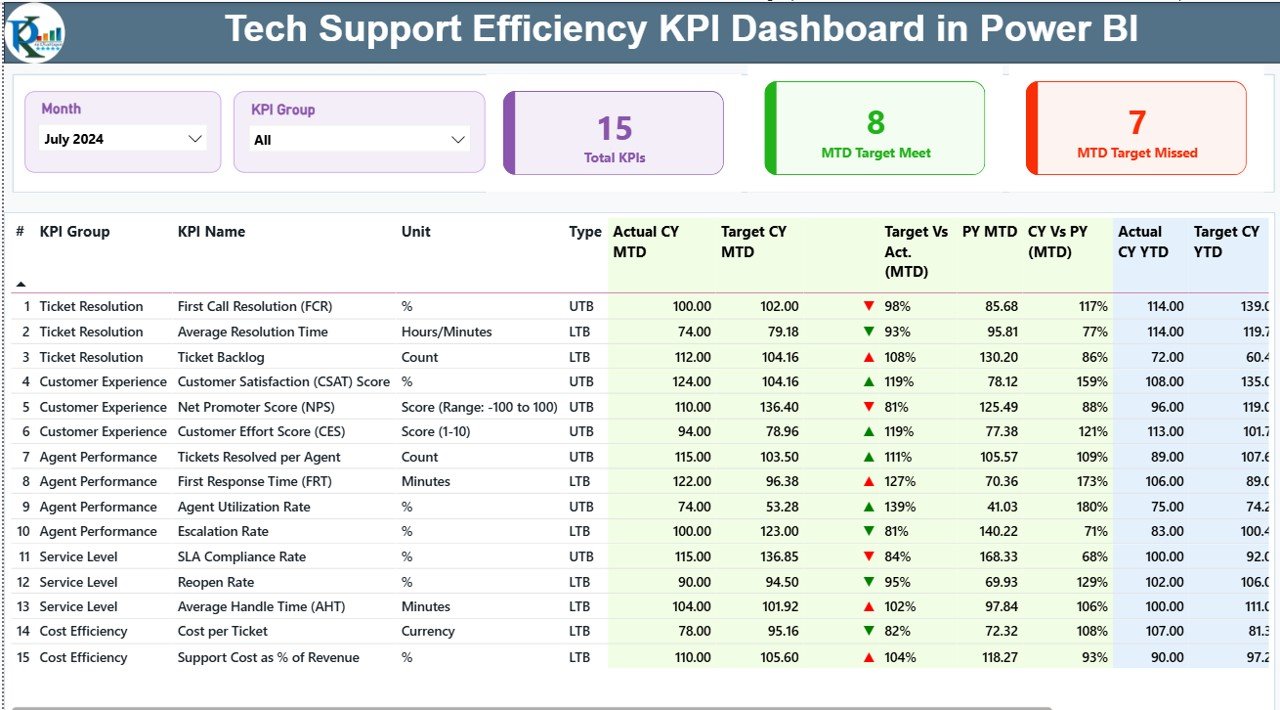
The Summary Page works as the central monitoring screen. Since it contains all major KPIs, managers use this page every day.
Top Section: Filters and KPI Cards
At the top, the dashboard includes:
-
Month Slicer – Select any month and view updated data
-
KPI Group Slicer – Filter KPIs by category
Below these slicers, the dashboard displays three performance cards:
-
Total KPIs Count
-
MTD Target Met Count
-
MTD Target Missed Count
These cards show whether the team is performing well or needs attention.
Detailed KPI Table
Below the cards, the dashboard presents a detailed KPI table. Because the table shows all metrics clearly, teams understand performance without confusion.
It includes:
-
KPI Number – Serial number
-
KPI Group – KPI category
-
KPI Name – KPI title
-
Unit – Measurement unit
-
Type – UTB (Upper the Better) or LTB (Lower the Better)
-
Actual CY MTD – Current year MTD actual values
-
Target CY MTD – Monthly targets
-
MTD Icon – ▲ or ▼ with green or red color
-
Target vs Actual (MTD) – Current MTD performance %
-
PY MTD – Previous year’s MTD numbers
-
CY vs PY (MTD) – MTD comparison %
-
Actual CY YTD – Current year YTD actual numbers
-
Target CY YTD – YTD target numbers
-
YTD Icon – ▲ or ▼ showing YTD performance
-
Target vs Actual (YTD) – Percentage comparison
-
PY YTD – Previous year’s YTD values
-
CY vs PY (YTD) – YTD comparison %
These insights help teams find the exact issue and fix it faster.
Click to Purchases Tech Support Efficiency KPI Dashboard in Power BI
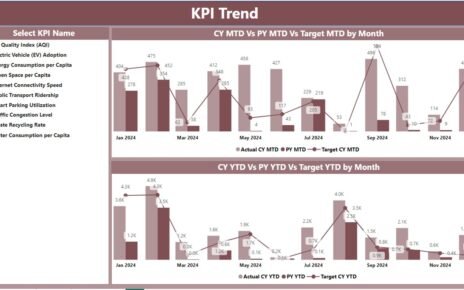
2. KPI Trend Page – Track MTD & YTD Trends Easily
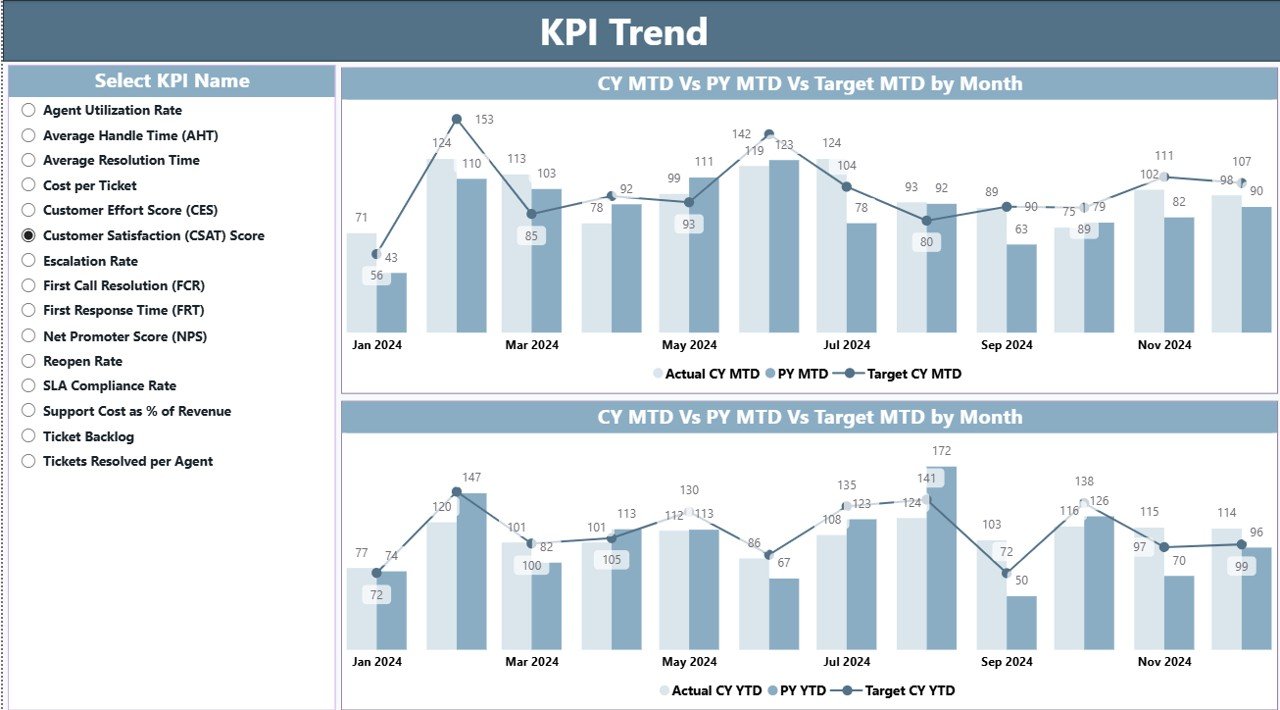
The KPI Trend Page helps teams understand patterns. Because it uses combo charts, viewers compare Actual, Target, and Previous Year numbers in one place.
This page includes:
-
A KPI Slicer for selecting any KPI
-
MTD Chart comparing Current Year, Target, and Previous Year
-
YTD Chart comparing Current Year, Target, and Previous Year
Trends help managers answer questions like:
-
Are support tickets increasing?
-
Is resolution time improving?
-
Are we meeting our customer satisfaction targets?
Trends reveal future challenges before they become serious problems.
3. KPI Definition Page – Drill-Through Insights
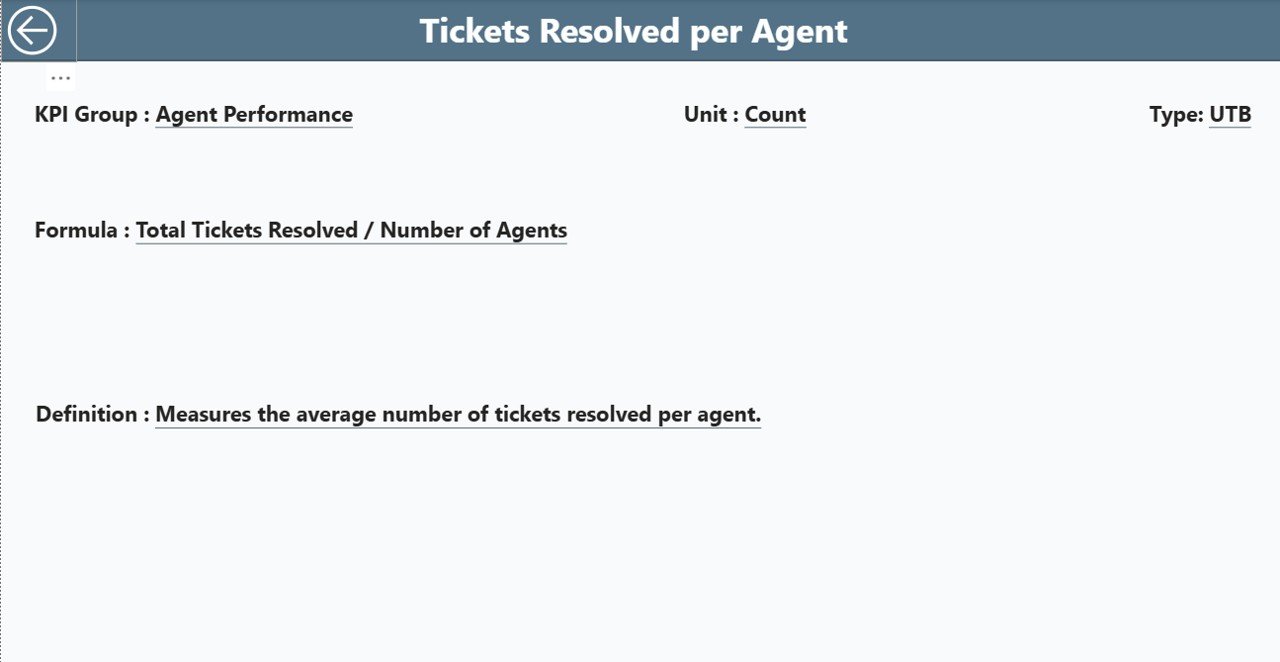
The KPI Definition Page is a hidden drill-through page. When users click on any KPI in the Summary Page, they jump to this section.
This page shows:
-
KPI Number
-
KPI Group
-
KPI Name
-
Unit
-
Formula used
-
KPI Definition
-
KPI Type (UTB or LTB)
This page helps new team members understand each KPI quickly.
What Data Does This Dashboard Use?
The dashboard uses three worksheets inside an Excel file. Power BI fetches data from these sheets.
1. Input_Actual Sheet
Here, users enter:
-
KPI Name
-
Month (first date of the month)
-
MTD numbers
-
YTD numbers
Managers update this sheet every month.
2. Input_Target Sheet
Here, users fill:
-
KPI Name
-
Month (first date of the month)
-
Monthly Targets (MTD)
-
Yearly Targets (YTD)
Because target tracking is clear, teams perform better.
3. KPI Definition Sheet
This sheet contains:
-
KPI Number
-
KPI Group
-
KPI Name
-
Unit
-
Formula
-
KPI Definition
-
KPI Type (UTB or LTB)
This sheet builds the definition page inside Power BI.
How Does This Dashboard Improve Tech Support Efficiency?
Tech support leaders use this dashboard to improve performance in real time. It shows which KPIs require attention and how the team performs every day.
Here is how the dashboard helps:
✔ Faster Issue Resolution
Managers track resolution time instantly. Because they see delays early, they take quick action.
✔ Improved SLA Compliance
The dashboard displays SLA performance clearly. Teams stay alert and maintain compliance.
✔ Clear Monthly and Yearly Tracking
MTD and YTD values help managers measure growth every month.
✔ Better Resource Allocation
Leaders move resources based on workload trends.
✔ Higher Customer Satisfaction
When support teams respond quickly, customer satisfaction increases.
Advantages of Tech Support Efficiency KPI Dashboard in Power BI
This dashboard delivers several benefits. Let us see why most companies use this system.
1. Real-Time Visibility
The dashboard updates instantly when new data enters. Managers view the latest KPIs without manual effort.
2. Data-Driven Decision Making
Clear visuals help leaders take accurate decisions.
3. Trend Monitoring
Managers track patterns and plan strategies for improvement.
4. Improved Team Accountability
Every team member understands performance expectations.
5. Easy to Use
The interface remains simple and beginner-friendly.
6. Supports Continuous Improvement
The dashboard helps teams identify improvement areas regularly.
7. Error-Free Reporting
Automated data reduces manual errors.
Why Should Teams Use a KPI Dashboard Instead of Manual Tracking?
Teams often use spreadsheets for tracking tech support KPIs. Although spreadsheets work well for small datasets, they become difficult to manage as data grows.
Here’s why dashboards perform better:
-
They update automatically
-
They reduce manual work
-
They present clear visuals
-
They display trends
-
They allow drill-through
-
They support automation
Because dashboards save time and improve accuracy, teams move from manual processes to Power BI dashboards.
Best Practices for the Tech Support Efficiency KPI Dashboard
Follow these best practices to get the best results.
✔ Update Actual and Target Data Regularly
Update the Input_Actual and Input_Target sheets at the end of every month.
✔ Standardize KPI Definitions
Use clear definitions so everyone understands the data.
✔ Compare with Previous Year
CY vs PY helps managers understand improvements.
✔ Keep Visuals Simple
Avoid clutter and show only important KPIs.
✔ Use Color Coding
Green = Target Met
Red = Target Missed
Colors improve readability.
✔ Review Trends Frequently
Use the KPI Trend page to analyze performance patterns.
✔ Train Team Members
Everyone should know how to read the dashboard.
Click to Purchases Tech Support Efficiency KPI Dashboard in Power BI
Common Mistakes to Avoid
While building or using the dashboard, avoid these mistakes:
-
Not updating the Excel source file
-
Using inconsistent KPI names
-
Ignoring trends
-
Adding too many visuals
-
Not checking data accuracy
-
Using complex formulas unnecessarily
Avoiding these mistakes keeps the dashboard accurate and meaningful.
How Organizations Use the Dashboard
Companies use this dashboard in several ways:
1. Daily Support Monitoring
Leaders check whether response time meets the daily target.
2. Weekly Workload Review
Managers identify peak periods and plan resources.
3. Monthly Business Review
The management team uses the dashboard during MBR meetings.
4. Yearly Performance Comparison
The dashboard helps compare yearly improvements.
5. SLA Compliance Review
Teams track and control SLA breaches.
6. Productivity Assessments
Leaders evaluate agents’ performance based on KPIs.
Conclusion
A Tech Support Efficiency KPI Dashboard in Power BI gives businesses complete visibility into support performance. It simplifies tracking, improves decision-making, and supports SLA compliance. Because it offers trend analysis, drill-through, and easy KPI monitoring, companies use it to strengthen their customer service operations.
When teams monitor KPIs consistently, they improve response time, reduce backlog, and enhance customer satisfaction. Power BI makes this process easy, visual, and reliable. Therefore, every tech support team should implement this dashboard for smooth operations.
Frequently Asked Questions (FAQs)
1. What is a Tech Support Efficiency KPI Dashboard in Power BI?
It is a visual reporting tool that tracks the performance of the tech support team. It shows KPIs like resolution time, SLA compliance, and customer satisfaction.
2. Why do companies use this dashboard?
Companies use it to monitor performance, identify delays, improve efficiency, and keep SLAs under control.
3. What data sources does the dashboard use?
It uses an Excel file with three sheets: Input_Actual, Input_Target, and KPI Definition.
4. Can beginners use this dashboard easily?
Yes. The interface remains simple, and all visuals are easy to understand.
5. What KPIs does the dashboard show?
It displays KPIs like MTD performance, YTD performance, target vs actual, and previous year comparison.
6. How does the trend page help?
The trend page shows MTD and YTD trends for Actual, Target, and Previous Year values. It helps teams analyze patterns over time.
7. Can I drill through to KPI details?
Yes. You can click on any KPI and jump to the KPI Definition page.
8. How often should I update the data?
Update MTD and YTD values every month for accurate reporting.
9. Does the dashboard help in resource planning?
Yes. Trend analysis helps managers allocate resources based on workload.
10. Is this dashboard suitable for all tech support teams?
Yes. Whether small or large, every tech support team benefits from KPI monitoring.
Visit our YouTube channel to learn step-by-step video tutorials