The thrift fashion industry grows rapidly as consumers shift toward sustainable, affordable, and conscious shopping. However, running a successful thrift fashion business requires more than good products. Store owners must track costs, profits, discounts, customer satisfaction, returns, and trends continuously. That is exactly why a Thrift Fashion Dashboard in Power BI becomes essential.
A Thrift Fashion Dashboard in Power BI helps thrift stores, resale brands, and sustainable fashion retailers analyze business performance using interactive visuals and clear KPIs. Moreover, Power BI transforms raw transactional data into meaningful insights that support faster and smarter decisions.
In this detailed article, you will learn what a Thrift Fashion Dashboard in Power BI is, how it works, why it matters, its structure, advantages, best practices, and frequently asked questions. Additionally, the content expands your provided information creatively while keeping it practical and SEO-friendly.
Click to Purchases Thrift Fashion Dashboard in Power BI
What Is a Thrift Fashion Dashboard in Power BI?
A Thrift Fashion Dashboard in Power BI is an interactive analytics solution designed to monitor and analyze thrift fashion business performance across stores, categories, payment methods, and time periods.
Instead of reviewing multiple static reports, this dashboard consolidates key metrics such as cost, profit, discounts, returns, satisfaction ratings, and profit margins into one dynamic Power BI report. As a result, business owners gain instant clarity about what works and what needs improvement.
Most importantly, Power BI allows users to filter data using slicers, drill into details, and visualize trends without technical complexity.
Why Do Thrift Fashion Businesses Need a Power BI Dashboard?
Thrift fashion businesses operate with thin margins and high variability in pricing, inventory quality, and customer behavior. Therefore, tracking performance manually often leads to delayed decisions.
A Thrift Fashion Dashboard in Power BI helps businesses:
-
Monitor profitability across stores and categories
-
Track discount impact on margins
-
Analyze customer satisfaction trends
-
Identify return patterns early
-
Improve pricing and promotional strategies
-
Support sustainable and data-driven growth
Moreover, Power BI dashboards reduce reporting time and improve transparency.
Click to Purchases Thrift Fashion Dashboard in Power BI
How Does the Thrift Fashion Dashboard in Power BI Work?
The dashboard works by connecting business data to Power BI and transforming it into interactive visuals.
Simple Working Flow
-
Load sales, cost, discount, and satisfaction data
-
Model relationships inside Power BI
-
Apply slicers to filter results dynamically
-
Analyze KPIs, trends, and comparisons
-
Take action based on insights
Because of this structured flow, users can analyze data quickly and confidently.
What Pages Are Included in the Thrift Fashion Dashboard in Power BI?
This dashboard contains 5 well-designed pages, each focusing on a specific analytical area.
What Does the Overview Page Show?
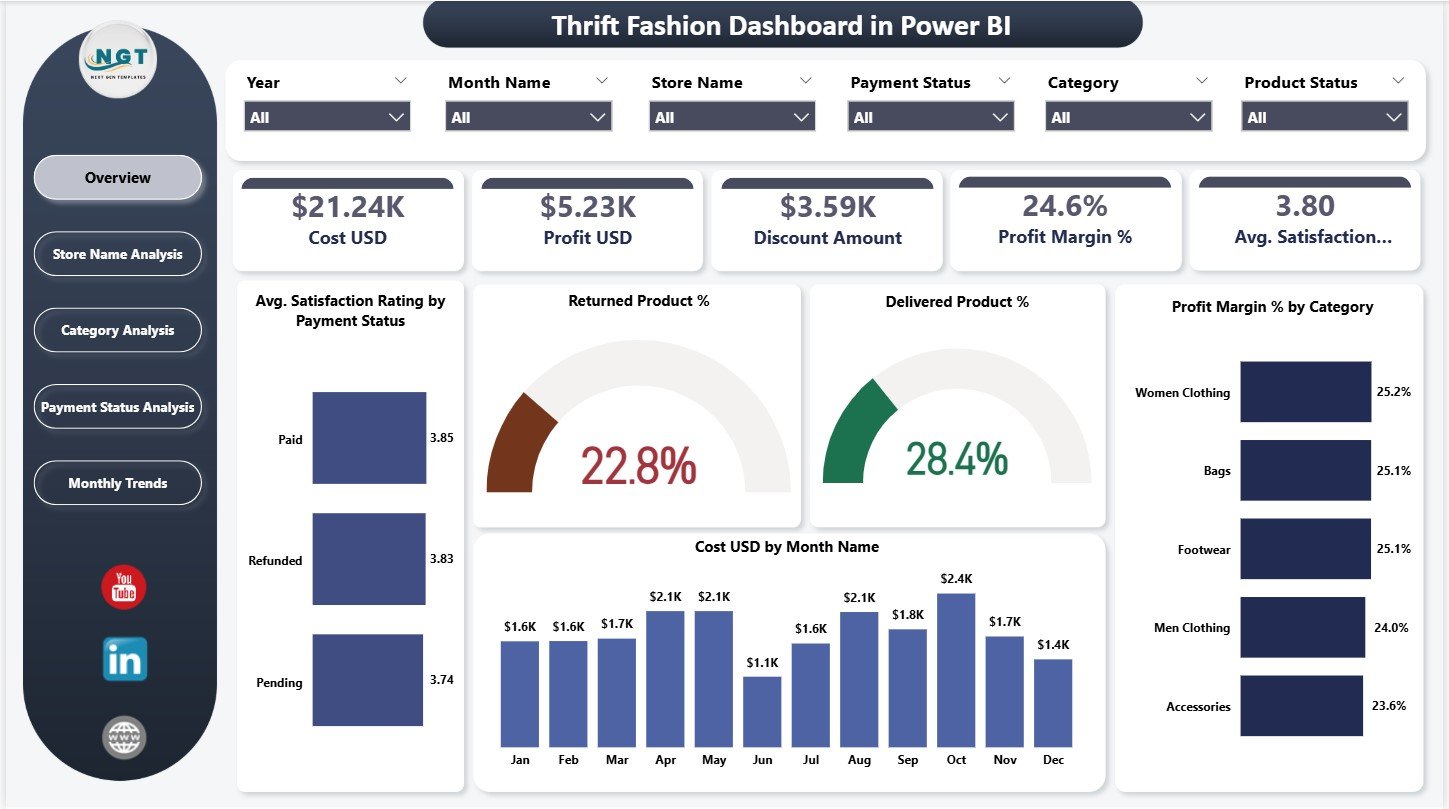
The Overview Page acts as the central snapshot of the business.
Key KPI Cards on the Overview Page
This page displays five KPI cards:
-
Cost (USD)
-
Profit (USD)
-
Discount Amount
-
Profit Margin (%)
-
Average Satisfaction Rating
These cards instantly summarize overall performance.
Key Visuals on the Overview Page
The page also includes the following charts:
-
Average satisfaction rating by payment status
-
Returned product percentage
-
Delivered product percentage
-
Profit margin percentage by category
-
Cost (USD) by month name
Because of slicers, users can filter data by time, store, or category easily.
Click to Purchases Thrift Fashion Dashboard in Power BI
How Does the Store Name Analysis Page Help?
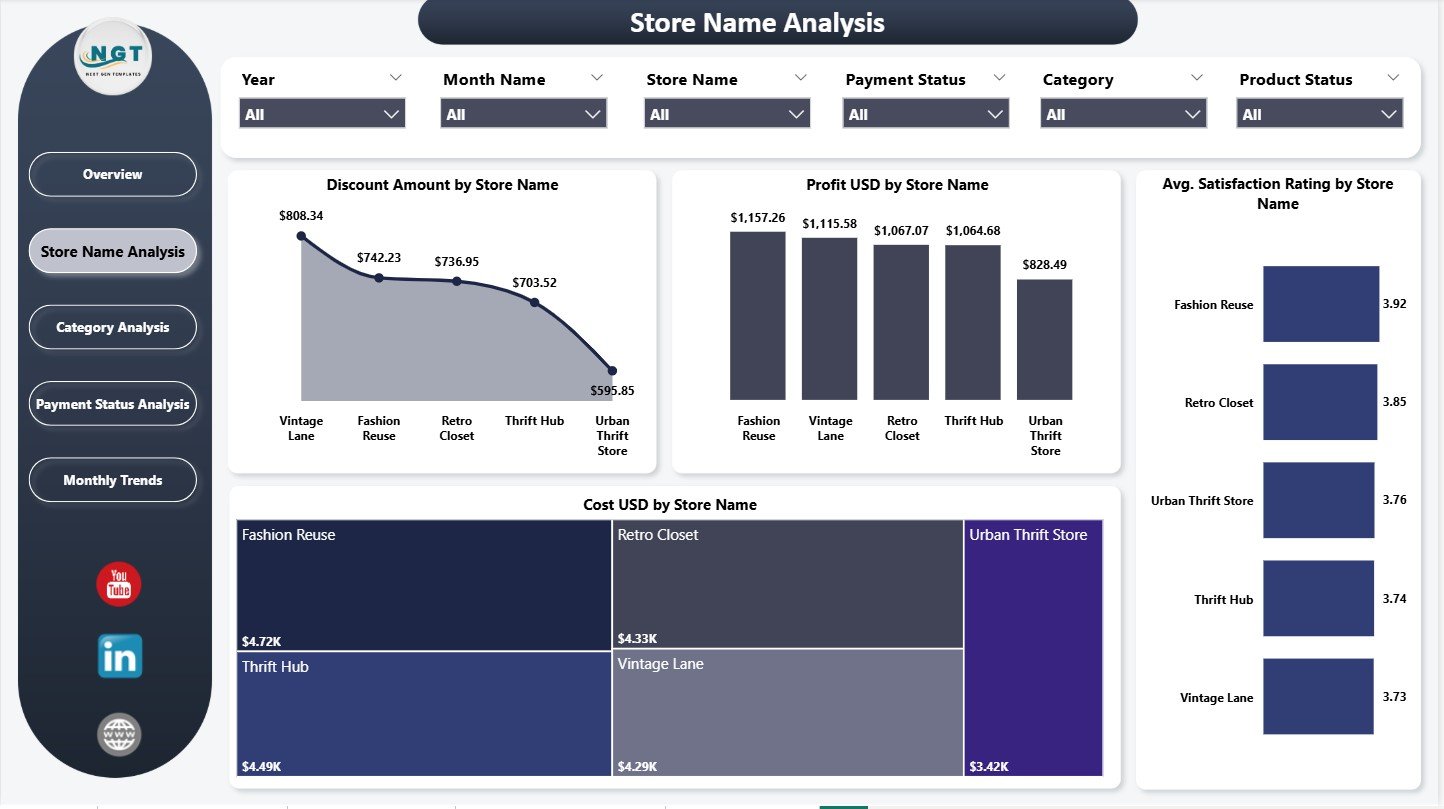
The Store Name Analysis Page focuses on performance comparison across individual thrift stores.
Key Charts on Store Name Analysis Page
-
Discount amount by store name
-
Profit (USD) by store name
-
Average satisfaction rating by store name
-
Cost (USD) by store name
This page helps business owners identify top-performing and underperforming stores quickly.
As a result, management can improve store-level strategies.
What Insights Does the Category Analysis Page Provide?
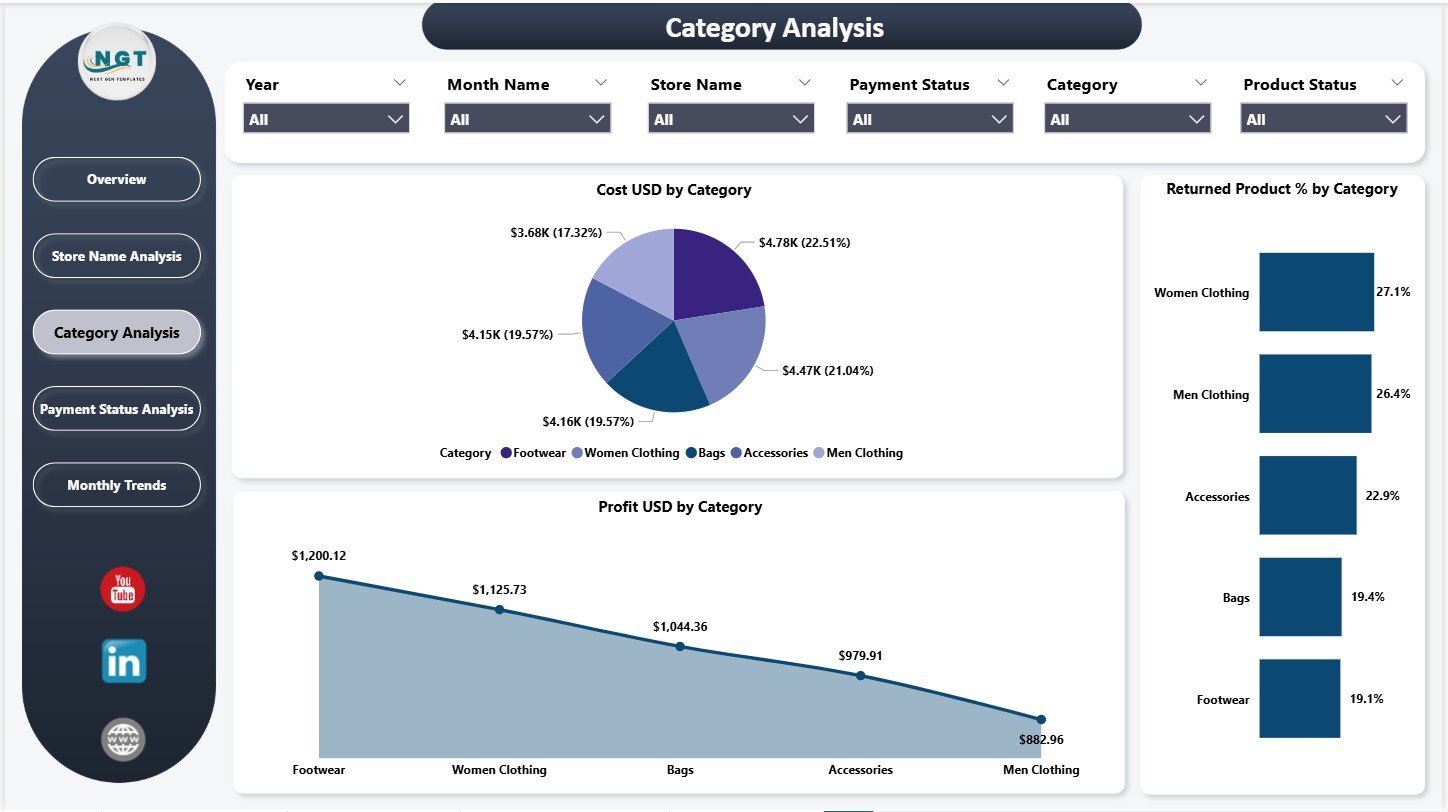
The Category Analysis Page analyzes product categories such as clothing types or accessories.
Charts Included in Category Analysis
-
Cost (USD) by category
-
Profit (USD) by category
-
Returned product percentage by category
This page helps identify profitable categories and high-return risk items.
Therefore, businesses can optimize inventory and pricing decisions.
Click to Purchases Thrift Fashion Dashboard in Power BI
Why Is the Payment Status Analysis Page Important?
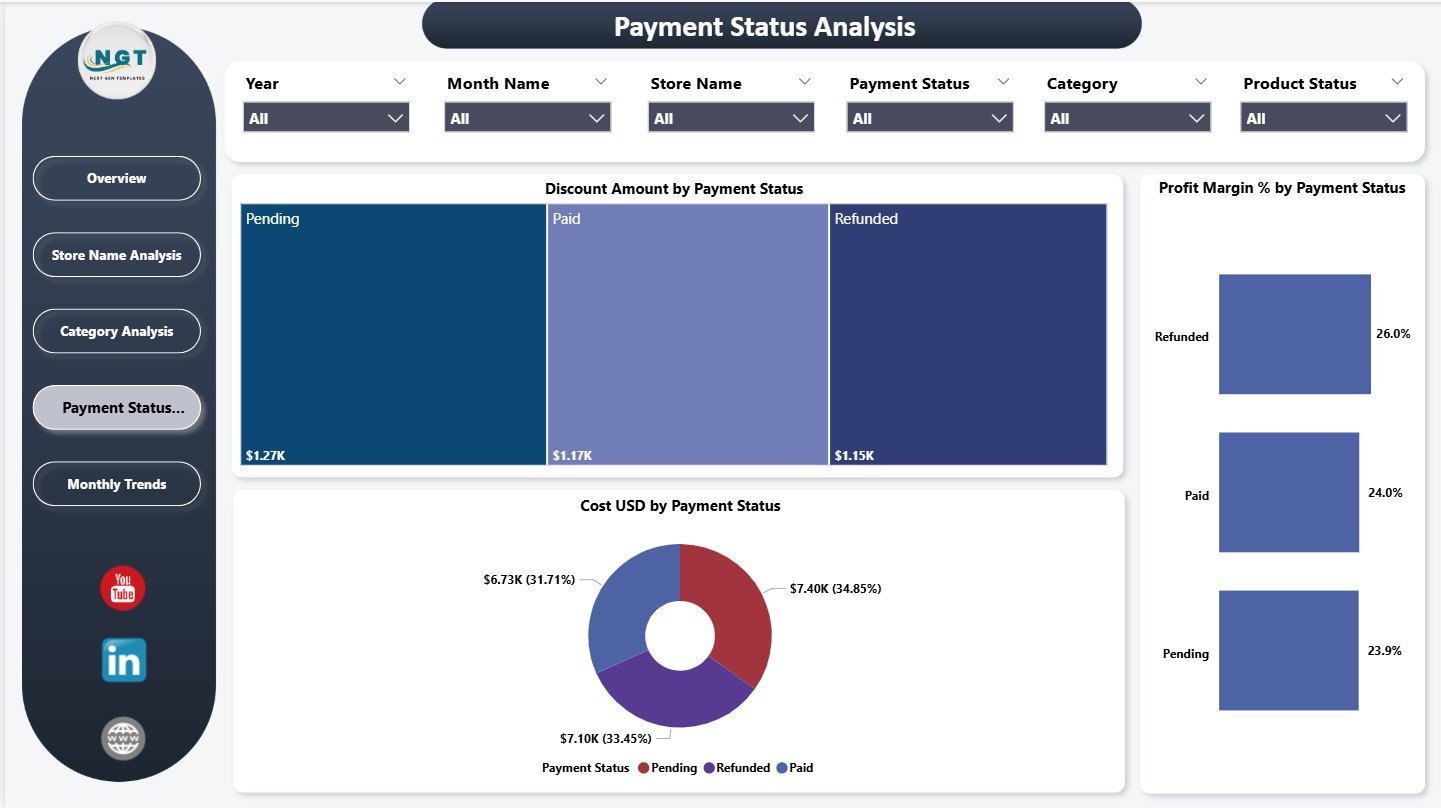
The Payment Status Analysis Page highlights how different payment methods impact profitability.
Charts on Payment Status Analysis Page
-
Discount amount by payment status
-
Cost (USD) by payment status
-
Profit margin (%) by payment status
This analysis helps businesses understand whether certain payment methods reduce margins or increase costs.
As a result, stores can adjust discount policies accordingly.
What Does the Monthly Trends Page Reveal?
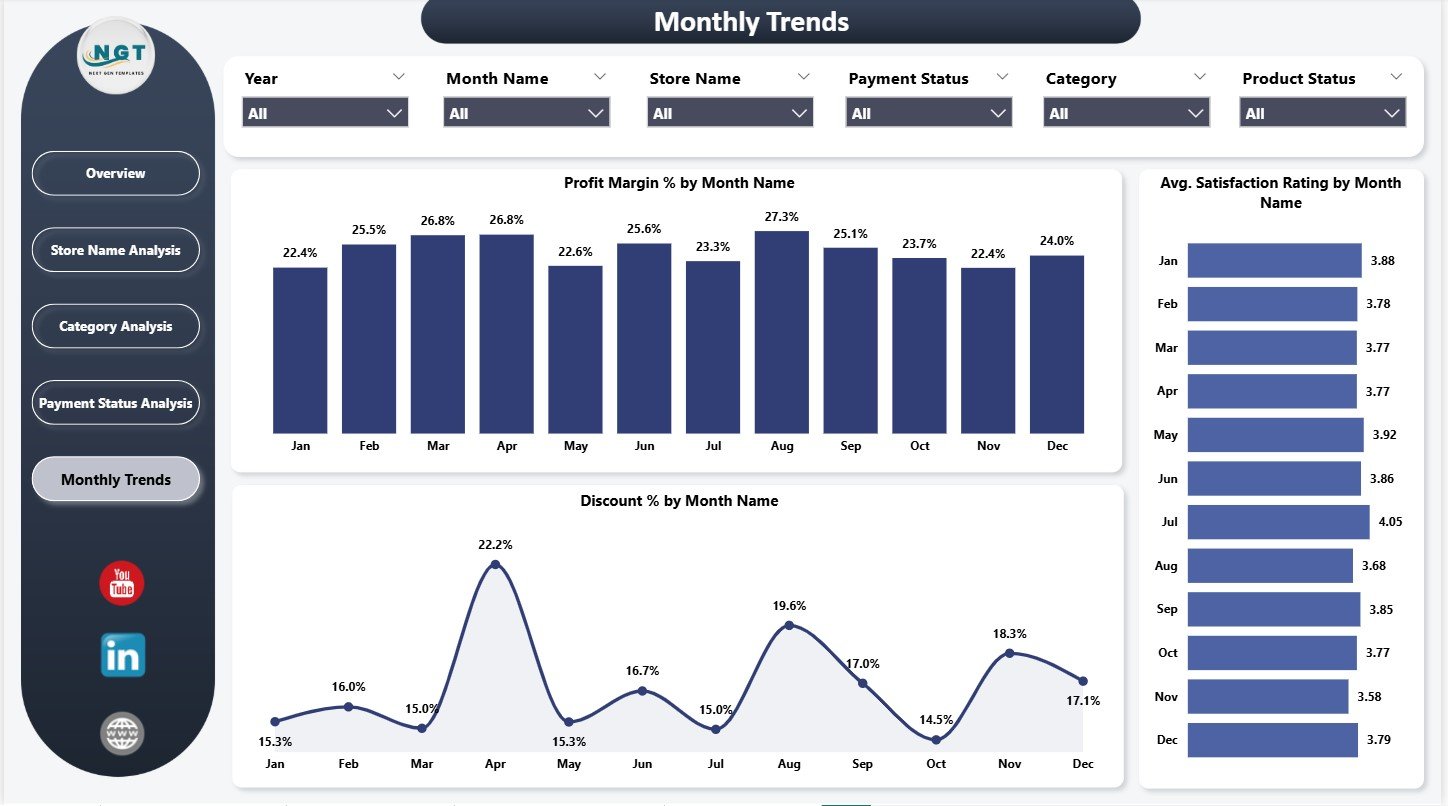
The Monthly Trends Page focuses on time-based performance patterns.
Key Monthly Trend Charts
-
Profit margin (%) by month
-
Average satisfaction rating by month
-
Discount percentage by month
This page helps identify seasonality, promotional impact, and customer behavior trends.
Because of this insight, planning becomes more accurate and proactive.
Click to Purchases Thrift Fashion Dashboard in Power BI
Advantages of Thrift Fashion Dashboard in Power BI
A Thrift Fashion Dashboard in Power BI delivers strong operational and strategic benefits.
Key Advantages
✅ Centralized performance monitoring
✅ Clear visibility of cost, profit, and discounts
✅ Category-wise and store-wise analysis
✅ Improved customer satisfaction tracking
✅ Return and delivery performance insights
✅ Monthly trend analysis for planning
✅ Interactive slicers for deep analysis
✅ Faster and smarter decision-making
Because of these advantages, thrift fashion businesses gain control and confidence.
How Does This Dashboard Improve Decision-Making?
This dashboard converts complex data into simple visuals.
For example:
-
Owners can identify low-margin categories instantly
-
Managers can adjust discounts based on trends
-
Teams can reduce return rates proactively
-
Marketing can align promotions with profitable months
As a result, decisions become timely and data-driven.
Click to Purchases Thrift Fashion Dashboard in Power BI
Best Practices for the Thrift Fashion Dashboard in Power BI
To maximize value, follow these proven best practices.
Best Practices You Should Follow
🔹 Clean and validate data before loading
🔹 Use consistent category and store names
🔹 Review KPIs monthly, not occasionally
🔹 Track satisfaction and returns together
🔹 Monitor discount impact on profit margins
🔹 Limit dashboards to actionable metrics
🔹 Train users on slicers and filters
Following these practices ensures accuracy and long-term success.
Who Can Use the Thrift Fashion Dashboard in Power BI?
This dashboard suits multiple roles.
Ideal Users
-
Thrift store owners
-
Sustainable fashion brands
-
Resale business managers
-
Retail analysts
-
Operations and finance teams
Because Power BI remains user-friendly, both technical and non-technical users benefit.
Click to Purchases Thrift Fashion Dashboard in Power BI
Why Choose Power BI for Thrift Fashion Analytics?
Power BI offers several advantages over traditional reporting.
Power BI Benefits
-
Interactive dashboards
-
Real-time filtering
-
Clean and modern visuals
-
Automated calculations
-
Scalable reporting
Therefore, Power BI becomes the perfect analytics tool for thrift fashion businesses.
Conclusion: Why Thrift Fashion Businesses Need a Power BI Dashboard
A Thrift Fashion Dashboard in Power BI provides visibility, control, and clarity in a competitive and sustainability-focused market. It transforms raw data into meaningful insights that support profitability, customer satisfaction, and growth.
Moreover, it helps businesses optimize pricing, reduce returns, improve margins, and plan effectively. In today’s thrift fashion landscape, this dashboard becomes a strategic necessity rather than a luxury.
Click to Purchases Thrift Fashion Dashboard in Power BI
Frequently Asked Questions (FAQs)
What is a Thrift Fashion Dashboard in Power BI?
It is a Power BI dashboard designed to track cost, profit, discounts, satisfaction, returns, and trends for thrift fashion businesses.
Can small thrift stores use this dashboard?
Yes, the dashboard works well for both small and large thrift businesses.
Does this dashboard support store-wise analysis?
Yes, it includes a dedicated Store Name Analysis page.
Can I track monthly trends?
Yes, the Monthly Trends page highlights profit margin, discounts, and satisfaction by month.
Is Power BI difficult to use?
No, Power BI provides an intuitive and user-friendly interface.
Can the dashboard be customized?
Yes, users can modify KPIs, visuals, and filters based on business needs.
Does this dashboard help sustainability goals?
Yes, it supports data-driven decisions that reduce waste and improve resale efficiency.
Click to Purchases Thrift Fashion Dashboard in Power BI
Visit our YouTube channel to learn step-by-step video tutorials