Tool and die manufacturing drives precision, accuracy, and efficiency for several industries. Automotive, aerospace, packaging, and engineering companies depend on high-quality tools and dies to run productions smoothly. Because of this, manufacturers must track every key performance indicator with accuracy. However, most teams still use scattered spreadsheets, manual reports, or outdated systems. These problems create delays, quality issues, and hidden cost leaks.
A Tool & Die Manufacturing KPI Dashboard in Excel solves these challenges with a simple yet powerful solution. It converts raw data into clear insights, quick comparisons, and visual charts that help managers and engineers take better decisions. In this detailed article, you will learn what this dashboard does, why it matters, how it works, and how each page helps you improve performance.
Let’s begin.
What Is a Tool & Die Manufacturing KPI Dashboard in Excel?
A Tool & Die Manufacturing KPI Dashboard in Excel is a ready-to-use analytical tool that displays production, quality, efficiency, downtime, delivery, and financial KPIs in a clear and structured format. It pulls data from your monthly inputs and automatically updates all charts, comparisons, and metrics.
The dashboard uses structured Excel formulas, conditional formatting, drop-downs, and dynamic charts. As a result, you can monitor monthly trends, compare actuals vs. targets, and evaluate performance across the year.
Because the dashboard runs inside Excel, your team does not need extra software, expensive subscriptions, or complicated systems. You open the file, update the numbers, and the dashboard shows you where you stand.
Why Do Tool & Die Manufacturers Need a KPI Dashboard?
Tool & die manufacturing is complex. You deal with:
- Tight tolerances
- Heavy machining
- Long cycle times
- Tool wear and defects
- High material cost
- Customer deadlines
- Maintenance demand
Without a smart dashboard, teams spend hours compiling data and still miss the real insights.
A KPI dashboard helps you:
- Track productivity and efficiency
- Reduce rework and scrap
- Control machining cost
- Improve delivery performance
- Manage tool life and tool failures
- Compare actual results with targets
- Identify delays, bottlenecks, and cost spikes
When you measure performance visually, you act faster and more confidently.
Key Features of the Tool & Die Manufacturing KPI Dashboard in Excel
We created a fully functional KPI Dashboard in Excel designed specifically for tool and die operations. This dashboard contains 7 structured worksheets, each with a clear purpose.
Below is the detailed explanation of each sheet.
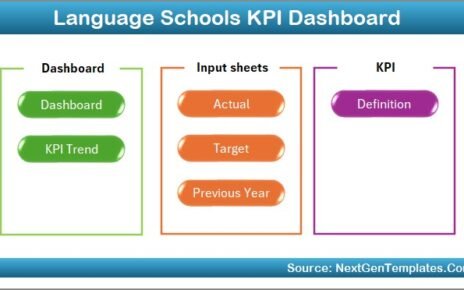
Summary Page – Your Navigation Control Center
The Summary Page acts as an index sheet. It includes six clickable buttons that allow you to jump to the other sheets with one click.
This page improves navigation because users do not scroll endlessly through multiple tabs. Every section remains organized and easy to access.
The buttons take you to:
- Dashboard
- Trend Analysis
- Actual Number Inputs
- Target Input
- Previous Year Data
- KPI Definitions
With this structure, every user interacts with the dashboard smoothly—even if they are not Excel experts.

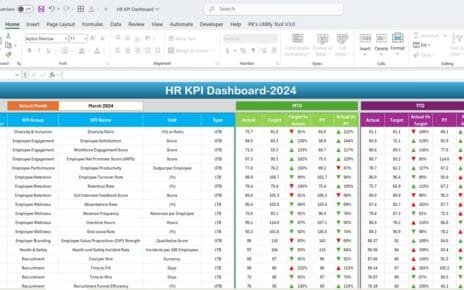
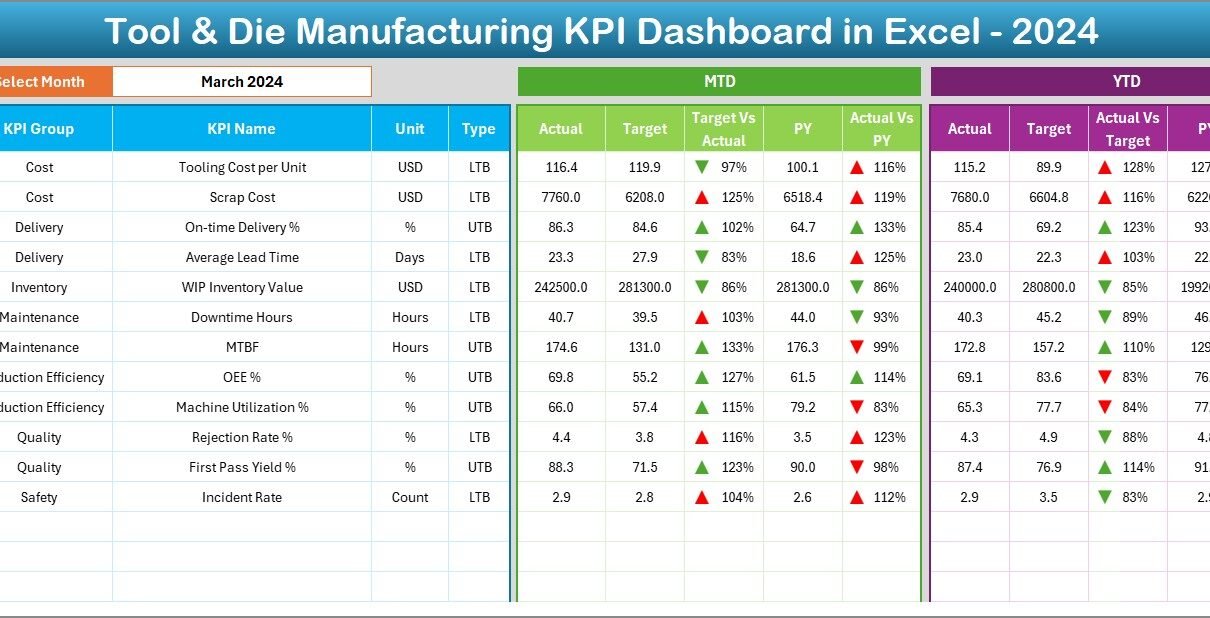
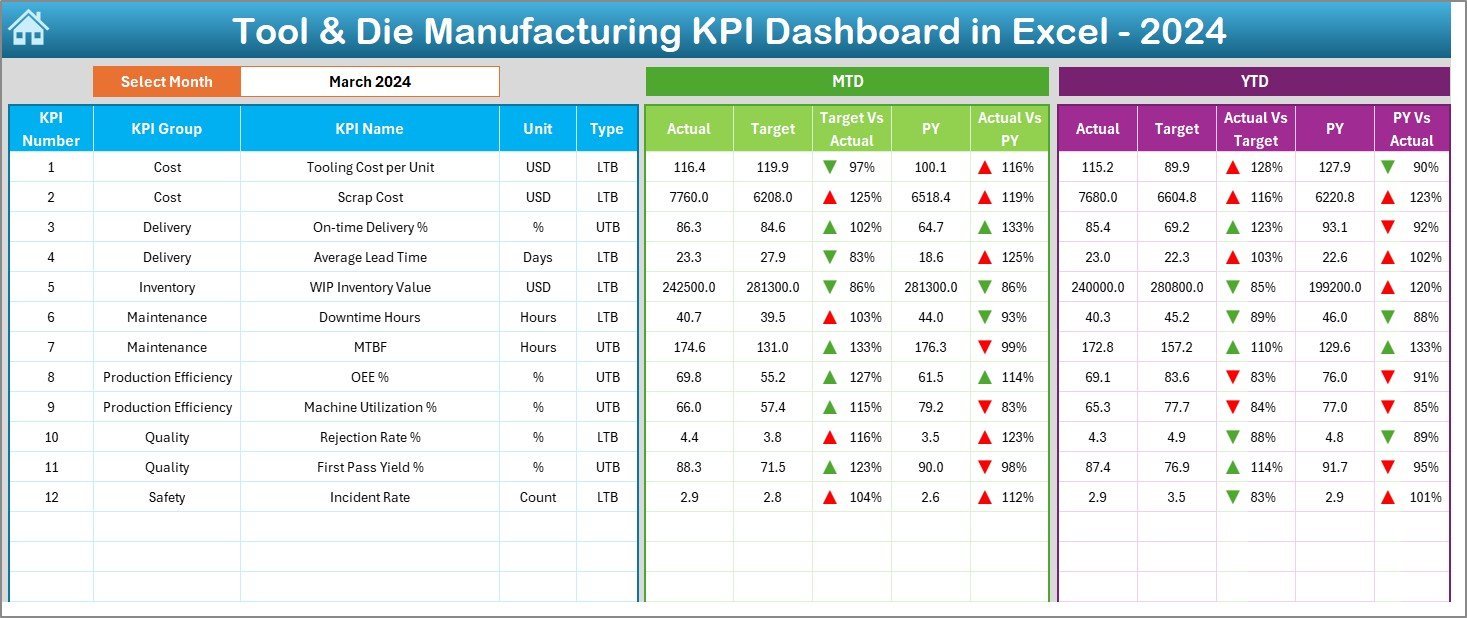
Dashboard Sheet – The Main Performance View
The Dashboard sheet displays all major KPIs with monthly and yearly comparisons. This is the most important page because it provides instant visibility into performance.
Month Selection
You can select a month from the drop-down in cell D3. Once you select a month, the entire dashboard updates automatically. This makes comparisons simple and precise.
MTD Metrics (Month-to-Date)
The dashboard shows:
- MTD Actual
- MTD Target
- MTD Previous Year
- Target vs. Actual %
- Previous Year vs. Actual %
Conditional formatting uses up/down arrows to show improvement or decline. This makes the dashboard easy to understand at a glance.
YTD Metrics (Year-to-Date)
Similarly, you can track:
- YTD Actual
- YTD Target
- YTD Previous Year
- Target vs. Actual %
- Previous Year vs. Actual %
This view shows long-term performance and highlights areas that need attention.
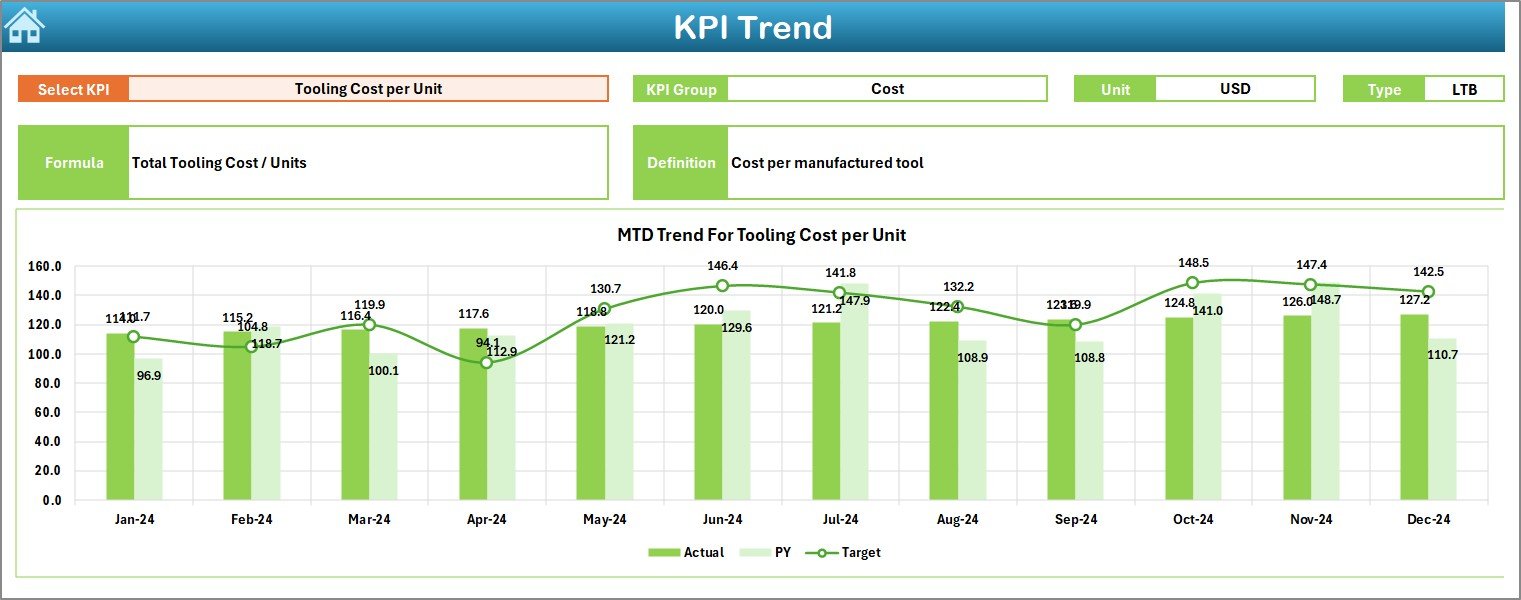
Trend Sheet – Historical Insights for Each KPI
The Trend Sheet helps you understand how performance changes across months. KPI Selection
You can choose any KPI from a drop-down in cell C3.
After selecting the KPI, the sheet displays:
- KPI Group
- Unit of Measurement
- KPI Type (Lower the Better or Upper the Better)
- KPI Formula
- KPI Definition
This makes it simple for new employees, analysts, or auditors to understand each KPI clearly.
Trend Charts
The sheet shows two charts:
- MTD Trend Chart – compares Actual, Target, and Previous Year
- YTD Trend Chart – compares Actual, Target, and Previous Year
These charts help identify improvements, seasonal changes, and performance drops.
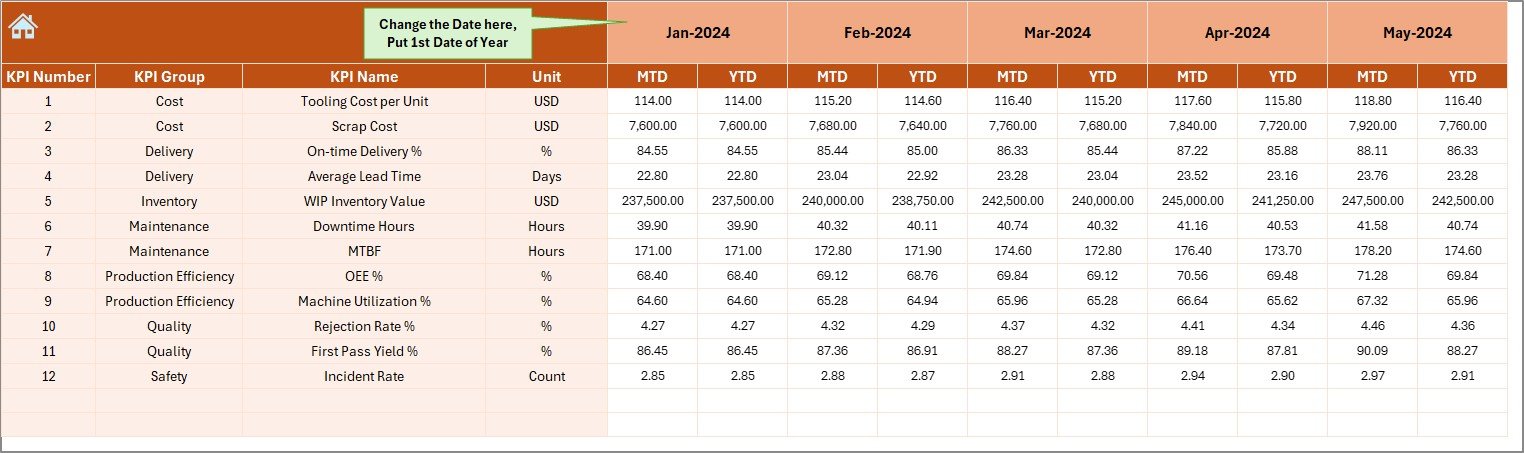
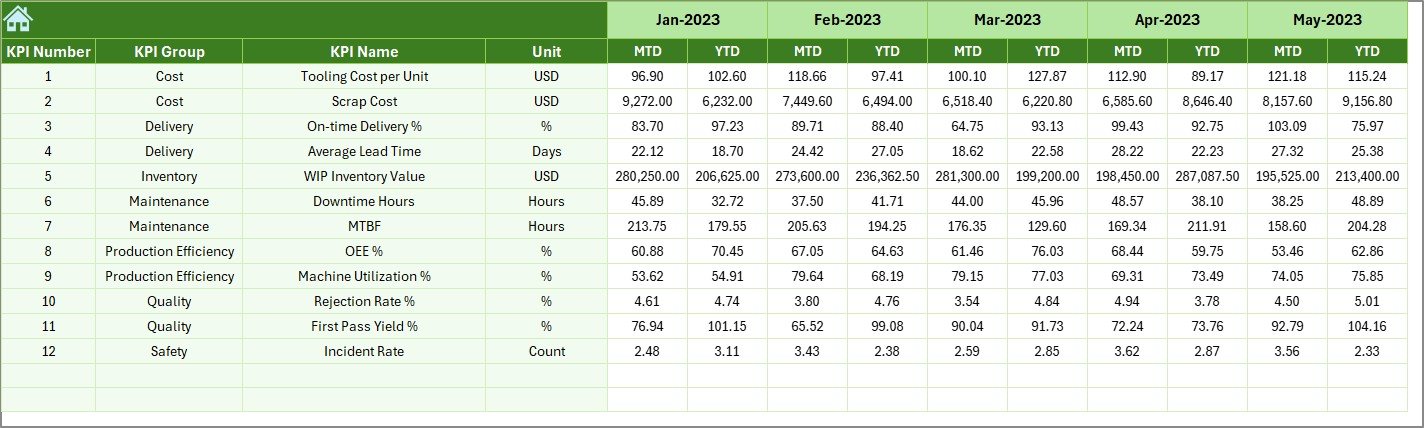
Actual Numbers Input Sheet – Enter Monthly Results
This sheet stores all the actual performance numbers for the selected year.
Month Selection
You can update the year’s starting month in cell E1.
Easy Data Entry
You can enter:
- MTD Actual
- YTD Actual
This sheet works as the main data table. It drives all dashboards, charts, and metrics.
Target Sheet – Define Performance Goals
In this sheet, you set the monthly targets for:
- MTD Target
- YTD Target
Targets help benchmark your actual results and highlight performance gaps.
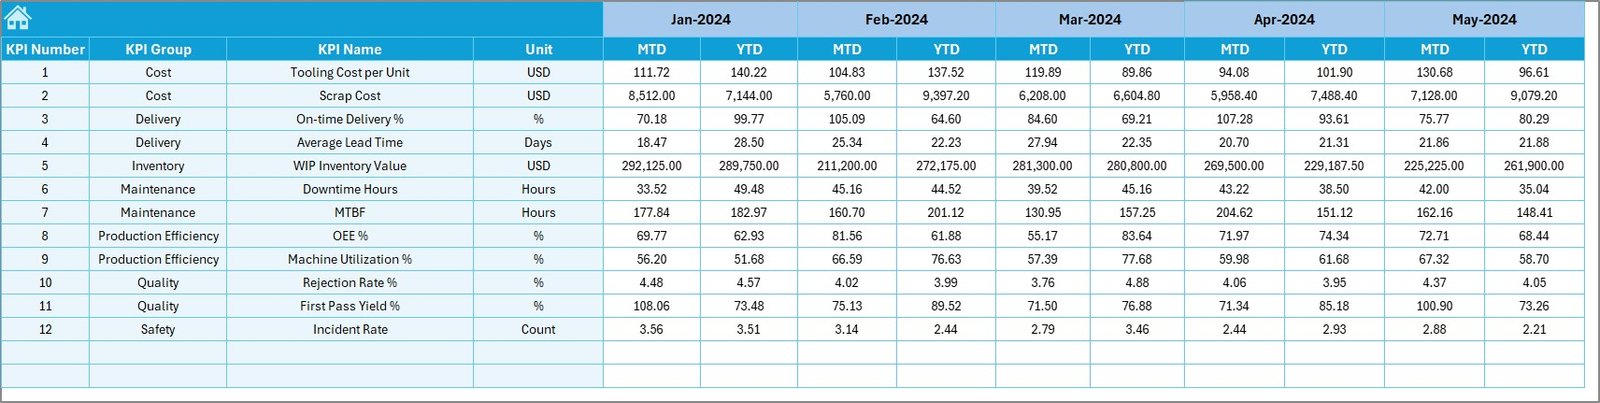
Previous Year Numbers – Compare Historical Data
This sheet stores the previous year’s performance for each KPI. The dashboard uses it to calculate:
- MTD Previous Year Comparison
- YTD Previous Year Comparison
- Year-on-Year growth
This helps identify improvements and declines across time.
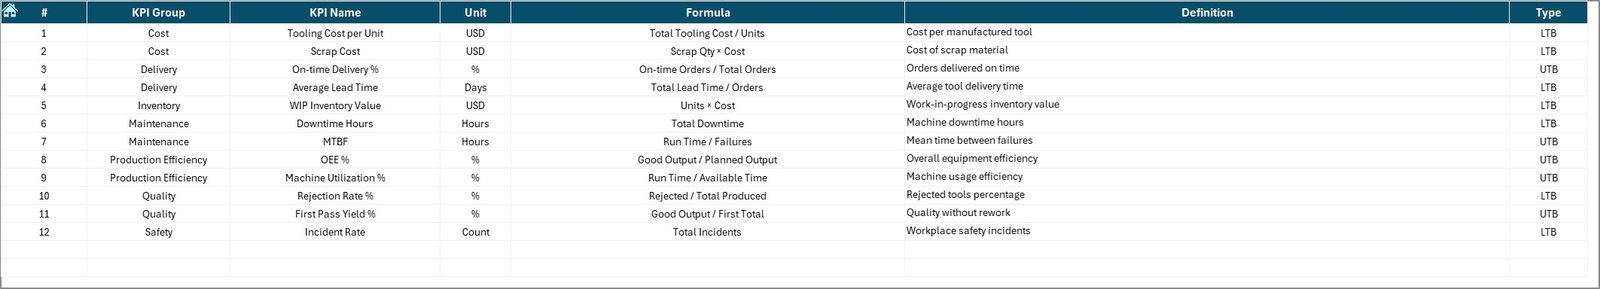
KPI Definition Sheet – Build Your KPI Knowledge Base
In this sheet, you document:
- KPI Name
- KPI Group
- KPI Unit
- KPI Formula
- KPI Definition
- KPI Type: Lower the Better (LTB) or Upper the Better (UTB)
This ensures clarity and removes ambiguity for everyone using the dashboard.
Advantages of a Tool & Die Manufacturing KPI Dashboard in Excel
A well-structured dashboard offers huge advantages:
- You Improve Production Efficiency
You track machine runtime, output, tool wear, scrap, and cycle times. Because of this visibility, you improve planning and reduce downtime.
- You Reduce Quality Defects
You monitor rejections, rework percentage, tolerance issues, and customer complaints. This leads to better consistency and less waste.
- You Control Manufacturing Cost
You track material cost, machining hours, consumables, tool life, and scrap cost. This helps reduce unwanted spending.
- You Strengthen On-Time Delivery
You monitor delivery performance, average job delay, and tooling readiness. Customers receive better service.
- You Compare Target, Actual, and Previous Year Easily
The dashboard updates instantly and shows whether you move in the right direction.
- You Make Better Decisions Faster
Because the dashboard uses simple visuals and automated logic, you understand complex situations in seconds.
- You Use Excel—No Extra Software Needed
No subscription, no training sessions, no large systems. Excel does all the work.
What KPIs Should You Track in Tool & Die Manufacturing?
A well-designed dashboard includes clear KPIs that reflect productivity, quality, delivery, cost, and maintenance.
Common KPIs include:
Productivity KPIs
- Machine Utilization %
- Cycle Time
- Output per Shift
- Setup Time
Quality KPIs
- Defect Rate
- Rejection %
- Rework %
- Customer Complaint Count
Delivery KPIs
- On-Time Delivery %
- Average Dispatch Delay
- Jobs Completed per Month
Cost KPIs
- Tooling Cost
- Scrap Cost
- Machining Cost per Job
- Total Operating Cost
Maintenance KPIs
- Tool Life
- Breakdown Hours
- Preventive Maintenance %
- Downtime Hours
These metrics help manufacturers run stable, cost-efficient, and predictable operations.
How Does the Dashboard Help in Daily Operations?
The dashboard supports all levels of decision-making.
Supervisors
Monitor shift output, cycle times, and delays.
Managers
Track monthly and yearly trends, compare actuals vs. targets, and highlight issues.
Quality Engineers
Identify defect patterns and prevent future failures.
Senior Leadership
Understand profitability, utilization, and delivery performance.
The dashboard brings everyone onto the same page.
Best Practices for Using the Tool & Die Manufacturing KPI Dashboard
Follow these simple practices to get the best results:
- Update Data Regularly
Enter actual numbers every month. Do not wait for the quarter to end.
- Set Clear and Realistic Targets
Targets should motivate the team but still remain achievable.
- Review Trend Charts Frequently
Look for sudden drops or unexpected spikes.
- Standardize KPI Definitions
Every team must understand the same meaning for each KPI.
- Keep the Dashboard Clean
Avoid unnecessary formatting or colors. Clean dashboards improve clarity.
- Train Teams to Use MTD and YTD Views
Both views provide different insights. Use both to make balanced decisions.
- Compare Actual vs. Previous Year
Year-on-year comparison helps you measure improvements correctly.
- Use Conditional Formatting Wisely
Use simple green and red arrows to highlight improvement or decline.
Conclusion
A Tool & Die Manufacturing KPI Dashboard in Excel is a powerful solution that brings clarity, accuracy, and speed into your decision-making process. It helps you organize monthly results, monitor year-to-date progress, and compare performance against targets and previous years. With its structured pages—Dashboard, Trend Analysis, Actual Inputs, Targets, and KPI Definitions—you can manage operations with confidence.
Tool and die manufacturing demands precision, and this dashboard provides exactly that. When you measure the right KPIs clearly, you improve productivity, reduce cost, and grow consistently.
Frequently Asked Questions (FAQs)
- What KPIs should I track in tool and die manufacturing?
Track productivity, quality, cost, delivery, and maintenance KPIs such as machine utilization, defect rate, cycle time, scrap cost, tool life, and on-time delivery.
- Can I customize the KPI Dashboard in Excel?
Yes, you can add new KPIs, modify formulas, update targets, or redesign charts according to your business needs.
- Do I need advanced Excel skills to use this dashboard?
No. Once it is set up, you only update numbers and select months from drop-downs. The dashboard updates automatically.
- How often should I update the dashboard?
Update it monthly for accurate tracking. You can also update it weekly if you want more visibility.
- Can I use this dashboard for multiple manufacturing plants?
Yes. You can create separate sheets for each plant or add plant as a slicer field to filter performance.
- Does the dashboard work in older versions of Excel?
Yes. It works in Excel 2016 or later without issues.
- Why is a KPI dashboard important in tool and die manufacturing?
It improves productivity, quality, delivery performance, and cost control while enabling faster decisions.
Visit our YouTube channel to learn step-by-step video tutorials
Watch the step-by-step video tutorial: