Effective training and development programs are essential for building a skilled workforce, ensuring employee growth, and enhancing organizational performance. The Training and Development Dashboard in Excel provides a comprehensive solution for tracking and analyzing various aspects of training programs within an organization. This ready-to-use template offers real-time insights into key metrics such as training hours, feedback scores, completion rates, and trainer performance. In this article, we will walk through the features of the dashboard and how it helps manage and optimize training initiatives.
What is the Training and Development Dashboard in Excel?
The Training and Development Dashboard in Excel is a tool designed to help HR professionals, managers, and team leads track and analyze training programs effectively. It captures key performance indicators (KPIs) related to employee training, including the number of trainings conducted, training hours, feedback scores, and more. With multiple worksheets and visual charts, this dashboard allows organizations to monitor and optimize their training and development efforts.
The dashboard includes several worksheets that focus on different aspects of training management, such as trainer performance, department performance, and program analysis.
Key Features of the Training and Development Dashboard
The Training and Development Dashboard in Excel contains multiple worksheets, each focusing on different aspects of training management. Below are the details of each sheet:
1. Overview Sheet Tab
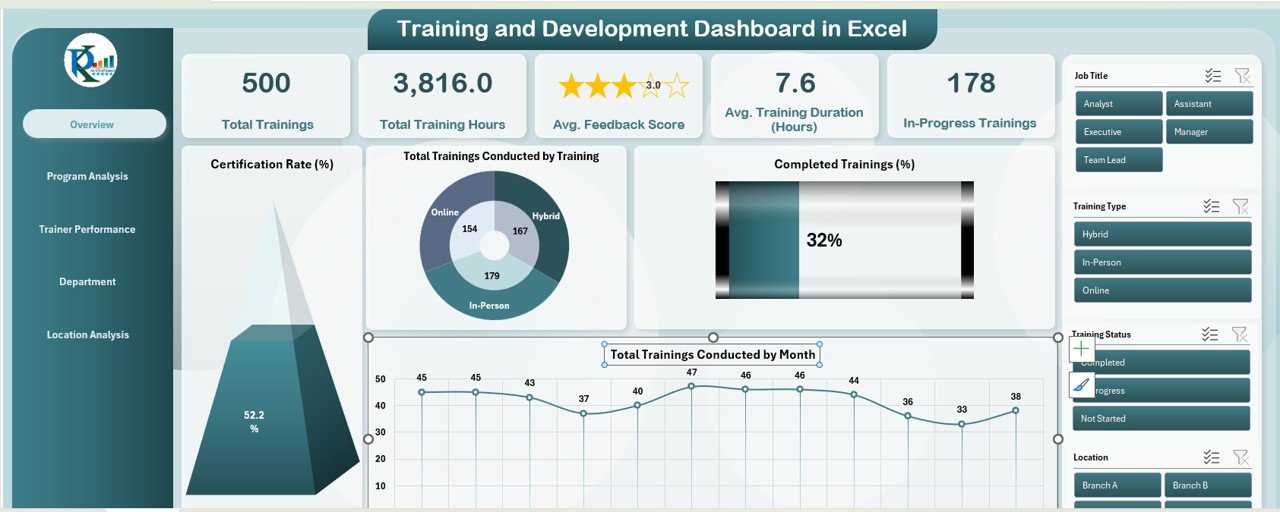
The Overview Sheet provides a high-level summary of the training data and key performance indicators (KPIs). It includes:
Cards:
- Total Trainings Conducted: Displays the total number of training sessions conducted.
- Total Training Hours: Shows the total number of hours dedicated to employee training.
- Avg. Feedback Score: Displays the average feedback score received from trainees.
- Avg. Training Duration (Hours): Shows the average duration of each training session.
- In-Progress Trainings: Displays the number of trainings currently ongoing.
Charts:
- Certification Rate (%): Displays the percentage of employees who have completed the required certifications.
- Total Trainings Conducted by Training: Visualizes the number of trainings conducted by program type.
- Completed Trainings (%): Shows the percentage of trainings that have been completed.
- Total Trainings Conducted by Month: A time-based chart showing the number of trainings conducted each month.
Click to buy Training and Development Dashboard in Excel
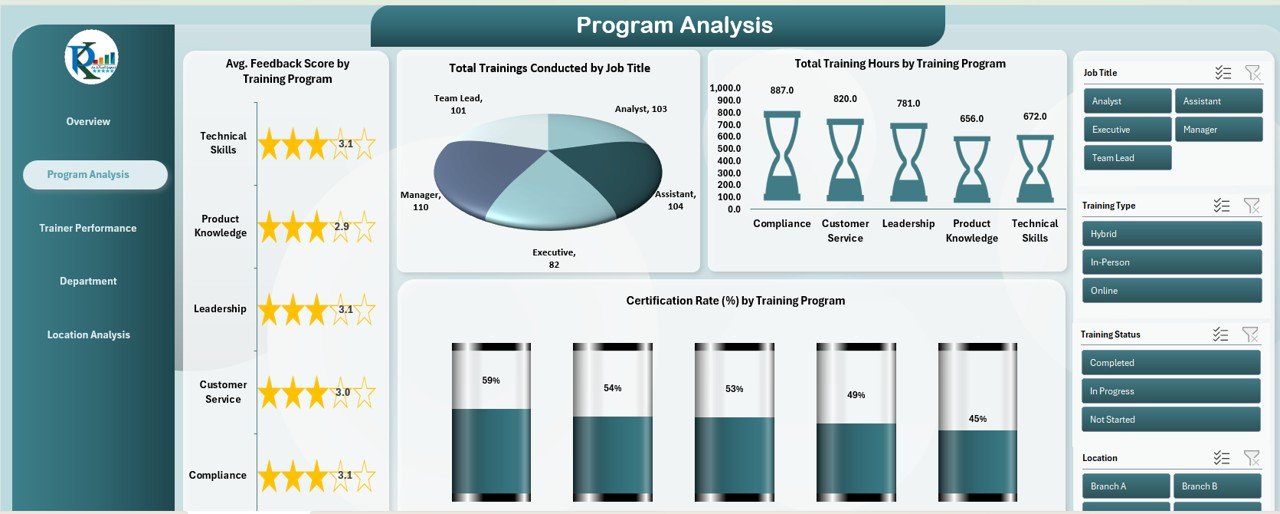
2. Program Analysis Sheet Tab
The Program Analysis Sheet offers insights into the effectiveness and distribution of various training programs. It includes:
Charts:
- Avg. Feedback Score by Training Program: Displays the average feedback score for each training program.
- Total Trainings Conducted by Job Title: Shows the number of trainings conducted for each job title.
- Total Training Hours by Training Program: Displays the total hours spent on each training program.
- Certification Rate (%) by Training Program: Shows the certification completion rate for each training program.
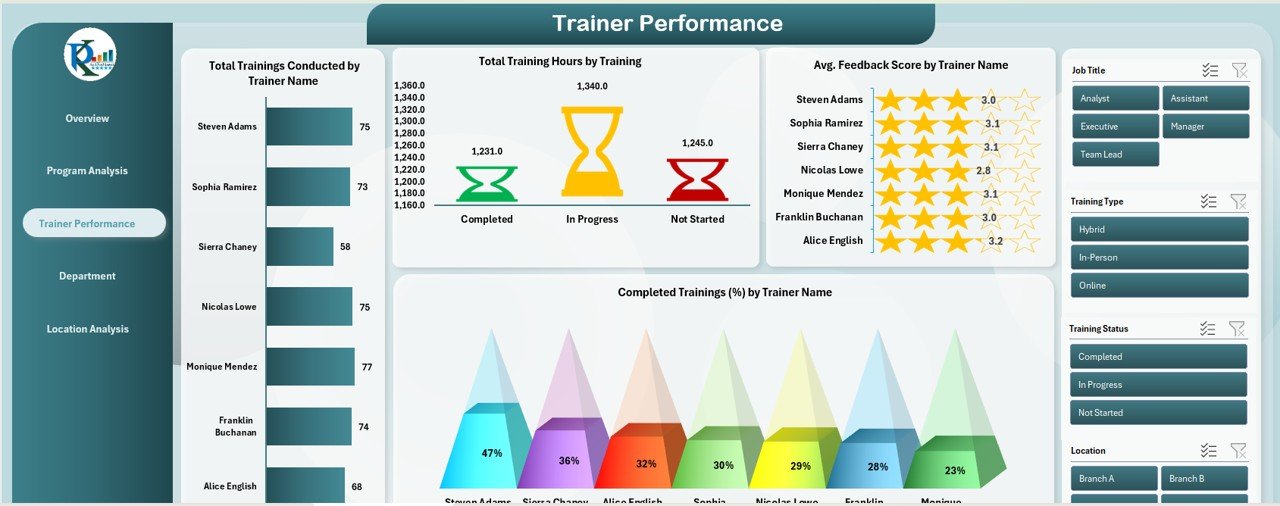
3. Trainer Performance Sheet Tab
This sheet focuses on tracking the performance of individual trainers. It includes:
Charts:
- Total Trainings Conducted by Trainer Name: Shows the number of trainings conducted by each trainer.
- Total Training Hours by Trainer: Displays the total number of hours each trainer has spent delivering training.
- Avg. Feedback Score by Trainer Name: Shows the average feedback score for each trainer.
- Completed Trainings (%) by Trainer Name: Displays the percentage of trainings completed by each trainer.
Click to buy Training and Development Dashboard in Excel
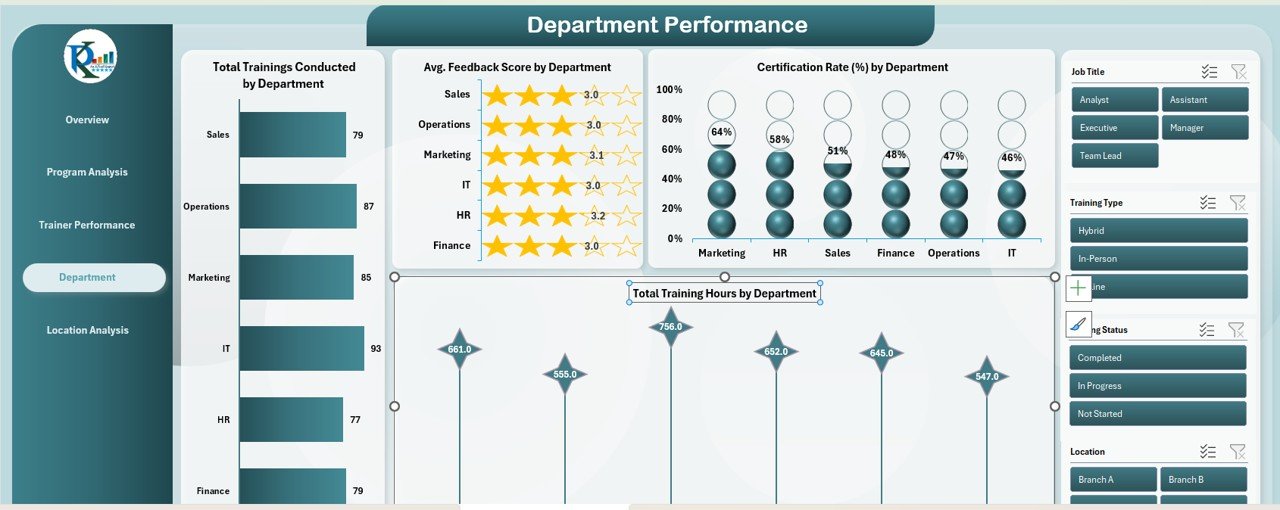
4. Department Performance Sheet Tab
This sheet tracks the training performance across various departments. It includes:
Charts:
- Total Trainings Conducted by Department: Shows the number of trainings conducted in each department.
- Avg. Feedback Score by Department: Displays the average feedback score for each department.
- Certification Rate (%) by Department: Shows the certification rate for each department.
- Total Training Hours by Department: Displays the total number of training hours dedicated to each department.
5. Location Analysis Sheet Tab
This sheet focuses on training performance across different locations. It includes:
Charts:
- Total Trainings Conducted by Location: Displays the number of trainings conducted at each location.
- Total Training Hours by Location: Shows the total hours spent on training at each location.
- Completed Trainings (%) by Location: Displays the percentage of trainings completed at each location.
- Certification Rate (%) by Location: Shows the certification rate for each location.

Click to buy Training and Development Dashboard in Excel
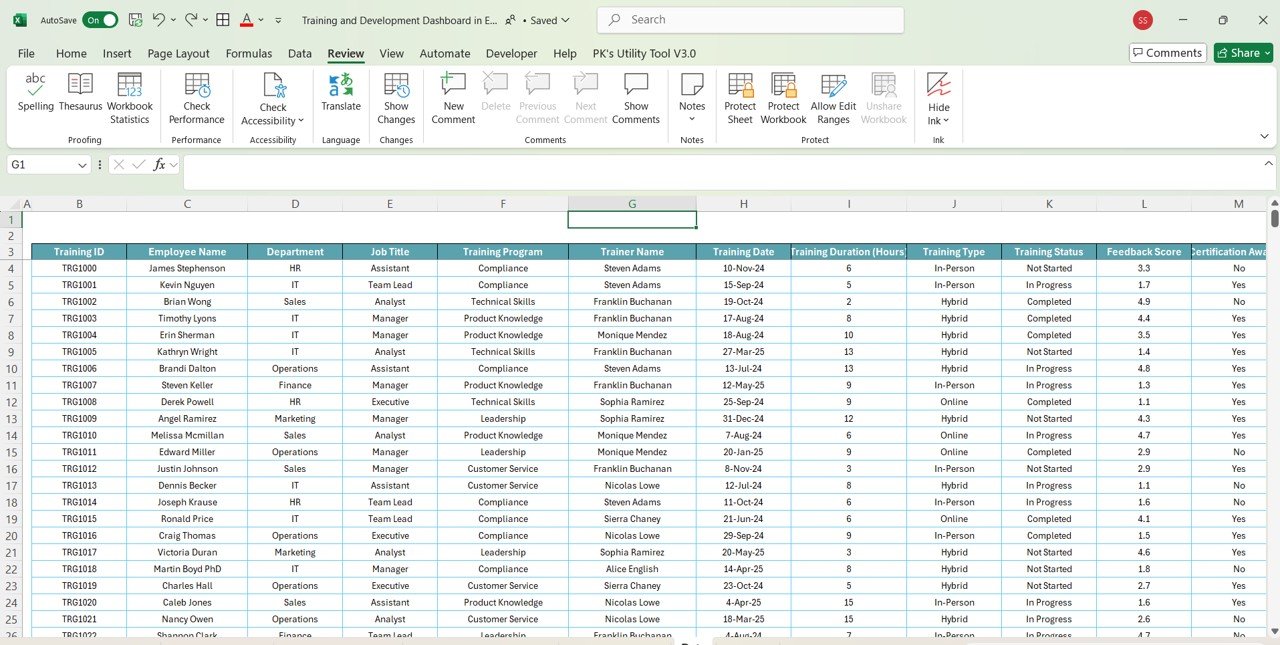
6. Data Sheet Tab
The Data Sheet is where all input data is entered. This sheet contains essential details about each training session, including:
Benefits of Using the Training and Development Dashboard
-
Comprehensive Insights: Track multiple aspects of your training programs, from trainer performance to department-level data.
-
Real-Time Data: The dashboard updates automatically as data is entered, providing real-time insights into training effectiveness.
-
Actionable Feedback: Use average feedback scores and completion rates to identify areas for improvement and celebrate success.
-
Improved Resource Allocation: Analyze the total training hours and certifications by department, location, and program to optimize resource allocation.
-
Enhanced Tracking: Monitor the progress of in-progress trainings and ensure all trainings are completed on time.
Best Practices for Using the Training and Development Dashboard
Click to buy Training and Development Dashboard in Excel
To get the most out of the Training and Development Dashboard in Excel, follow these best practices:
-
Regular Updates: Ensure that all data is updated regularly to maintain the accuracy and relevance of the dashboard.
-
Use Filters and Slicers: Utilize filters and slicers to drill down into specific training programs, departments, or time periods for deeper analysis.
-
Review Trainer Performance: Regularly monitor Trainer Performance to assess individual effectiveness and offer targeted support.
-
Track Employee Feedback: Continuously track and analyze feedback to improve the quality of your training programs.
-
Optimize Training Hours: Monitor Total Training Hours to ensure a balanced and effective training schedule.
Conclusion
The Training and Development Dashboard in Excel is an essential tool for managing and optimizing your organization’s training efforts. With detailed charts, KPIs, and performance metrics, it provides a clear view of your training programs, trainer effectiveness, and employee progress. By leveraging this dashboard, you can ensure that your training programs are well-executed, provide value to employees, and contribute to the overall success of the organization.
Frequently Asked Questions (FAQs)
Click to buy Training and Development Dashboard in Excel
1. What KPIs are tracked in the Training and Development Dashboard?
The dashboard tracks KPIs such as Total Trainings Conducted, Avg. Feedback Score, Certification Rate, Total Training Hours, and more.
2. Can I customize the dashboard to track additional metrics?
Yes, the dashboard is customizable. You can add or modify KPIs, charts, and data fields to meet your specific training needs.
3. How do I track trainer performance?
The Trainer Performance Sheet helps you track metrics such as the number of trainings conducted, training hours, feedback scores, and completion rates for each trainer.
4. How often should the data be updated?
It’s recommended to update the data regularly, ideally after each training session, to maintain accurate performance tracking.
5. Can this dashboard be used for different types of training programs?
Yes, the dashboard is flexible and can be adapted to track various types of training programs across different departments and locations.
Visit our YouTube channel to learn step-by-step video tutorials
Watch the step-by-step video Demo:
Click to buy Training and Development Dashboard in Excel