Managing a training budget can be overwhelming without a clear and structured system. Organizations often struggle to track spending, allocate resources efficiently, and analyze how training investments perform across departments. That’s where the Training Budget Dashboard in Excel steps in — a powerful, ready-to-use template that simplifies the entire process.
In this article, we’ll explore everything you need to know about this dashboard: what it is, how it works, its key features, benefits, best practices, and common questions.
Click to Purchases Training Budget Dashboard in Excel
What is a Training Budget Dashboard in Excel?
A Training Budget Dashboard in Excel is a visual and interactive tool designed to help organizations manage their training-related financial data. It allows HR professionals, L&D managers, and finance teams to:
- Track training expenses and compare them with allocated budgets
- Analyze overspending and underspending trends
- Monitor performance by department, program, trainer, and month
- Make data-driven decisions to optimize future training plans
This template is built entirely in Microsoft Excel, requiring no coding or complex setup.
Key Features of the Dashboard
The dashboard is divided into five analytical pages, along with data and support sheets. Each page focuses on a different aspect of budget tracking and training analysis.
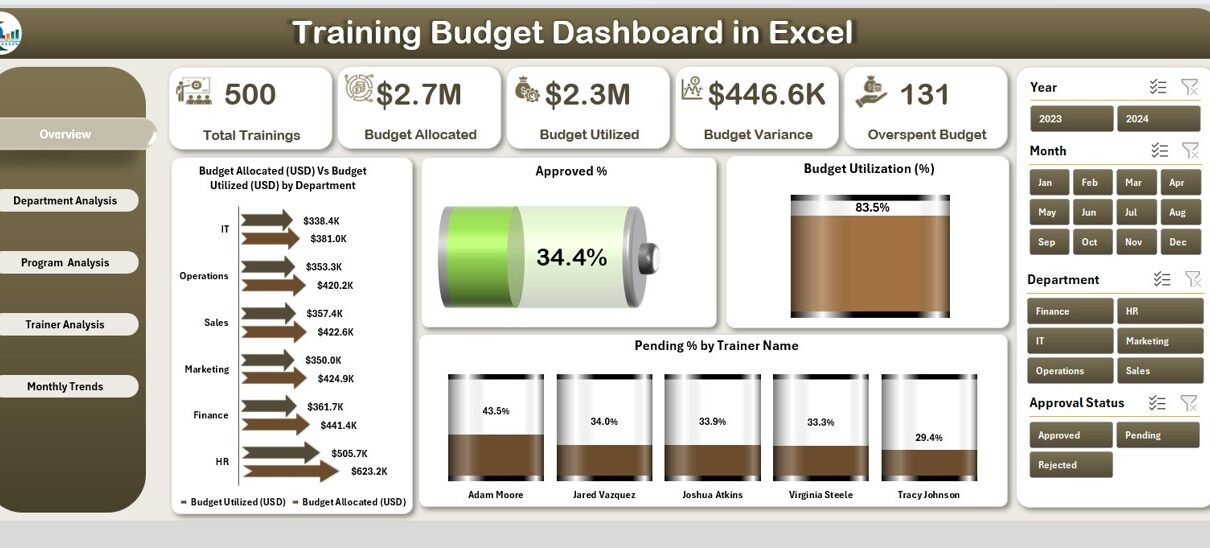
Overview Page
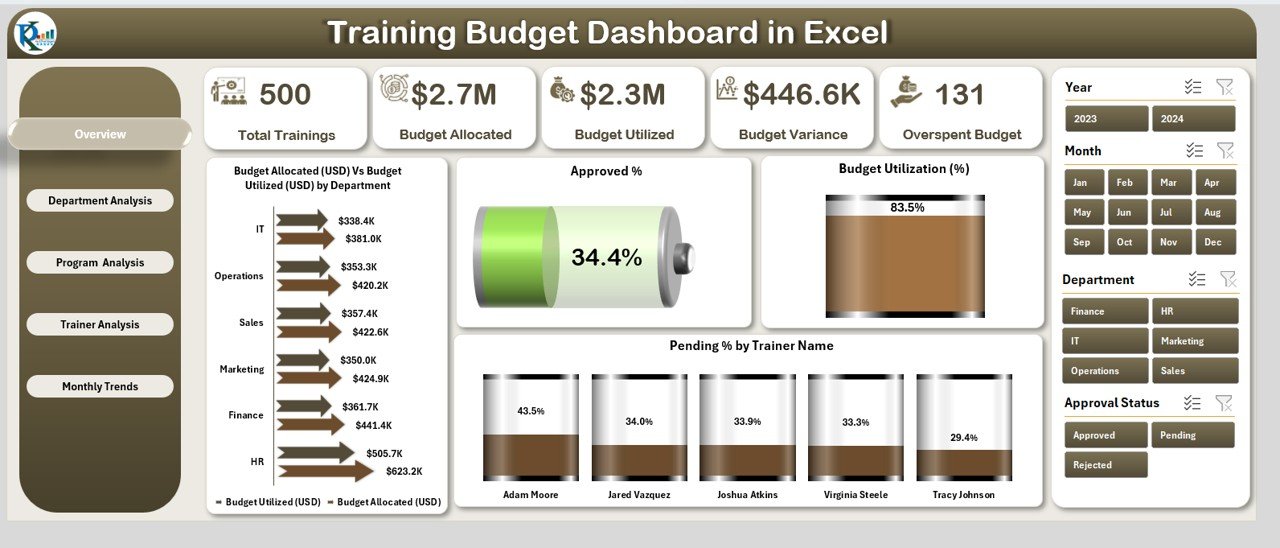
The Overview Page gives you a high-level summary of all key training budget metrics.
- Page Navigator on the left helps you jump to different pages quickly
- 5 Cards display overall statistics
4 Charts visualize:
- Budget Allocation (USD) vs. Budget Utilized (USD) by Department
- Approved %
- Budget Utilization (%)
- Pending % by Trainer Name
Department Analysis Page
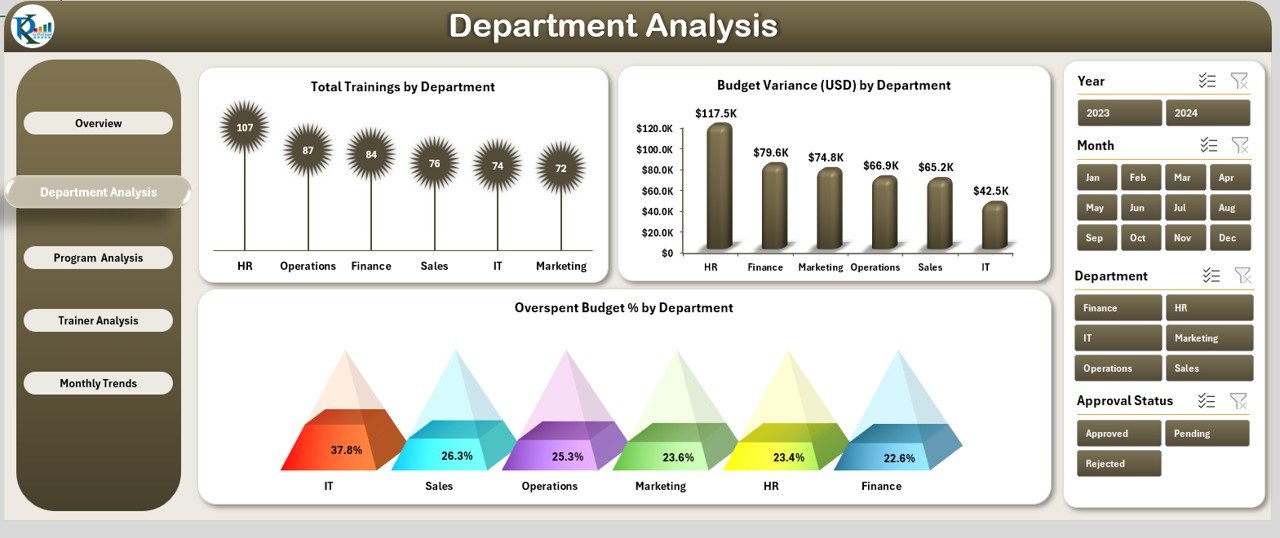
This page drills down into training performance across departments.
- Slicer on the right helps filter data
3 Charts show:
- Total Trainings by Department
- Budget Variance (USD) by Department
- Overspend Budget % by Department
Program Analysis Page
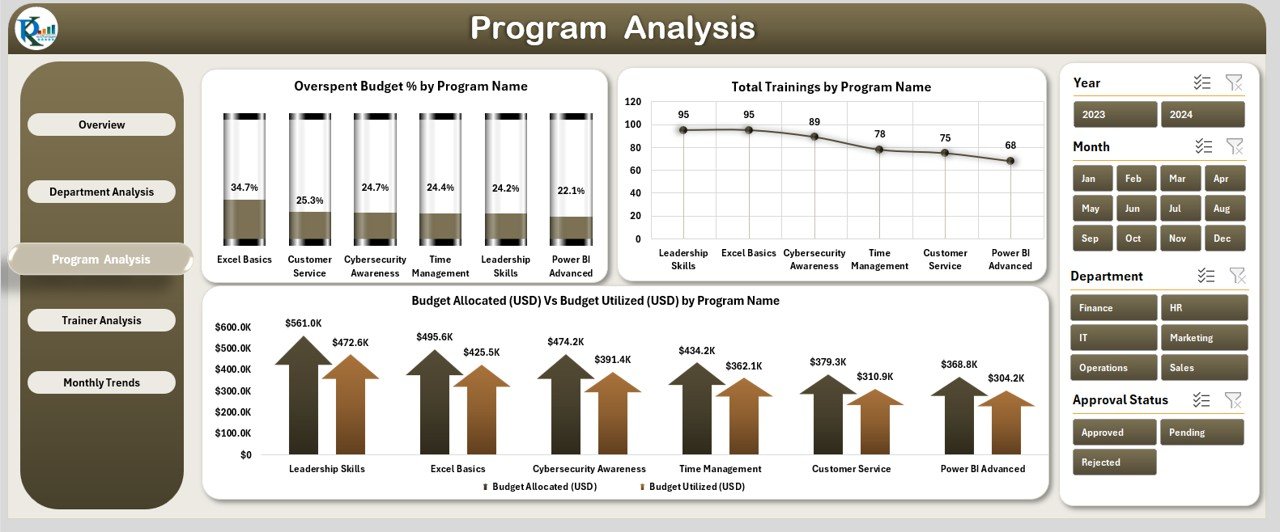
Program-level insights help you evaluate which training programs are most effective.
Click to Purchases Training Budget Dashboard in Excel
3 Visuals include:
- Overspend Budget % by Program Name
- Total Trainings by Program Name
- Budget Allocation (USD) vs. Budget Utilized (USD) by Program Name
Trainer Analysis Page
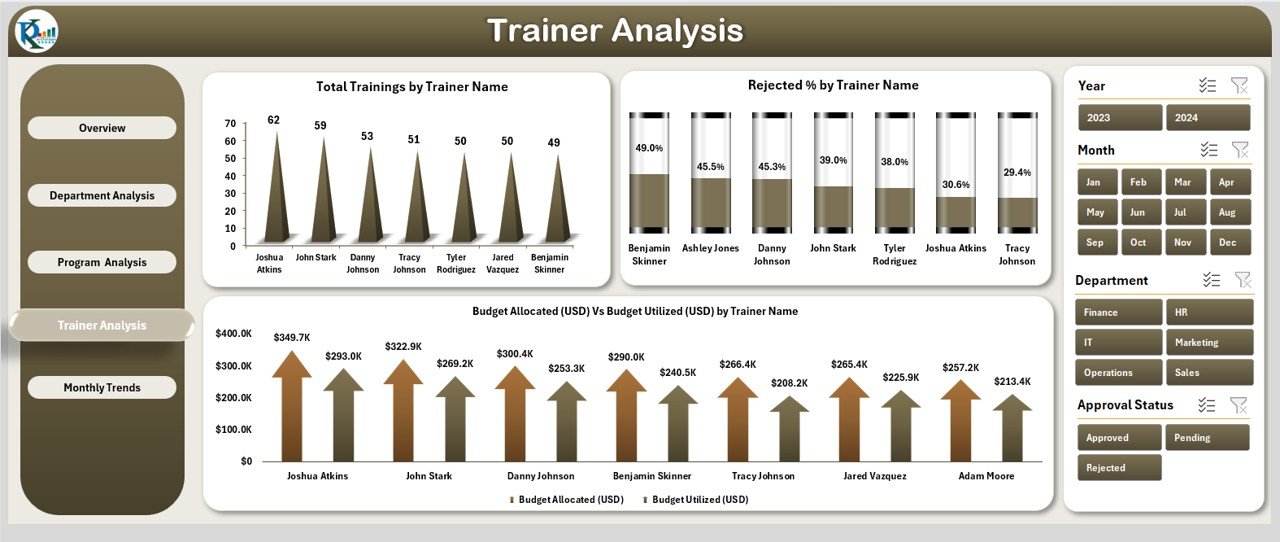
This section helps assess trainer performance and budget efficiency.
Charts Display:
- Total Trainings by Trainer Name
- Reject % by Trainer Name
- Budget Allocation (USD) vs. Budget Utilized (USD) by Trainer Name
Monthly Trends Page
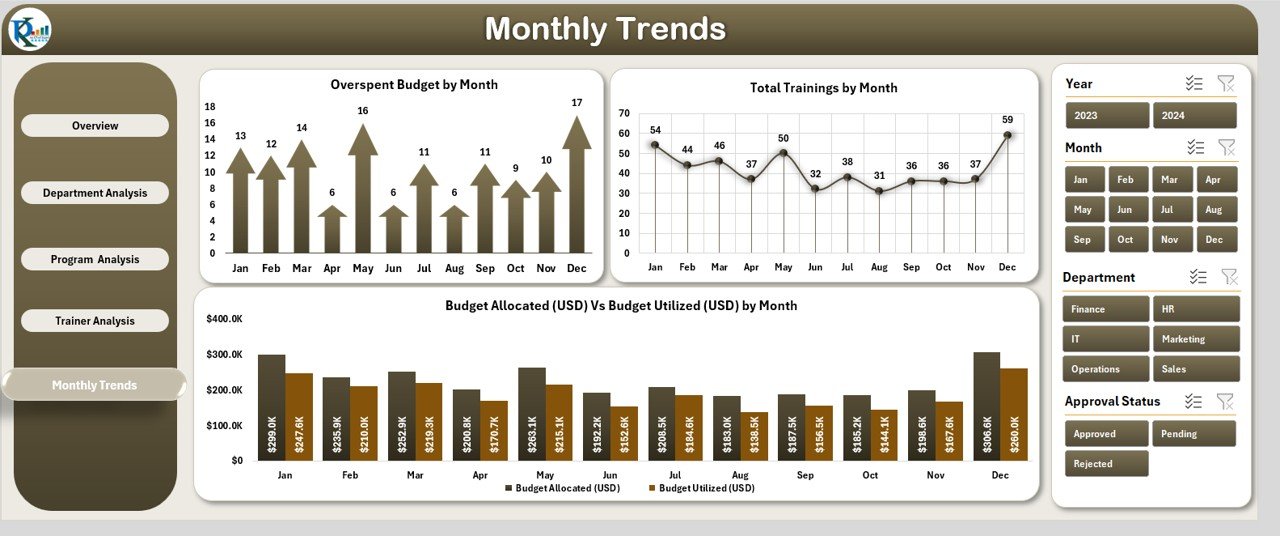
Track trends over time with these month-wise visuals:
- Overspend Budget by Month
- Total Trainings by Month
- Budget Allocation (USD) vs. Budget Utilized (USD) by Month
Data Sheet
This is where you input all your raw data:
- Department
- Program Name
- Trainer Name
- Training Date
- Budget Allocation
- Budget Utilized
- Status (Approved, Rejected, Pending)
Support Sheet
Used for dropdown lists and slicer filters. It includes:
- Lists of departments, programs, trainers, months
- Status options
Why Should You Use a Training Budget Dashboard in Excel?
Using Excel to manage your training budget may seem traditional, but it remains incredibly effective when done right. Here’s why:
- No additional software needed
- Easy customization
- Highly visual interface
- Real-time tracking and analysis
- User-friendly for non-technical teams
Advantages of Training Budget Dashboard in Excel
Here are some clear benefits you can expect:
✅ Centralized Overview: Get a snapshot of all key metrics in one place
✅ Enhanced Decision Making: Make better decisions using real-time data
✅ Overspend Alerts: Instantly identify which department or trainer is over budget
✅ Monthly Trend Analysis: Spot patterns and adjust planning accordingly
✅ Improved Accountability: Know which departments or trainers are using their budgets wisely
✅ Time-Saving: Automated calculations and visuals reduce manual reporting
Best Practices for the Training Budget Dashboard in Excel
To make the most of your dashboard, follow these proven best practices:
1. Update Data Regularly
Keep the Data Sheet up to date with each new training program, allocation, or utilization.
2. Use Consistent Categories
Standardize department names, trainer names, and program titles to maintain data accuracy.
3. Set Budget Thresholds
Set conditional formatting rules to highlight overspend areas.
4. Back Up Frequently
Save versions regularly to avoid data loss or corruption.
5. Review Monthly Trends
Spend time each month reviewing patterns and making adjustments.
6. Customize for Your Needs
Modify chart types or data fields to reflect your company’s structure.
How to Use the Dashboard Effectively
Using the dashboard is straightforward. Here’s a quick step-by-step guide:
- Enter Data: Fill the Data Sheet with actual training records.
- Set Up Filters: Update the Support Sheet for slicers to work properly.
- Navigate Pages: Use the Page Navigator to move between sheets.
- Analyze Visuals: Focus on charts and KPI cards to monitor status.
- Take Action: Use insights to adjust future training plans and budgets.
Real-World Use Case
Company XYZ, an IT firm, implemented the Training Budget Dashboard to monitor L&D investments. Within 3 months:
- Budget overruns dropped by 30%
- Department managers could clearly see underutilized funds
- Monthly training reports took 70% less time to prepare
- They redirected unspent budgets to more impactful programs
Frequently Asked Questions (FAQs)
1. **Can I customize this dashboard for my company?
Yes, you can fully customize chart types, slicers, fields, and layout to fit your organization’s needs.
2. Do I need advanced Excel skills to use it?
Not at all. Basic Excel knowledge is enough. The dashboard includes dropdowns, charts, and slicers that are user-friendly.
3. How often should I update the data?
Ideally, you should update the data every time there is a new training program conducted or budget change made.
4. Is this dashboard compatible with older Excel versions?
Yes, it works with Excel 2013 and above, but some slicer functionalities are best viewed in Excel 2016 and newer.
5. What happens if I overspend my budget?
The dashboard will highlight overspent departments, programs, or trainers, helping you take corrective action immediately.
6. Can I add more charts or KPIs?
Absolutely. Excel’s flexibility allows you to insert additional charts, metrics, or even pivot tables.
Conclusion
A Training Budget Dashboard in Excel is more than just a tracking tool. It empowers teams to make informed financial decisions, optimize training programs, and ensure responsible budget utilization. Whether you’re part of a small business or a large enterprise, this dashboard can bring clarity and control to your training budget planning.
Click to Purchases Training Budget Dashboard in Excel
Visit our YouTube channel to learn step-by-step video tutorials
Watch the step-by-step video tutorial: